Die Überwachung der CPU-Temperatur ist wahrscheinlich eines der besten Dinge, die Sie tun können, um sich um Ihren Windows-Computer zu kümmern. Und moderne Tools zur Überwachung der CPU-Temperatur können Ihnen dabei helfen.
Aber warum brauchen Sie das überhaupt?
Die Sache ist die: Alle PCs geben Wärme ab. Er kann jedoch nur eine begrenzte Menge an Wärme vertragen, bei deren Überschreitung die Hardware beschädigt werden kann. Der PC besteht aus vielen Teilen, wie z.B. einer Festplatte, einem Motherboard und mehr, die sich während des Betriebs erhitzen. Die Hitze ist bis zu einem gewissen Grad normal und kann die CPU schwer beschädigen, wenn sie nicht reguliert wird.
Werfen wir also einen Blick auf einige der besten CPU-Temperaturmonitore, die Ihnen dabei helfen, die Wärme Ihrer Computer-CPU zu regulieren, um deren Spitzenleistung, Langlebigkeit und Zuverlässigkeit zu gewährleisten.
Core Temp
Wenn Sie sich Sorgen um die CPU-Temperatur Ihres Computers machen, sollten Sie die neueste Version von Core Temp ausprobieren, um die Temperatur zu überprüfen. Es handelt sich dabei um ein kompaktes, robustes und unkompliziertes Programm zur Überwachung der CPU-Temperatur und anderer Informationen.
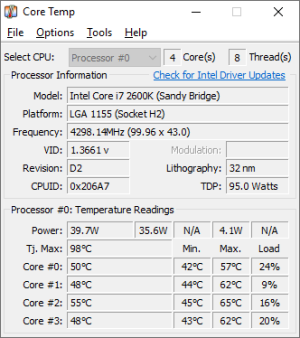
Es zeigt die Temperatur jedes einzelnen Kerns des Prozessors im System an. Sie sehen die Temperaturschwankungen bei unterschiedlichen Arbeitsbelastungen in Echtzeit. Das Programm ist unabhängig von der Hauptplatine und jeder Zentralprozessor verfügt über einen Digital Thermal Sensor in allen Produkten.
Der DTS liefert im Vergleich zu konventionellen Wärmesensoren höhere und präzisere Temperaturmesswerte. Sie finden den DTS in aktuellen x86-Prozessoren von AMD, VIA und Intel. Core Temp ist einfach und leicht zu bedienen und ermöglicht Ihnen ein hohes Maß an Erweiterbarkeit und Anpassung.
Core Temp verfügt über eine Plattform für Add-ons und Plugins, die die Funktionalität um neue Funktionen erweitern. Wenn Sie die Temperatur der CPU von außen überprüfen möchten, ist dies sowohl auf Windows- als auch auf Android-Telefonen möglich. Die neueste Version verfügt über eine grafische Ansicht, die Speicherauslastung und die Auflistung von Prozessorlast/Temperatur.
Laden Sie CoreTempMC und Core Temp Gadget herunter, um Farbe, Größe und Informationstext zu verbessern. Die neue Version bietet Unterstützung für AMD Zen 2 und Zen 3 APU, Intel Rocket Lake, Preliminary Alder Lake, Meteor Lake.
Es unterstützt Windows 11, 10, 8, 7, Vista, XP, 2016 Server, 2012 Server, 2008 Server und 2003 Server. Die unterstützten Prozessoren sind Intel, AMD und VIA x86.
NZXT CAM
NZXT CAM ist die beste Lösung für die Überwachung der CPU-Temperatur Ihres Gaming-PCs. Es kann Temperatur, Geräte und Leistung von einer einzigen App aus verwalten. Es handelt sich um eine effiziente, benutzerfreundliche und schnelle Anwendung, mit der Sie alles auf dem Computer kontrollieren können.
Mit NZXT CAM können Sie sehen, was in Ihrem Computer vor sich geht, von der Auslastung des Prozessors bis zum Bandbreitenverbrauch. Sie können auch die Arbeit von Anwendungen auf jedem Rechner sehen und die Probleme schnell verfolgen, um die Leistung Ihres Computers zu verbessern.
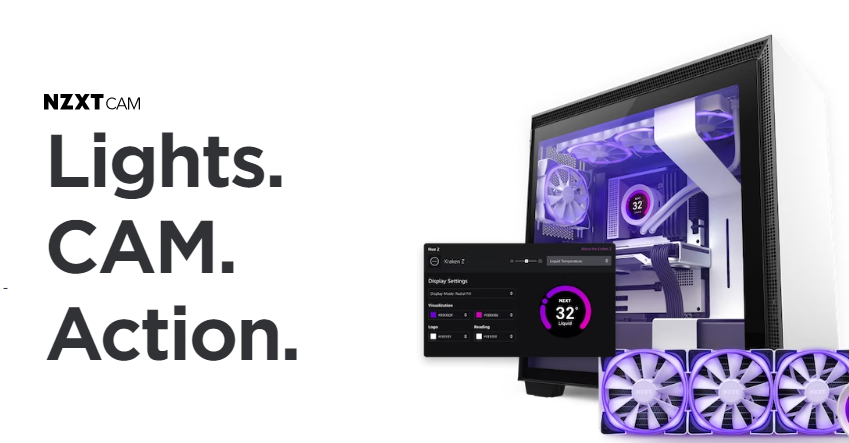
Wenn Sie sich in einem Spiel befinden, können Sie Temperaturen, Bandbreite, FPS und mehr mit einem superstabilen und unauffälligen In-Game-Overlay verfolgen. NZXT CAM unterstützt die gespielte Zeit, die aktuellen FPS, die GPU/CPU-Temperatur, den Akkustand, die GPU/CPU-Last und vieles mehr.
Lesen Sie auch: Wie man den FPS-Zähler beim Spielen auf dem PC anzeigt
Die Software bietet eine schöne und intuitive Benutzeroberfläche, über die Sie Lüftergeschwindigkeiten, PSU-Spannungen, Gehäusebeleuchtung und vieles mehr steuern können. Laden Sie die CAM-Software der nächsten Generation herunter und beginnen Sie mit der Überprüfung der CPU-Temperatur.
Speccy
Möchten Sie herausfinden, warum Ihr Computer so heiß ist?
Speccy hat die Informationen, die Sie wissen wollen. Es ist ein leichtgewichtiges, fortschrittliches System und ein schnelles Informationstool für den Computer. Mit Speccy können Sie sich einen schnellen Überblick über das Ergebnis verschaffen oder tiefer in die Hardware Ihres PCs eintauchen, um Kauf- und Aufrüstungsentscheidungen zu treffen.
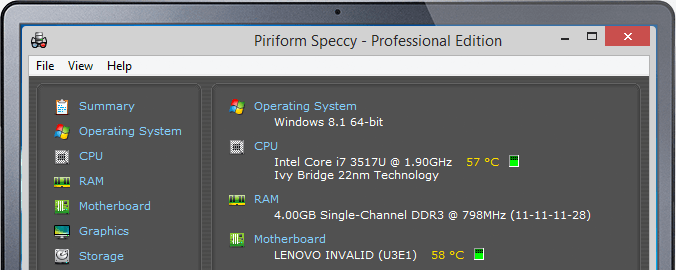
In einer einzigen Oberfläche finden Sie jedes Detail, so dass Sie Ihre Zeit sparen können, wenn Sie Statistiken wie Motherboard, CPU, Grafikkarten, RAM und mehr abrufen. Werden Sie zum Profi bei der Lösung von Problemen, bevor sie auftreten, indem Sie die Temperaturen der kritischen Komponenten sehen.
Sie können Ihre Ergebnisse als XML, Textdatei oder Schnappschuss speichern, um sie mit anderen zu teilen. Überprüfen Sie die technischen Daten Ihres Computers und stellen Sie fest, ob er eine Diagnose benötigt. Das Tool hilft Ihnen, die Leistung Ihres PCs zu steigern, ohne die Hardware aufzurüsten. Laden Sie die kostenlose Version herunter, um erweiterte PC-Einblicke zu erhalten, oder kaufen Sie das Tool, um weitere Funktionen zu erhalten.
Open Hardware Monitor
Open Hardware Monitor ist eine Open-Source-Software, die die Lüftergeschwindigkeiten, die Last, die Taktraten, die Spannungen und die Temperatursensoren eines Computers überwacht. Es unterstützt viele Hardware-Überwachungschips, die auf Mainboards zu finden sind.
Das Tool liest die Kerntemperatursensoren von AMD- und Intel-Prozessoren aus, um die CPU-Temperatur zu überprüfen. Es zeigt auch die Sensoren von Nvidia- und ATI-Grafikkarten sowie die SMART- und Festplattentemperatur an.

Sie können die Werte im Hauptfenster in der Taskleiste und in einem anpassbaren Desktop-Gadget sehen. Open Hardware Monitor läuft unter 64-Bit und 32-Bit Microsoft Windows XP, Vista, 7, 8, 8.1, 10 und x86-basierten Linux-Betriebssystemen ohne Installation.
Darüber hinaus bietet es neue Funktionen und Fehlerbehebungen. Es kann jetzt die Super-I/O-Chips ITE IT8655E, IT8686E und IT8665E erkennen und verbessert die Unterstützung für AMD-GPUs, AMD-GPUs und CPUs. Es verbessert auch die Berechnung der Super-I/O-Drehzahl von Nuvoton NCT679XD für Lüfter.
Das Tool läuft unter Microsoft Windows zusammen mit dem .NET Framework der Version 4.5. Laden Sie die Zip-Datei der Software herunter, entpacken Sie sie, um sie zu installieren, und beginnen Sie mit der Überwachung.
HWMonitor
Müssen Sie die Temperaturen, die Lüftergeschwindigkeit und die Spannungen Ihres Computers überwachen?
Versuchen Sie es mit HWMonitor – einem Hardware-Überwachungsprogramm, mit dem Sie die Sensoren des PC-Systems auslesen können. Es verarbeitet Standard-Sensorchips wie Winbond ICs, die ITE IT87-Serie und andere. Es kann die Temperatur der Grafikkarten-GPUs, die Wärmesensoren der CPUs auf dem Die-Kern und die Festplattentemperatur über SMART auslesen.

HWMonitor unterstützt Intel Alder Lake, DDR5-Speicher und die Z6xx-Plattform und verwendet die neueste Version 1.44 für Windows mit AMD Ryzen 5300G, 5300G und 5600G APUs. Es unterstützt auch AMD Radeon RX 6700 XT und 6900 XT GPUs.
In der neuen Version fügt es GDDR6 und Hotspot-Temperaturen bei den NVIDIA-GPUs hinzu. Es funktioniert sowohl mit 32-Bit- als auch mit 64-Bit-Versionen. Sie können eine .exe-Datei für die Installation herunterladen oder eine .zip-Datei, um sie zu entpacken und auf Ihrem Computer zu installieren.
HWiNFO
HWiNFO ist eine Diagnose- und professionelle Systeminformationssoftware für Vorgänge wie Hardwareanalyse, Berichterstellung und Überwachung für DOS und Windows.
Erhalten Sie immer detaillierte Informationen über die Hardware mit den neuesten Standards und Technologien. Überwachen Sie außerdem die Systemkomponenten genau, um Fehler vorherzusagen und den aktuellen Status zu ermitteln, und passen Sie die Benutzeroberfläche mit verschiedenen Optionen an.
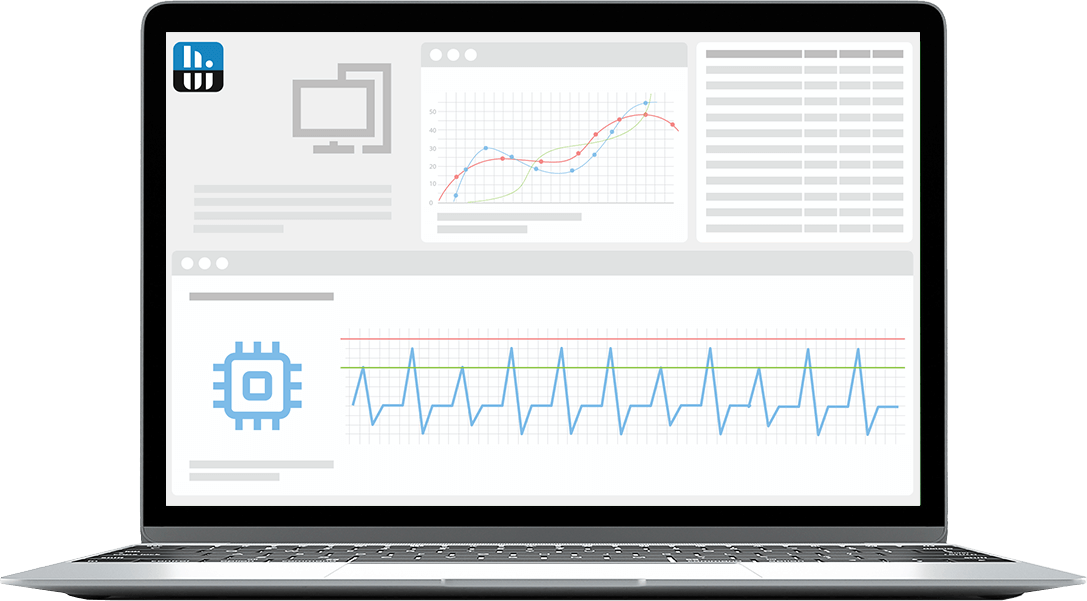
Greifen Sie auf ein umfangreiches Berichtswesen mit mehreren Berichten, Schnittstellen zu verschiedenen Add-Ons und Tools sowie Statusprotokollierung zu. Es unterstützt die AMD- und Intel-Prozessorfamilie, Grafikkarten und Chipsätze. Darüber hinaus hilft es, Überlastung, Leistungsverlust und Überhitzung zu erkennen.
Das Tool überwacht auch verschiedene Hardware- und Systemparameter, darunter GPUs, CPUs, Peripheriegeräte, Laufwerke, Motherboards usw. Sie können die Ergebnisse in CSV-, HTML- und XML-Berichte exportieren. Außerdem zeigt es die Ergebnisse in verschiedenen Formen wie Tabellen, OSD, Tray Icons usw. an. Laden Sie die Software herunter und beginnen Sie zu analysieren, was in Ihrem PC vor sich geht.
AIDA64
Sind Sie auf der Suche nach einer branchenführenden Diagnose-, Benchmarking- und Systeminformationslösung für Ingenieure und IT-Techniker in Unternehmen?
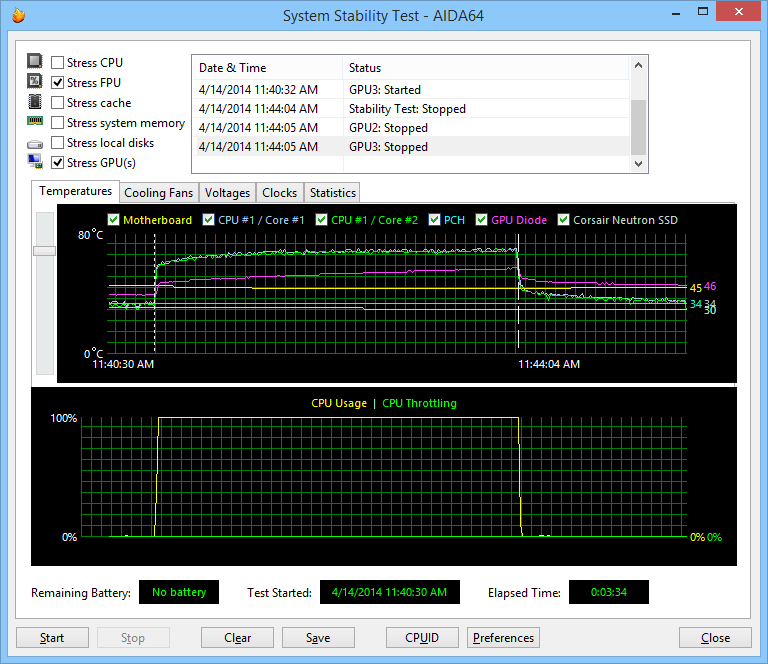
Entscheiden Sie sich für AIDA64. Es verfügt über eine Hardware-Erkennungs-Engine, die detaillierte Informationen über die Software liefert und Diagnoseunterstützung sowie Funktionen zur Übertaktung bietet. Es überwacht auch die Sensoren, um genaue Temperatur-, Lüftergeschwindigkeits- und Spannungswerte zu erfassen, während die Diagnosefunktion dabei hilft, Hardwareprobleme zu erkennen und zu vermeiden.
Das Tool bietet Benchmarks zur Messung der einzelnen Hardwareleistungen und des gesamten Systems. Außerdem ist AIDA64 Engineer mit 32-Bit- und 64-Bit-Windows-Editionen kompatibel, einschließlich Windows Server 2019 und Windows 10.
Sie erhalten mehr als fünfzig Seiten mit Informationen über die Hardwarekonfiguration, installierte Programme, Sicherheitsanwendungen, Windows-Einstellungen und Softwarelizenzen. Es führt Systemstabilitätstests durch, indem es ein Multi-Thread-Stressmodul verwendet. Es umfasst auch Stresstests für Festplatten, OpenCL GPGPU und SSD-Videoadapter und liefert stets genaue Ergebnisse.
SensorPanel hilft bei der Erstellung eines benutzerdefinierten Panels, das perfekt zum Design passt, um alle Sensoren, die Auslastung, das Kühlsystem und vieles mehr zu überwachen. Die neueste Version unterstützt VFD- und LCD-Bildschirme und überwacht die Sensorwerte aus der Ferne auf Tablets und Laptops.
AIDA64 zeigt die gemessenen Werte auf dem OSD-Panel, dem Desktop-Gadget, dem Razer SwitchBlade LCD, dem Logitech G15/G19 Gaming Keyboard LCD und den Symbolen im System Tray an. Dafür benötigen Sie einen Intel Pentium-Prozessor oder höher, 80 MB freien Speicherplatz und ein Windows-Betriebssystem.
Die Software ist für $199,90 erhältlich.
Damit sind wir am Ende der Liste angelangt. Lassen Sie uns nun verstehen, was eine normale CPU-Temperatur ist und warum sie überwacht werden sollte.
Was ist eine normale CPU-Temperatur?

Es gibt drei Kategorien, in die Sie die CPU-Temperaturen einteilen können:
- Normal: Sie kann 45-50 Grad Celsius (113-122 Grad Fahrenheit) betragen, wenn Ihr Computer im Leerlauf ist.
- Durchschnittlich: Die Temperatur kann 70-80 Grad Celsius (158-176 Grad Fahrenheit) betragen, wenn Sie den Computer für intensive Aufgaben wie die Wiedergabe eines Videos, die Bearbeitung von Grafiken, das Rendern von Videos und andere Aufgaben verwenden.
- Hoch: Die Temperatur kann 80-100 Grad Celsius (176-212 Grad Fahrenheit) betragen, wenn Sie intensivere Aufgaben durchführen, die die Temperatur und die Belastung erhöhen. Bei dieser Temperatur sinkt die Taktrate. Sie sollten diese Temperatur also unbedingt überprüfen und senken.
Aber was sollten Sie tun, wenn die Temperatur 80 Grad Celsius übersteigt?
Versuchen Sie dies:
- Stellen Sie fest, ob Ihr PC staubfrei ist und ob sich der Lüfter unter der gegebenen Last dreht.
- Stellen Sie sicher, dass der Computer in einer kühlen Umgebung steht, denn übermäßige Raumwärme und Luftfeuchtigkeit sind ebenfalls gefährlich für Ihren Computer
- Stoppen Sie die CPU-Übertaktung, denn die Übertaktung erhöht die Computerleistung und erzeugt mehr Wärme.
- Sie können auch im Abstand von drei Jahren eine Wärmeleitpaste zwischen der CPU und ihrem Kühler auftragen.
Wenn die Temperatur ungewöhnlich stark ansteigt, kann es zu einer abrupten Abschaltung des Systems kommen. Die Leistung kann sich verlangsamen, was Sie oder Ihre Mitarbeiter bei der Arbeit spüren können. Im schlimmsten Fall kann die Hitze die Hauptplatine, notwendige Chips oder andere Geräte im Inneren der CPU beschädigen.
Um all dies zu vermeiden und Ihr System und seine Leistung zu schützen, müssen Sie die CPU Ihres Computers mit einem CPU-Temperaturüberwachungsprogramm überwachen.
Was ist ein Werkzeug zur Überwachung der CPU-Temperatur?
CPU-Temperaturmonitore sind Software-Tools, die die Temperatur Ihrer CPU, die Spannung, die Lüftergeschwindigkeit, die Batterie usw. überprüfen und genaue Informationen liefern. Das Sammeln dieser Messdaten von Sensoren kann Ihnen helfen, Abhilfemaßnahmen zu ergreifen, um zu verhindern, dass Ihre CPU beschädigt wird.

Diese Tools verfügen über viele nützliche Funktionen, wie z.B.:
- Ermöglichung eines hohen Anpassungsgrades
- Detaillierte Daten über die Computerhardware
- Bereitstellung der CPU-Temperatur in Echtzeit
- Die Möglichkeit, Bandbreite und Auslastung zu überprüfen
Um diese Tools zu verwenden, befolgen Sie diese einfache Vorgehensweise:
- Laden Sie eine Software zur Überwachung der CPU-Temperatur herunter und installieren Sie sie auf Ihrem Windows Desktop oder Laptop
- Öffnen Sie sie auf Ihrem PC
- Sehen Sie sich die Temperaturinformationen an
Eine Software zur Überwachung der CPU-Temperatur mag zwar kompliziert erscheinen, ist aber eigentlich ganz einfach. Allerdings benötigen Sie ein gewisses Maß an technischem Wissen, um die Software optimal nutzen zu können.
Wer braucht einen CPU-Temperaturmonitor?
Von alltäglichen Computernutzern wie vielbeschäftigten Berufstätigen bis hin zu Spielern kann ein CPU-Temperaturmonitor für jeden ein praktisches Werkzeug sein. Denn es gibt viele Faktoren, die die CPU-Temperatur in die Höhe treiben können, wie z.B.:

- Verwendung von Hochleistungsanwendungen
- Lüfterdrehzahl
- Staub
- Malware-Angriffe, Viren, Trojaner, Würmer, usw.
CPU-Temperaturüberwachungen sind nützlich, insbesondere für:
Gamer: Sie verwenden High-End-Videospiele, die leistungsstarke Computer erfordern. Wenn sie also Videospiele spielen, kann die Temperatur ansteigen. Außerdem tauschen Gamer einige Teile aus, um sie leistungsfähiger zu machen, und übertakten ihren Computer, um Online-Spiele flüssiger laufen zu lassen. Dadurch kann die CPU-Temperatur weiter ansteigen.
Grafikdesigner: Wie Gamer benötigen auch Grafikdesigner leistungsstarke Computer, um ihren Designprozess ohne Zeitverlust durchführen zu können.
Berufstätige: Berufstätige, die stundenlang auf ihren Computer zugreifen müssen, erleben überhitzte Computer. Sie können auch mit Viren wie Datei- und Systeminfektoren und Makros, Würmern aus dem Internet, Netzwerk oder E-Mails und Trojanern wie Rootkit und Backdoor konfrontiert werden. All dies kann die CPU-Temperatur erhöhen.
Wenn Sie also in eine dieser drei Kategorien fallen, können Sie einen CPU-Temperaturmonitor verwenden. Aber wie helfen diese Temperaturmonitore? Lassen Sie es uns herausfinden.
Was sind die Vorteile der Verwendung von CPU-Temperaturmonitoren?

Hilft bei der Steigerung der Computerleistung
Durch die erhöhte CPU-Wärme wird die Leistung des Computers beeinträchtigt. Es kann sein, dass Sie beim Arbeiten langsamer werden, was Ihre Produktivität beeinträchtigen kann. Mit einem CPU-Temperaturmonitor können Sie daher sicherstellen, dass Ihr Computer mit optimaler Geschwindigkeit läuft.
Schützt den PC vor Hitzeschäden
Übermäßige Hitze kann Ihre CPU und ihre Teile schwer beschädigen. Infolgedessen kommt es zu Fehlfunktionen und einem abrupten Herunterfahren des Systems. Der CPU-Temperaturmonitor kann diese Temperatur erkennen und Sie können rechtzeitig vorbeugende Maßnahmen ergreifen, um mögliche Schäden abzuwenden.
Erhöht die Langlebigkeit des Computers
Nehmen wir an, Sie können mit dem CPU-Temperaturmonitor sicherstellen, dass die CPU vor übermäßiger Hitze, Feuchtigkeit und anderen schädlichen Faktoren geschützt ist. In diesem Fall verlängern Sie die Lebensdauer Ihres Computersystems.
Sicherstellung der Betriebszeit und Zuverlässigkeit des Rechenzentrums
Um eine optimale Betriebszeit und Zuverlässigkeit in einem Rechenzentrum zu erreichen, sind günstige Umgebungsbedingungen für den Computer erforderlich. Dazu gehören die empfohlenen Werte für Temperatur, Stromverbrauch, Luftfeuchtigkeit usw. Daher müssen Sie Ihre Serverräume sowohl mit internen als auch mit externen Sensoren überwachen.
Es gibt noch ein paar andere Dinge, die Sie tun können, um sicherzustellen, dass Ihr PC optimal funktioniert.
Bonus-Tipps für die Gesunderhaltung der CPU
- Reinigen Sie Ihr Computersystem regelmäßig, einschließlich der Lüfter und des Raums, in dem es aufgestellt ist, um sicherzustellen, dass sich kein Staub im Inneren befindet, der die CPU-Temperatur erhöht
- Halten Sie den Computer von Fenstern oder Lüftungsöffnungen fern, die Staubpartikel anziehen können.
- Führen Sie regelmäßige Malware-Scans durch, damit sich in Ihrem Computer keine Malware, Viren, Würmer, Trojaner usw. einnisten.
- Halten Sie die Treiber immer auf dem neuesten Stand, um eine optimale Leistung zu gewährleisten.
- Entfernen Sie Hindernisse, die den Luftstrom Ihres Computers behindern
- Seien Sie vorsichtig bei der Übertaktung der CPU
- Fügen Sie nach Möglichkeit weitere Lüfter hinzu
- Rüsten Sie die CPU-Lüfter auf, wenn der verwendete Lüfter nicht mehr funktioniert
- Verwenden Sie eine Flüssigkeitskühlung, wenn Sie Ihren Computer für Videospiele oder andere intensive Anwendungen nutzen.
Mit diesen Tipps und einem Tool zur Überwachung der CPU-Temperatur sollte Ihr PC einwandfrei und ohne Probleme funktionieren.
Schlussfolgerung
Eine überhöhte Temperatur kann Ihrem Computer schweren Schaden zufügen. Sie kann durch Staub, Viren, die Verwendung von High-End-Videospielen oder andere intensive Aufgaben verursacht werden. Manchmal kann das Zurücksetzen Ihrer Grafikkarte und des Treibers die Leistung verbessern und Probleme mit hohen Temperaturen lösen.
Was auch immer der Fall ist, kümmern Sie sich um Ihren Computer und verhindern Sie, dass sich die CPU mit Hilfe des besten Tools zur Überwachung der CPU-Temperatur erhitzt und verbessern Sie seine Leistung, Lebensdauer und Zuverlässigkeit.

