Ein neues Tool von Google testet und gibt Ihnen Empfehlungen zur Verbesserung von Leistung, SEO, Sicherheit, Best Practices und Barrierefreiheit.
Google hat vor kurzem Lighthouse auf den Markt gebracht, ein Open-Source-Tool zur manuellen und automatischen Überprüfung Ihrer Website.

Welche Metriken werden von Google Lighthouse getestet?
Es gibt mehr als 75 Metriken, die es testet und Ihnen eine Gesamtbewertung gibt. Als Website-Besitzer, SEO-Analyst und Webmaster interessieren Sie sich vielleicht für einige der folgenden beliebten Metriken.
- Leistung – Zeit bis zur Interaktivität, Latenz, Geschwindigkeitsindex, Ressourcenoptimierung, TTFB, Asset-Lieferung, Ausführungszeit von Skripts, DOM-Größe usw.
- SEO – Mobilfreundlichkeit, Meta, Crawling, kanonisch, Struktur, usw.
- Best Practices – Bildoptimierung, JS-Bibliotheken, Browser-Fehlerprotokollierung, Zugriff über HTTPS, bekannte JS-Schwachstellen, usw
- Barrierefreiheit – Seitenelemente, Sprache, ARIA-Attribute, usw.
- PWA (Progressive Webanwendung) – Umleitung von HTTP auf HTTPS, Response Code ok, schnelles Laden auf 3G, Splash Screen, Viewport usw.
Es ist ein fantastisches Tool, das Sie auf vielfältige Weise nutzen können.
Das ist richtig – auf so viele Arten. Wenn Sie Entwickler sind, können Sie Node.js verwenden, um einen Test programmatisch auszuführen. Es gibt bereits einige Tools auf dem Markt, die von Lighthouse unterstützt werden und eine kontinuierliche Überwachung der Website-Performance bieten.
Lassen Sie uns herausfinden, wie Sie den Lighthouse-Test mit Ihrer Website durchführen.
Beginnen Sie mit der einfachsten Variante.
Messen Sie mit web.dev
Google hat web.dev vor ein paar Monaten veröffentlicht und sich großer Beliebtheit erfreut. Online zu testen ist ganz einfach.
Gehen Sie auf die Seite Measure und geben Sie die URL ein, um die Prüfung durchzuführen. Es dauert nur ein paar Sekunden und Sie sollten die detaillierte Berichterstattung mit der Gesamtbewertung sehen.
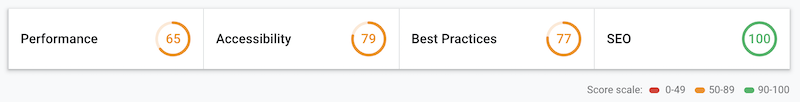
Die Ergebnisse zeigen auch die Erfolgskennzahlen, die Sie für die bestandenen Audits testen und an denen Sie arbeiten müssen.
Verbringen Sie nicht zu viel Zeit damit, 100 zu erreichen. Nicht einmal die Google-Seiten erreichen diese Punktzahl.
Betrachten Sie sie als Richtlinien und versuchen Sie, sich so weit wie möglich zu verbessern.
Hinweis: web.dev emuliert einen Test mit einem mobilen Gerät, und während ich dies schreibe, sehe ich keine Option für einen Test mit einem Desktop.
Chrome
Wussten Sie, dass Lighthouse in Ihrem Chrome-Browser verfügbar ist? Und die gute Nachricht ist, dass Sie wählen können, ob Sie mit einem Mobilgerät oder einem Desktop-Gerät testen möchten, und dass es in den Entwicklertools verfügbar ist.
- Öffnen Sie den Chrome-Browser
- Rufen Sie Ihre zu testende Website auf
- Öffnen Sie die Entwicklertools (drücken Sie F12, wenn Sie Windows verwenden) oder klicken Sie mit der rechten Maustaste auf die Seite und dann auf Prüfen.
- Wechseln Sie auf die Registerkarte Überprüfungen.
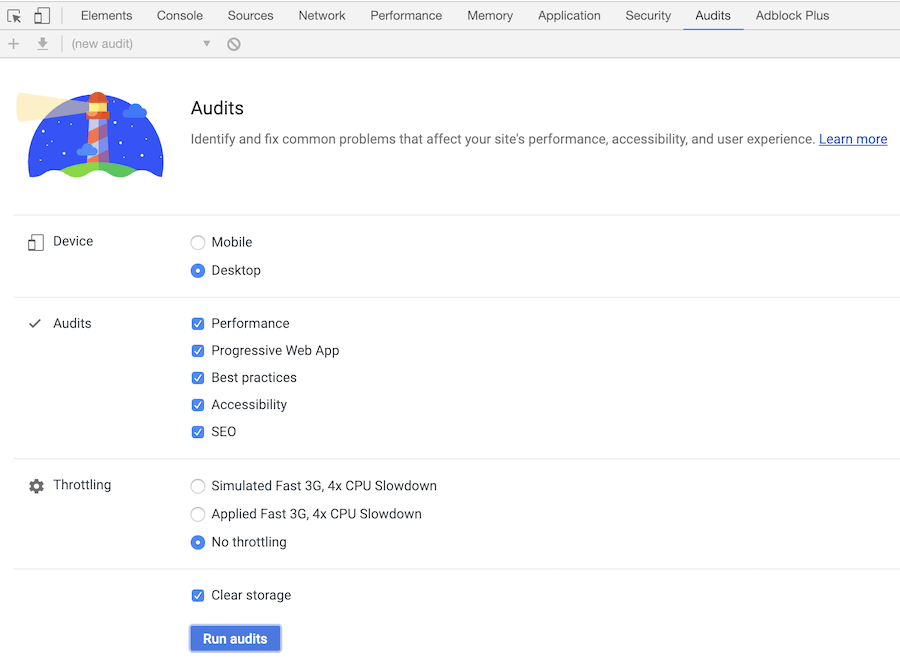
Wie Sie oben sehen können, haben Sie die Möglichkeit, auszuwählen, was Sie testen möchten. So können Sie sich auf Ihr Ziel konzentrieren und erhalten die Prüfergebnisse schneller.
Die Ergebnisse von Chome und web.dev sehen fast gleich aus.
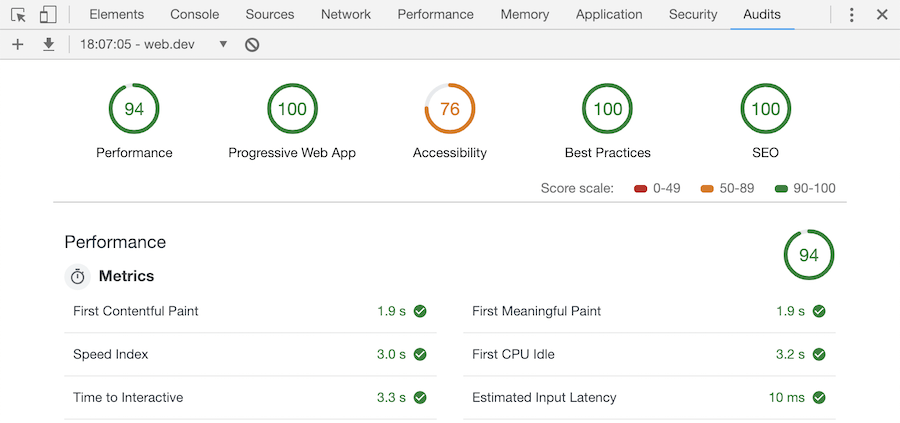
Aber wenn Sie genau hinsehen, gibt es hier eine zusätzliche Metrikgruppe – Progressive Web App. Ein weiterer Grund also, Chrome für das Audit zu verwenden.
Geekflare Lighthouse API
Sie können die Web-Performance-Daten auch mit der Geekflare Lighthouse API abrufen. Diese extrahiert die Lighthouse-Metriken für Mobilgeräte oder Desktops mit nur einem Klick im HTML-, JSON- oder CSV-Format.
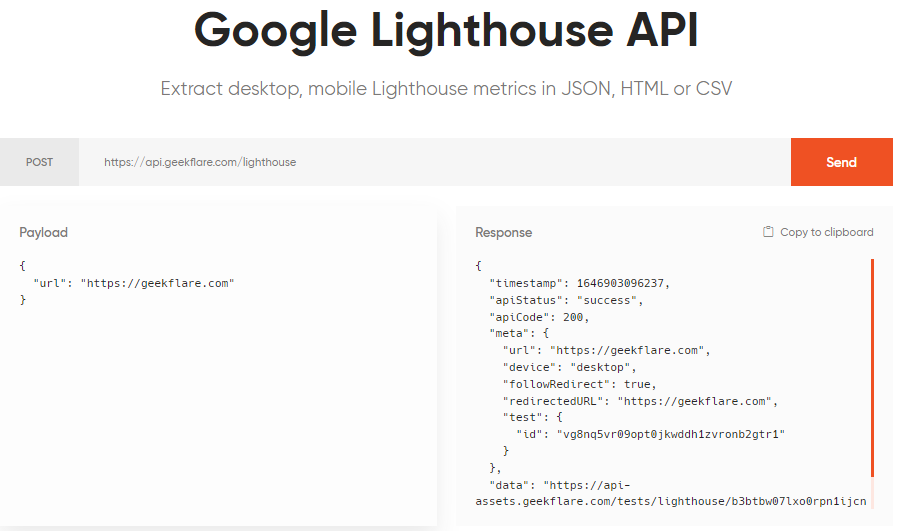
Sie können den Bericht auch individuell anpassen, indem Sie das Ausgabeformat ändern und/oder sich auf eine bestimmte Metrik wie SEO konzentrieren.
{
  "Parameter": [
      "--output=html",
      "--only-categories=seo",
  ],
  "url": "beispiel.de"
}
Und zum Glück gibt es eine kostenlose Stufe, die 3000 API-Aufrufe pro Monat umfasst. Die kostenpflichtigen Versionen bieten jedoch zusätzlich Unterstützung für mehrere Standorte, einen Residential Proxy und höhere Abfrageraten, und das bereits ab 5 $ pro Monat.
Node.js
Lighthouse ist als Node-Modul verfügbar. Sie können es auf Ihrem Server installieren und programmatisch oder über die Kommandozeile verwenden. Sehen wir uns kurz an, wie Sie Lighthouse installieren, um einige Tests durchzuführen.
Installation von Lighthouse auf Ubuntu 18.x
Das Folgende habe ich auf dem DigitalOcean-Server getestet. Lighthouse erfordert Node LTS 8.9 oder höher, und ich nehme an, dass Sie es bereits installiert haben. Falls nicht, lesen Sie diese Node.js Installationsanleitung.
Sie benötigen außerdem einen Chromium-Browser, der auf dem Server installiert sein muss. Ich habe die Installationsanleitung hier beschrieben.
Die Installation von Lighthouse ist einfach, wie die anderer Module auch.
- Melden Sie sich bei Ihrem Server an
- Führen Sie den folgenden Befehl zur Installation aus
npm install -g lighthouseIch verwende hier -g, damit es als globales Modul installiert wird.
root@geekflarelab:~# npm install -g lighthouse
/usr/bin/lighthouse -> /usr/lib/node_modules/lighthouse/lighthouse-cli/index.js
/usr/bin/chrome-debug -> /usr/lib/node_modules/lighthouse/lighthouse-core/scripts/manual-chrome-launcher.js

> [email protected] postinstall /usr/lib/node_modules/lighthouse/node_modules/axe-core
> node build/utils/postinstall.js

  [email protected]
179 Pakete von 119 Mitwirkenden in 10.094s hinzugefügt
root@geekflarelab:~#
Führen Sie nach der Installation den Befehl lighthouse aus, um sicherzustellen, dass das Paket korrekt installiert wurde.
root@geekflarelab:~# lighthouse
Bitte geben Sie eine Url an

Geben Sie --help für die verfügbaren Optionen an
root@geekflarelab:~#
Gut, der Leuchtturm ist bereit, die Prüfung durchzuführen. Lassen Sie uns einige Testoptionen ausprobieren.
So führen Sie einen Test mit einem Headless-Browser aus
lighthouse URL --chrome-flags="--headless"Sie müssen eine absolute URL angeben, einschließlich HTTP oder HTTPS.
Beispiel:
chandan@geekflarelab:~$ lighthouse https://geekflare.com/de --chrome-flags="--headless"
  ChromeLauncher Wartet auf den Browser.  0ms
  ChromeLauncher Wartet auf den Browser...  1ms
  ChromeLauncher Wartet auf den Browser.....  511ms
  ChromeLauncher Wartet auf den Browser.....✓ 2ms
  status Verbinden mit Browser 176ms
  status Zurücksetzen des Status mit about:blank 24ms
  status Benchmarking Maschine 30ms
  status Initialisierung... 508ms
  status Seite laden & warten auf onload Scripts, CSSUsage, Viewport, ViewportDimensions, ThemeColor, Manifest, RuntimeExceptions, ChromeConsoleMessages, ImageUsage, Accessibility, LinkElements, AnchorsWithNoRelNoopener, AppCacheManifest, Doctype, DOMStats, JSLibraries, OptimizedImages, PasswordInputsWithPreventedPaste, ResponseCompression, TagsBlockingFirstPaint, MetaDescription, FontSize, CrawlableLinks, MetaRobots, Hreflang, EmbeddedContent, Canonical, RobotsTxt 27ms
  status Abrufen von in-page: Skripte 2s
  status Abrufen von in-page: CSSUsage 0ms
  status Abrufen von in-page: Ansichtsfenster 0ms
  status Abrufen von in-page: ViewportDimensions 0ms
  status Abrufen von in-page: ThemeColor 0ms
  status Abruf von in-page: Manifest 0ms
  status Abrufen von in-page: RuntimeExceptions 0ms
  status Abrufen von in-page: ChromeConsoleMessages 0ms
  status Abrufen von in-page: ImageUsage 0ms
  status Abrufen der Seite: Barrierefreiheit 0ms
  status Abrufen von in-page: LinkElemente 0ms
  status Abrufen von in-page: AnchorsWithNoRelNoopener 1ms
  status Abrufen von in-page: AppCacheManifest 0ms
  status Abrufen von in-page: Doctype 0ms
  status Abrufen der Seite: DOMStats 0ms
  status Abrufen von Seiteninfos: JSLibraries 0ms
  status Abrufen von in-page: OptimizedImages 0ms
  status Abrufen von in-page: PasswordInputsWithPreventedPaste 0ms
  status Abrufen der Seite: Antwortkomprimierung 0ms
  status Abrufen von in-page: TagsBlockingFirstPaint 0ms
  status Abrufen von in-page: MetaDescription 0ms
  status Abruf von in-page: FontSize 0ms
  status Abrufen von in-page: CrawlableLinks 0ms
  status Abrufen von in-page: MetaRobots 0ms
  status Abrufen von in-page: Hreflang 0ms
  status Abrufen von Seiteninhalten: EingebetteterInhalt 0ms
  status Abrufen von Seiteninhalten: Kanonisch 0ms
  status Abrufen von in-page: RobotsTxt 0ms
  status Abrufen von Trace 1ms
  status Abrufen von devtoolsLog & Netzwerkaufzeichnungen 110ms
  status Abrufen von: Skripte 27ms
  status Abruf von: CSSUsage 53ms
  status Abrufen: Ansichtsfenster 192ms
  status Abrufen: ViewportDimensions 5ms
  status Abrufen: ThemeColor 13ms
  status Abrufen: Manifest 2ms
  status Abrufen: RuntimeExceptions 295ms
  status Abrufen: ChromeConsoleMessages 1ms
  status Abrufen: ImageUsage 2ms
  status Abrufen: Barrierefreiheit 22ms
  status Abrufen: LinkElemente 526ms
  status Abrufen: AnchorsWithNoRelNoopener 10ms
  status Abrufen: AppCacheManifest 6ms
  status Abrufen: Doctype 20ms
  status Abrufen: DOMStats 4ms
  status Abrufen: JSLibraries 50ms
  status Abrufen: OptimizedImages 25ms
  status Abrufen: PasswordInputsWithPreventedPaste 234ms
  status Abrufen: Antwortkomprimierung 3ms
  status Abrufen: TagsBlockingFirstPaint 7ms
  status Abrufen: MetaBeschreibung 6ms
  status Abrufen: FontSize 7ms
  status Abrufen: CrawlableLinks 245ms
  status Abrufe: MetaRobots 6ms
  status Abrufen: Hreflang 2ms
  status Abrufen: EingebetteterInhalt 2ms
  status Abrufen: Kanonisch 3ms
  status Abrufen: RobotsTxt 6ms
  status Zurücksetzen des Status mit about:blank 19ms
  status Seite laden & warten auf onload ServiceWorker, Offline, StartUrl 24ms
  status Abruf von in-page: ServiceWorker 59ms
  status Abrufen von in-page: Offline 0ms
  status Abrufen der Seite: StartUrl 1ms
  status Abrufen von devtoolsLog & Netzwerkaufzeichnungen 0ms
  status Abrufen: ServiceWorker 2ms
  status Abrufen: Offline 1ms
  status Abrufen: StartUrl 1ms
  status Zurücksetzen des Status mit about:blank 5ms
  status Seite laden & warten auf onload HTTPRedirect, HTMLWithoutJavaScript 48ms
  status Abruf von in-page: HTTPRedirect 260ms
  status Abruf von in-page: HTMLWithoutJavaScript 0ms
  status Abrufen von devtoolsLog & Netzwerkaufzeichnungen 0ms
  status Abrufen: HTTPRedirect 7ms
  status Abruf von: HTMLWithoutJavaScript 12ms
  status Trennen der Verbindung zum Browser...  7ms
  status Analysieren und Ausführen von Audits...  6ms
  status Auswerten: Verwendet HTTPS 3ms
  status Auswerten: Leitet den HTTP-Verkehr auf HTTPS um 24ms
  status Auswerten: Registriert einen Service Worker, der page und start_url kontrolliert 1ms
  status Auswertend: Die aktuelle Seite antwortet mit einem 200, wenn sie offline ist 0ms
  status Auswertend: Hat ein `<meta name="viewport">` Tag mit `width` oder `initial-scale` 1ms
  status Auswerten: Enthält einige Inhalte, wenn JavaScript nicht verfügbar ist 1ms
  status Evaluating: Erstes Contentful Bild 6ms
  status Evaluating: Erstes aussagekräftiges Bild 54ms
  status Auswerten: Das Laden der Seite ist in mobilen Netzwerken schnell genug 10ms
  status Auswerten: Geschwindigkeitsindex 33ms
  status Auswerten: Screenshot-Miniaturansichten 529ms
  status Auswerten: Endgültiger Screenshot 287ms
  status Auswerten: Geschätzte Eingabe-Latenzzeit 2ms
  status Auswerten: Keine Browserfehler auf der Konsole protokolliert 16ms
  status Auswerten: Server-Antwortzeiten sind niedrig (TTFB) 1ms
  status Auswerten: Erste CPU im Leerlauf 1ms
  status Auswerten: Zeit bis zur Interaktivität 30ms
  status Auswerten: Benutzer Timing markiert und misst 0ms
  status Auswerten: Minimierung der Tiefe von kritischen Anfragen 2ms
  status Auswerten: Vermeiden Sie mehrere Seitenumleitungen 3ms
  status Auswerten: Web-App-Manifest erfüllt die Anforderungen an die Installierbarkeit 2ms
  status Auswerten: Für einen benutzerdefinierten Begrüßungsbildschirm konfiguriert 1ms
  status Auswerten: Legt eine Farbe für die Adressleiste fest 0ms
  status Auswerten: Der Inhalt hat die richtige Größe für das Ansichtsfenster 1ms
  status Auswerten: Zeigt Bilder mit korrektem Seitenverhältnis an 0ms
  status Auswerten: Vermeidet veraltete APIs 1ms
  status Auswerten: Minimiert die Arbeit des Haupt-Threads 0ms
  status Auswerten: JavaScript-Ausführungszeit 11ms
  status Auswerten: Schlüsselanfragen vorladen 3ms
  status Auswerten: Vorverbindung zu erforderlichen Ursprüngen 2ms
  status Auswerten: Der gesamte Text bleibt beim Laden von Webfont sichtbar 2ms
  status Auswerten: Netzwerkanfragen 1ms
  status Auswerten: Metriken 2ms
  status Evaluating: start_url antwortet mit einem 200 wenn offline 1ms
  status Auswerten: Website funktioniert browserübergreifend 1ms
  status Auswerten: Seitenübergänge fühlen sich nicht an, als würden sie im Netzwerk blockieren 0ms
  status Auswerten: Jede Seite hat eine URL 0ms
  status Auswerten: die `[aria-*]` Attribute entsprechen ihren Rollen 1ms
  status Auswerten: `[role]`s haben alle erforderlichen `[aria-*]` Attribute 1ms
  status Auswerten: Elemente mit `[role]`, die bestimmte untergeordnete `[role]`s erfordern, sind vorhanden 0ms
  status Auswerten: `[role]`s sind in ihrem erforderlichen Elternelement enthalten 1ms
  status Auswerten: `[role]` Werte sind gültig 1ms
  status Evaluating: `[aria-*]` Attribute haben gültige Werte 0ms
  status Evaluating: `[aria-*]` Attribute sind gültig und nicht falsch geschrieben 1ms
  status Auswerten: `<audio>` Elemente enthalten ein `<track>` Element mit `[kind="captions"]` 1ms
  status Auswerten: Schaltflächen haben einen zugänglichen Namen 1ms
  status Auswerten: Die Seite enthält eine Überschrift, einen Link zum Überspringen oder einen Orientierungsbereich 1ms
  status Auswerten: Hintergrund- und Vordergrundfarben haben ein ausreichendes Kontrastverhältnis 1ms
  status Auswerten: die `<dl>`'s enthalten nur richtig geordnete `<dt>` und `<dd>` Gruppen, `<script>` oder `<template>` Elemente.  1ms
  status Auswerten: Elemente der Definitionsliste sind in `<dl>`-Elemente eingeschlossen 0ms
  status Auswerten: Das Dokument hat ein `<title>`-Element 1ms
  status Evaluating: die `[id]` Attribute auf der Seite sind eindeutig 1ms
  status Auswerten: `<frame>` oder `<iframe>` Elemente haben einen Titel 1ms
  status Auswerten: das `<html>` Element hat ein `[lang]` Attribut 0ms
  status Auswerten: das Element `<html>` hat einen gültigen Wert für sein Attribut `[lang]` 1ms
  status Auswerten: Bildelemente haben `[alt]` Attribute 1ms
  status Evaluating: `<input type="image">` Elemente haben `[alt]` Text 1ms
  status Evaluating: Formularelemente haben zugehörige Labels 0ms
  status Evaluating: Präsentations-<table>`-Elemente vermeiden die Verwendung von `<th>`, `<caption>` oder dem `[summary]`-Attribut.  1ms
  status Auswerten: Links haben einen erkennbaren Namen 1ms
  status Auswerten: Listen enthalten nur `<li>` Elemente und Skript unterstützende Elemente (`<script>` und `<template>`).  1ms
  status Auswerten: Listenelemente (`<li>`) sind in `<ul>` oder `<ol>` übergeordneten Elementen enthalten 1ms
  status Auswerten: Das Dokument verwendet kein `<meta http-equiv="refresh">` 0ms
  status Auswerten: `[user-scalable="no"]` wird nicht im `<meta name="viewport">` Element verwendet und das `[maximum-scale]` Attribut ist nicht kleiner als 5. 1ms
  status Auswerten: `<Objekt>` Elemente haben `[alt]` Text 1ms
  status Auswerten: Kein Element hat einen `[tabindex]` Wert größer als 0 1ms
  status Auswerten: Zellen in einem `<table>`-Element, die das `[headers]`-Attribut verwenden, beziehen sich nur auf andere Zellen der gleichen Tabelle.  1ms
  status Auswerten: `<th>` Elemente und Elemente mit `[role="columnheader"/"rowheader"]` haben Datenzellen, die sie beschreiben.  0ms
  status Auswerten: `[lang]` Attribute haben einen gültigen Wert 1ms
  status Auswerten: `<video>` Elemente enthalten ein `<track>` Element mit `[kind="captions"]` 1ms
  status Auswerten: `<Video>`-Elemente enthalten ein `<Track>`-Element mit `[kind="description"]` 1ms
  status Evaluating: `[accesskey]` Werte sind eindeutig 1ms
  status Auswerten: Benutzerdefinierte Steuerelemente haben zugehörige Bezeichnungen 0ms
  status Evaluating: Benutzerdefinierte Steuerelemente haben ARIA-Rollen 1ms
  status Auswerten: Der Benutzerfokus ist nicht versehentlich in einer Region gefangen 0ms
  status Auswerten: Interaktive Steuerelemente sind über die Tastatur fokussierbar 0ms
  status Auswerten: Überschriften überspringen keine Ebenen 0ms
  status Auswerten: Interaktive Elemente zeigen ihren Zweck und Zustand an 1ms
  status Auswerten: Die Seite hat eine logische Tabulatorreihenfolge 0ms
  status Auswerten: Der Fokus des Benutzers wird auf neue Inhalte auf der Seite gelenkt 1ms
  status Auswerten: Inhalte außerhalb des Bildschirms sind vor Hilfsmitteln verborgen 0ms
  status Auswerten: HTML5 Landmark-Elemente werden verwendet, um die Navigation zu verbessern 0ms
  status Auswerten: Die visuelle Anordnung auf der Seite folgt der DOM-Reihenfolge 0ms
  status Auswerten: Effiziente Cache-Richtlinie für statische Assets 1ms
  status Auswerten: Vermeidet enorme Netzwerk-Payloads 3ms
  status Evaluating: Verschieben von Offscreen-Bildern 1ms
  status Evaluieren: Beseitigen Sie Rendering-blockierende Ressourcen 12ms
  status Evaluieren: CSS verkleinern 28ms
  status Auswerten: JavaScript verkleinern 64ms
  status Auswerten: Ungenutztes CSS zurückstellen 69ms
  status Auswerten: Bilder in Next-Gen-Formaten bereitstellen 12ms
  status Auswerten: Bilder effizienter kodieren 11ms
  status Auswerten: Textkomprimierung aktivieren 6ms
  status Auswerten: Bilder in der richtigen Größe anzeigen 6ms
  status Auswerten: Videoformate für animierte Inhalte verwenden 7ms
  status Auswerten: Vermeidet Anwendungs-Cache 11ms
  status Auswerten: Seite hat den HTML-Doctype 0ms
  status Auswerten: Vermeidet eine übermäßige DOM-Größe 1ms
  status Auswerten: Links zu herkunftsübergreifenden Zielen sind sicher 2ms
  status Auswertend: Vermeidet die Abfrage der Geolocation-Erlaubnis beim Laden der Seite 1ms
  status Auswertend: Vermeidet `document.write()` 0ms
  status Auswertend: Vermeidet Front-End JavaScript-Bibliotheken mit bekannten Sicherheitslücken 0ms
  status Auswerten: Erkannte JavaScript-Bibliotheken 9ms
  status Auswerten: Vermeidet die Abfrage der Benachrichtigungserlaubnis beim Laden der Seite 1ms
  status Auswerten: Erlaubt Benutzern das Einfügen in Passwortfelder 0ms
  status Auswerten: Verwendet HTTP/2 für seine eigenen Ressourcen 0ms
  status Evaluating: Verwendet passive Listener, um die Leistung beim Scrollen zu verbessern 1ms
  status Evaluating: Das Dokument hat eine Meta-Beschreibung 0ms
  status Auswertend: Seite hat einen erfolgreichen HTTP-Statuscode 1ms
  status Auswerten: Das Dokument verwendet lesbare Schriftgrößen 5ms
  status Auswerten: Links haben beschreibenden Text 1ms
  status Auswerten: Die Seite ist nicht für die Indizierung gesperrt 1ms
  status Auswerten: robots.txt ist gültig 2ms
  status Auswerten: Das Dokument hat einen gültigen `hreflang` 1ms
  status Auswerten: Das Dokument vermeidet Plugins 1ms
  status Auswerten: Das Dokument hat ein gültiges `rel=canonical` 0ms
  status Auswerten: Seite ist mobilfreundlich 1ms
  status Auswerten: Strukturierte Daten sind gültig 0ms
  status Generierung der Ergebnisse...  0ms
  ChromeLauncher Töten der Chrome-Instanz 7098 59ms
  Drucker-HTML-Ausgabe nach /home/chandan/geekflare.com/de_2019-01-20_19-29-35.report.html geschrieben 46ms
  CLI-Protip: Führen Sie lighthouse mit `--view` aus, um den HTML-Bericht sofort in Ihrem Browser zu öffnen 1ms
In der vorletzten Zeile können Sie sehen, dass der Pfad zum Bericht ausgegeben wird. Standardmäßig wird ein Bericht im HTML-Format erstellt, den Sie entweder auf Ihren PC herunterladen oder über einen Webserver abrufen können.
Was aber, wenn Sie einen Bericht im JSON-Format erstellen müssen?
Das ist wie folgt machbar.
lighthouse URL --chrome-flags="--headless" --output json --output-path URL.jsonWenn Sie Lighthouse CLI verwenden, haben Sie die volle Kontrolle, um es so zu verwenden, wie Sie es wünschen. Ich empfehle Ihnen dringend, das GitHub-Repository zu besuchen, um mehr über die Verwendung von CLI oder programmatisch zu erfahren.
Fazit
Google Lighthouse scheint ein vielversprechendes Tool zu sein, um einen Kontinuitätstest zur Verbesserung der Website-Performance und der Benutzerfreundlichkeit durchzuführen. Wenn Sie WordPress verwenden und Ihre Website schneller laden möchten, sollten Sie sich Rocket ansehen.