Your network keeps your systems, apps, and users connected. To keep it secure and running well, you need to see what’s happening inside it. That’s where network packet analyzers come in; they capture and examine the data flowing through your network, helping you troubleshoot issues, monitor performance, and detect potential threats.
There are many network packet analyzers to choose from, open-source tools to enterprise solutions, and choosing the right one can be challenging.
In this article, we cover the top network packet analyzers trusted by IT and security teams to troubleshoot issues, safeguard data, and ensure smooth network performance.
- 1. Wireshark
- 2. NetFlow Analyzer
- 3. tcpdump
- 4. Tproxy
- 5. NetworkMiner
- 6. Fiddler
- 7. WinDump
- 8. BruteShark
- 9. OmniPeek
- 10. Capsa
- 11. EtherApe
- 12. CommView
- Show less
You can trust Geekflare
At Geekflare, trust and transparency are paramount. Our team of experts, with over 185 years of combined experience in business and technology, tests and reviews software, ensuring our ratings and awards are unbiased and reliable. Learn how we test.
1. Wireshark
Wireshark is an old project (it started way back in 1998) that is pretty much the industry standard when it comes to diving deep into networks. It’s impressive when you consider that it’s purely a volunteer-run organization, backed by some generous sponsors. Wireshark remains open-source (not on GitHub, but the code can be found here).
Wireshark is compatible with a wide range of capture file formats, including tcpdump (libpcap), Pcap NG, Catapult DCT2000, Cisco Secure IDS iplog, Microsoft Network Monitor, Network General Sniffer® (compressed and uncompressed), Sniffer® Pro, NetXray®, and many others.
It supports live data capture from a wide range of network interfaces such as Ethernet, IEEE 802.11 (Wi-Fi), PPP/HDLC, ATM, Bluetooth, USB, and Token Ring.

Key Capabilities of Wireshark
- Integrates with tools like tshark and command-line utilities for automation.
- Supports decryption of protocols like SSL/TLS when keys are available.
- Decodes VoIP calls and shows protocol-specific details.
- Analyze protocols in real-time with detailed, color-coded breakdowns.
- Supports a wide range of decryption protocols, including WPA/WPA2, SNMPv3, and more, for secure traffic analysis.
- Compatible with all major platforms, including Linux, Windows, macOS, Solaris, and FreeBSD.
Looking for Wireshark in your terminal? Sure, try Termshark
2. NetFlow Analyzer
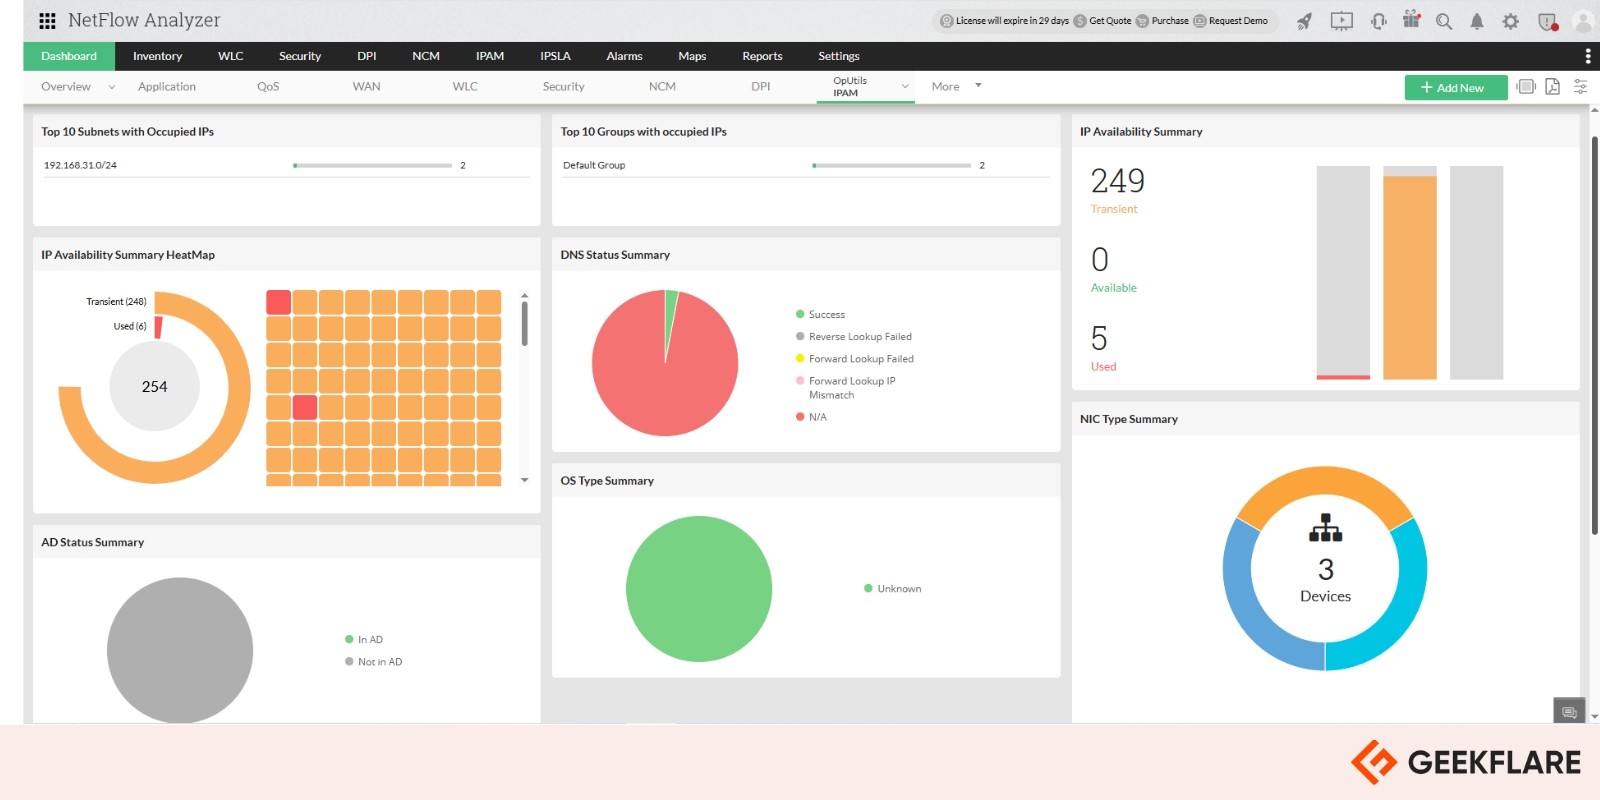
ManageEngine NetFlow Analyzer is a powerful network traffic analysis and bandwidth monitoring tool that gives you real-time insights into how your network is performing. It works with multiple flow technologies like NetFlow, sFlow, IPFIX, and others, so it’s compatible with a broad range of devices from top vendors like Cisco, Juniper, and HP.
It offers in-depth traffic analysis with features like deep packet inspection and application monitoring through Cisco NBAR. The tool provides customizable dashboards and detailed reports that make it easier to troubleshoot issues and plan for future network capacity needs.
NetFlow Analyzer helps you understand traffic patterns, monitor user activity, and assess application performance across various parts of your network. It supports advanced Cisco features such as CBQoS, AVC, and IP SLA, making it a smart choice for organizations that need robust network visibility and performance monitoring.
Key Capabilities of NetFlow Analyzer
- Get real-time reports with one-minute updates, giving you quick, actionable insights.
- Detect internal and external threats with Continuous Stream Mining Engine.
- Gain full layer 7 visibility with Cisco NBAR, even for apps using dynamic or hidden ports.
- Monitor voice, video, and data service performance with Cisco IP SLA.
- Ensure consistent quality for VoIP and other critical applications.
- Detect anomalies and zero-day attacks with context-aware analysis.
- Track key service-level metrics in real time.
- Supports all major flow formats, NetFlow, sFlow, jFlow, IPFIX, NetStream, AppFlow, and Flexible NetFlow (FNF).
NetFlow Analyzer Standard Edition starts at $172 for 10 interfaces. A 30-day free trial is available, giving users full access to all features before committing to a purchase.
3. tcpdump
If you’re old school (read hardcore command-line junkie), tcpdump is for you.
It’s another of those iconic Linux utilities (like curl) that remains as relevant as ever, so much so that almost all other “fancier” tools build on it. Like I said before, there isn’t a graphical environment, but the tool more than makes up for it.
But installing it can be a pain; while tcpdump comes bundled with most modern Linux distributions, if yours doesn’t, then you’ll end up having to build from the source.

tcpdump commands are short and simple, aimed at solving a particular problem, such as:
- Displaying all available interfaces
- Capturing only one of the interfaces
- Saving captured packets to a file
- Capturing only failed packets
If your needs are simple and you need to run a quick scan, tcpdump can be a great option to consider (especially if you type tcpdump and find that it’s installed already!). Check out this post for some real-time tcpdump command examples.
4. Tproxy
Tproxy is a simple, open-source, command-line tool to proxy TCP connections over the network. Tproxy is written in the Go programming language and is a Go command-line tool, and packaged as a Go binary, so it is available on all modern Linux and macOS platforms.
Image below shows the command line to monitor MySQL connections:

Its primary use case is to proxy HTTP connections and inspect the contents of the HTTP request and the responses. It can also be used to proxy other protocols, like SOCKS or TCP. It can be used to proxy TCP connections between two hosts or to analyze the traffic on a live connection. It is useful for debugging and testing applications that use TCP as a transport protocol, and for building TCP proxy services.
It was written with the goal of providing an easy-to-use interface to the tcpdump command line utility, allowing users to proxy TCP connections and perform other advanced network analyses without needing to understand the underlying TCP protocol.
The below command line displays gRPC connections:

It acts as a TCP proxy, allowing you to connect to remote services and applications as if you were on the local machine. It allows for building custom TCP services on remote hosts, similar to a reverse TCP proxy, which allows for a variety of security, troubleshooting, and performance improvements when dealing with applications that use TCP.
Key Capabilities of Tproxy
- Helps debug and optimize TCP connections.
- Aids in understanding proxy tools like Burp Suite and ZAP.
- Proxies TCP connections between hosts or services like databases and web APIs.
- Monitors MySQL and gRPC connections, including retransmission rate and RTT.
Most users will find that Tproxy simplifies their workflow and allows them to perform complex network analysis and analyze web applications without needing to alter the application or the network itself. The tool can be downloaded from GitHub.
5. NetworkMiner
Promoting itself as a Forensic Network Analysis Tool (FNAT), NetworkMiner is one of the best packet-level analyzers you’ll come across. It’s an open-source tool that can analyze a network passively and comes with an impressive GUI for analysis that can show individual images and other files transferred.
Key Capabilities of NetworkMiner
- Detects operating systems, hostnames, and open ports of networked devices.
- Captures live network traffic for real-time analysis.
- Extract X.509 certificates from SSL-encrypted traffic
- Analyzes captured network traffic from PCAP files for offline forensic investigations.
- Works with several types of traffic, such as FTP, TFTP, HTTP, SMB, SMB2, SMTP, POP3, etc.
- Allows searching of network traffic for specific strings or byte patterns.
- Supports decoding of various protocols, including HTTP/2 and DNS over HTTPS (DoH).
Do note that some of these features are available in the commercial version.
6. Fiddler
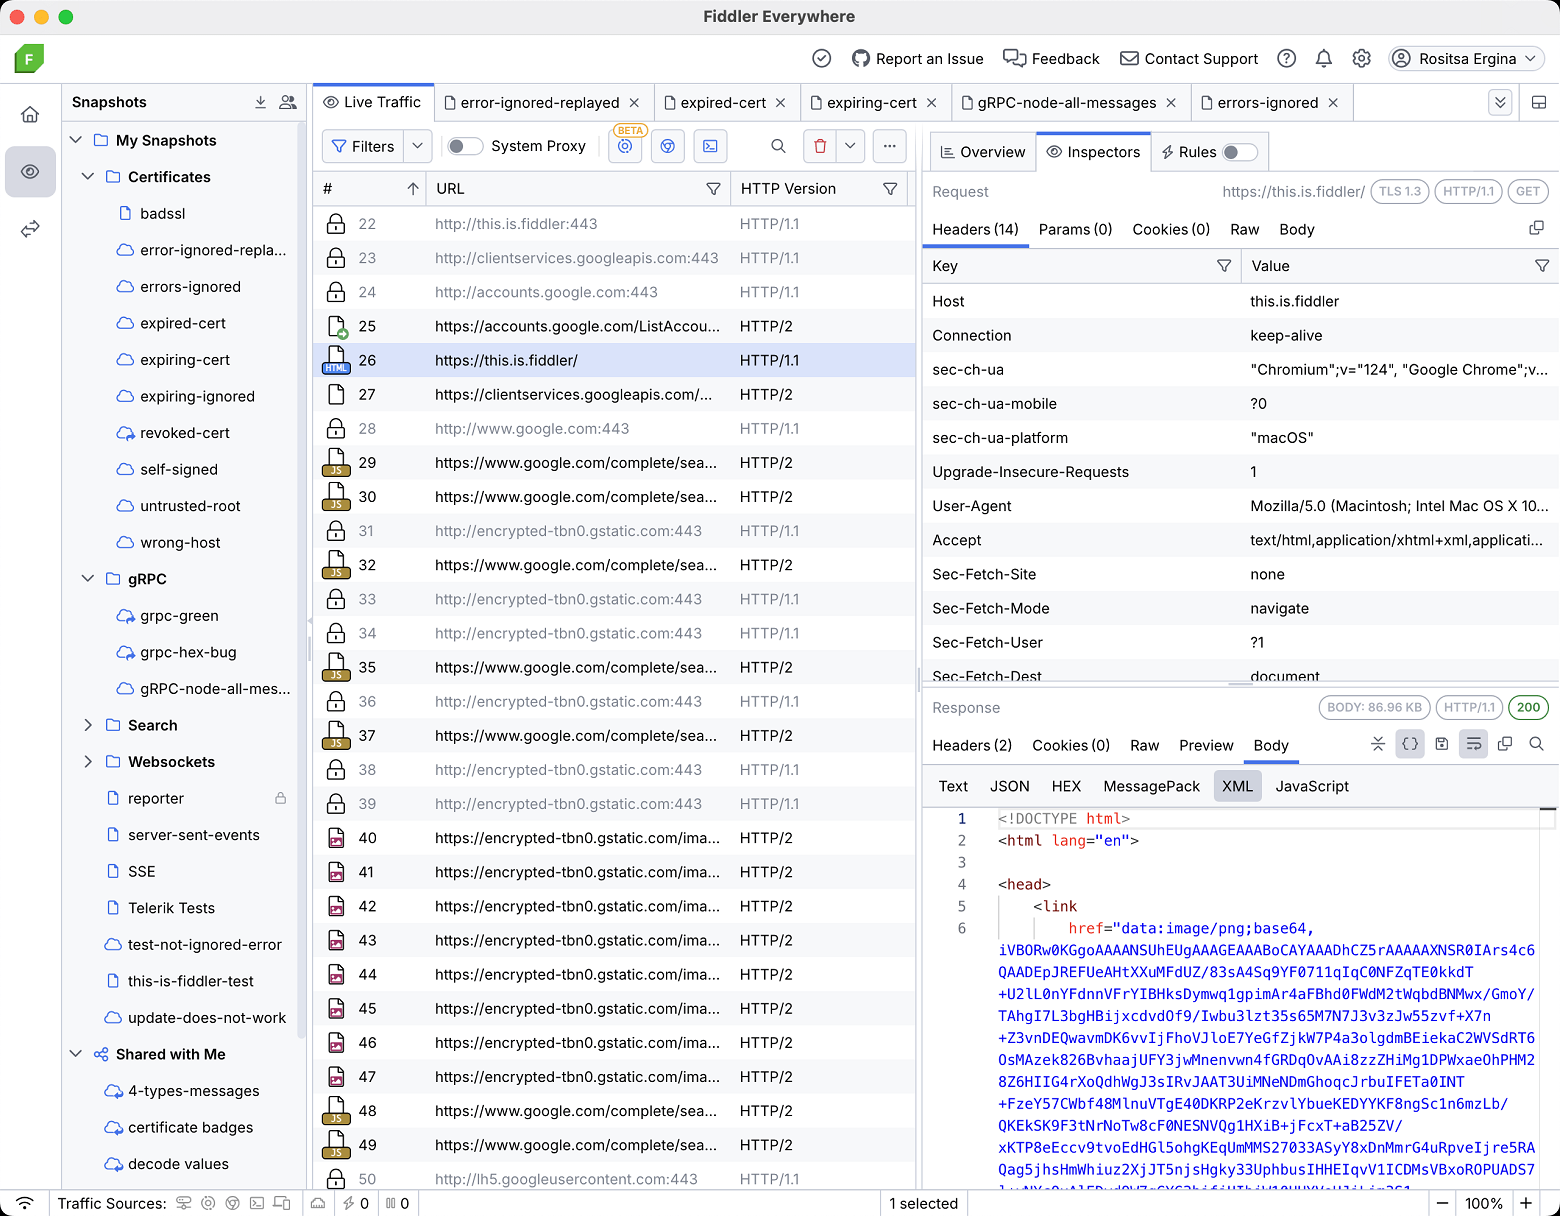
Unlike other passive network sniffers, Fiddler is something that sits between your device and the outside world and hence requires some setup (is that why they named it “Fiddler”? 😉 ).
It’s a customizable (using FiddlerScript) free tool that has a long and distinguished history, so if your goal is to sniff HTTP/HTTPS traffic like a boss, Fiddler is the way to go.
Key Capabilities of Fiddler:
- Inspect and modify HTTP headers and session data with full control.
- Simulate man-in-the-middle attacks and decrypt HTTPS traffic for detailed analysis.
- Measure page load or API response times and identify performance bottlenecks.
- Works with multiple protocols including FTP, HTTP, SMB, SMTP, POP3, and IMAP.
- Analyze encapsulated protocols like GRE, VXLAN, and PPPoE.
- Generate TLS fingerprint hashes to help recognize encrypted traffic patterns.
In case you feel lost, the documentation is very good and is highly recommended.
7. WinDump
If you miss the simplicity of tcpdump and want to bring it to your Windows systems, says hello to WinDump. Once installed, it works from the command line by typing “tcpdump” the same way the utility works on Linux systems.
Note that there’s nothing to install per se; WinDump is a binary that can be run straight away, provided you have a Pcap library implementation installed (npcap is recommended since winpcap is no longer in development).
8. BruteShark
BruteShark is an effective Network Forensic Analysis Tool (NFAT) you can use to process and inspect the network traffic, such as PCAP files, and capture directly from network interfaces.
It includes reconstructing TCP sessions, building network maps, extracting hashes of strongly encrypted passwords, and converting hashes into a Hashcat format to perform a brute-force attack offline.
The main intention behind this project is to help network administrators and security researchers responsible for analyzing network traffic and identifying weaknesses.
There are two versions of BruteShark available: a Graphical User Interface (GUI) based application for Windows and a CLI tool for Linux and Windows. Some of the projects included in this solution can even be used independently to analyze network traffic on Windows and Linux machines.

BruteShark can also perform various operations like extracting DNS queries, file carving, extracting VoIP calls (SIP, RTP), building a network diagram for users and network nodes, extracting authentication hashes using Hashcat (NTLM, HTTP-Digest, CRAM-MD5, Kerberos, etc.), and retrieving and encoding passwords and usernames.
All the projects are implemented through .Net Standard and .Net Core for cross-platform and modern support. This solution offers a three-layered architecture and includes one or multiple projects, including PL, BLL, and DAL at each layer.
Through DAL (Data Access Layer), the project helps in reading raw files of PCAP using drivers like WinPcap, libpcap, and wrapper libraries like SharpPcap. Similarly, the BLL (Business Logic Layer) is responsible for network information analysis (TCP, packet, etc.), and PL utilizes a cross-cutting project and refers to both BLL and DAL layers.
9. OmniPeek
For larger networks that have tons of MBs of data flowing through them every second, the tools everyone else uses may run out of steam. If you’re facing the same, OmniPeek might be worth a look.
It’s a performance, analytics, and forensics tool for analyzing networks, especially when you need both low-level capabilities as well as comprehensive dashboards.

10. Capsa
If all you’re concerned about is the Windows platform, Capsa is also a serious contender. It comes in three versions: free, standard, and enterprise, each with different capabilities.

That said, even the free version supports over 300 protocols and has interesting features like alerts (triggered when certain conditions are met). The standard offering is a notch above, supporting 1000+ protocols and allowing you to analyze conversations and reconstruct packet streams.
11. EtherApe
If powerful visualizations and open source are what you’re after, EtherApe is a great option. While prebuilt binaries are available for only a handful of Linux distros, the source is available (on both SourceForge and GitHub), so building it on your own is an option.

Key Capabilities of EtherApe
- Real-time, multi-node monitoring with color-coded insights.
- Handles a wide range of packet formats, including ETH_II, 802.2, 803.3, IP, IPv6, ARP, X25L3, REVARP, ATALK, AARP, IPX, VINES, TRAIN, LOOP, VLAN, and many more.
- Capture data live from the network or analyze it from a saved tcpdump file.
- Built-in support for standard name resolution.
The latest version features an updated GUI based on GTK3, offering a cleaner and more user-friendly interface.
12. CommView
If your organization runs entirely on Windows and you prioritize access to dedicated support, CommView is a solid choice. It’s a robust network traffic analyzer with built-in tools for VoIP analysis, remote monitoring, and more.

What impressed me most is its ability to export data into formats used by several open and proprietary formats, such as Sniffer®, EtherPeek™, AiroPeek™, Observer®, NetMon, Wireshark/Tcpdump, and Wireshark/pcapng, and even plain hex dumps.
What is a Network Packet?
A network packet is a small piece of data sent across a network. Anytime you browse the web, stream a video, play an online game, or shop online, your device is constantly sending and receiving these packets.
Each packet carries part of the data, whether it’s a web page, image, or video, and they’re reassembled at the destination to form the complete content. If a packet is lost or arrives out of order, the system waits until it’s fixed before continuing.
A network packet analyzer is a tool that lets you inspect these packets in real time, helping you understand what’s happening on your network and troubleshoot issues more effectively.
Why Analyze Packets?
Packets are the basic units of network data, and when something goes wrong, they hold the raw truth. You don’t normally inspect them unless everything else has failed. But when facing unexplained data leaks, slow apps with no clear cause, suspected intrusions, or odd server behavior, packet analysis can uncover what logs and dashboards miss.
It’s not about every packet, it’s about the right one at the right time. When you need hard, forensic-level evidence, packet-level insight is often your last and best option
I have explained the need for a network packet analyzer with a real story.
A critical stock pricing app used globally was underperforming, and everyone blamed the application. One engineer, ignored by management and dismissed by the OS vendor, used packet analysis to dig deeper.
By examining TCP behavior, he discovered a flaw in the OS’s TCP stack—ACKs with payloads were wrongly treated as duplicate ACKs during congestion control, crippling performance. After persistence and escalation, he reached the original RFC1323 developer, received a patch, and instantly resolved the issue.
The bug had nothing to do with the app—it was entirely in the OS. Without packet-level analysis, the real problem would’ve been missed entirely. This case proves: packet sniffing isn’t optional—it’s essential.