Application monitoring tools provide exhaustive end-to-end monitoring solutions for your applications, providing visibility into metrics that will help you improve its performance.
In my decade long system administrator experience, I’ve come across and worked with various monitoring products from deployment to administration. Below, I have reviewed the popular application monitoring tools for you to pick the right one based on your needs.
List of Application Monitoring Tools
- Cloud-Based Application Monitoring Tools
- 1. Uptrends – Best for website performance and RUM
- 2. Checkly – Best for API and E2E monitoring
- 3. Paessler PRTG – Best all-in-one infrastructure and application monitoring
- 4. Sematext – Best unified monitoring with logs, metrics, and events
- 5. Dotcom-Monitor – Best for external, geographically distributed monitoring
- 6. IBM Instana – Best to automate issue resolution
- 7. Amazon CloudWatch – Best for applications hosted on AWS
- Open-Source Application Monitoring Tools
- 8. Nagios – Popular open-source application and server monitoring
- 9. SigNoz – Best for open-source observability
- 10. Apache SkyWalking – Best for distributed systems and microservices monitoring
- 11. Jaeger – Best for tracing requests in microservices
- 12. Grafana – Best for visualizing Prometheus metrics
- 13. Prometheus – Cloud-native monitoring with powerful queries
- 14. Zabbix – Scalable infrastructure monitoring
- 15. Scouter – Best for Java application monitoring
- APM Tools
- 16. New Relic – Best for in-depth APM with code-level insights
- 17. Dynatrace – AI-powered observability
- 18. Datadog – Comprehensive monitoring across your stack
- Front-End Monitoring Tools
- 19. Sentry – Best for error tracking and front-end performance
- 20. Airbrake – Easy-to-use error monitoring
- 21. LogRocket – Best for finding UX issues
- Mobile App Monitoring Tools
- 22. Firebase Crashlytics – Best for mobile crash reporting
- 23. BugSnag – Best for error monitoring in mobile apps
- 24. Instabug – Best for in-app bug reporting and feedback
- Show less
Application Monitoring Tools Reviews
Below are my reviews for each of my favorite application monitoring tools that I mentioned earlier in the summary, covering their price, features and important benefits.
1. Uptrends
Best for website performance and RUM
Uptrends is a SaaS Digital Experience Monitoring tool which provides you with detailed insights into the uptime and performance of your websites and services. It is easy to configure while supporting a wide range of synthetic monitors for different scenarios.
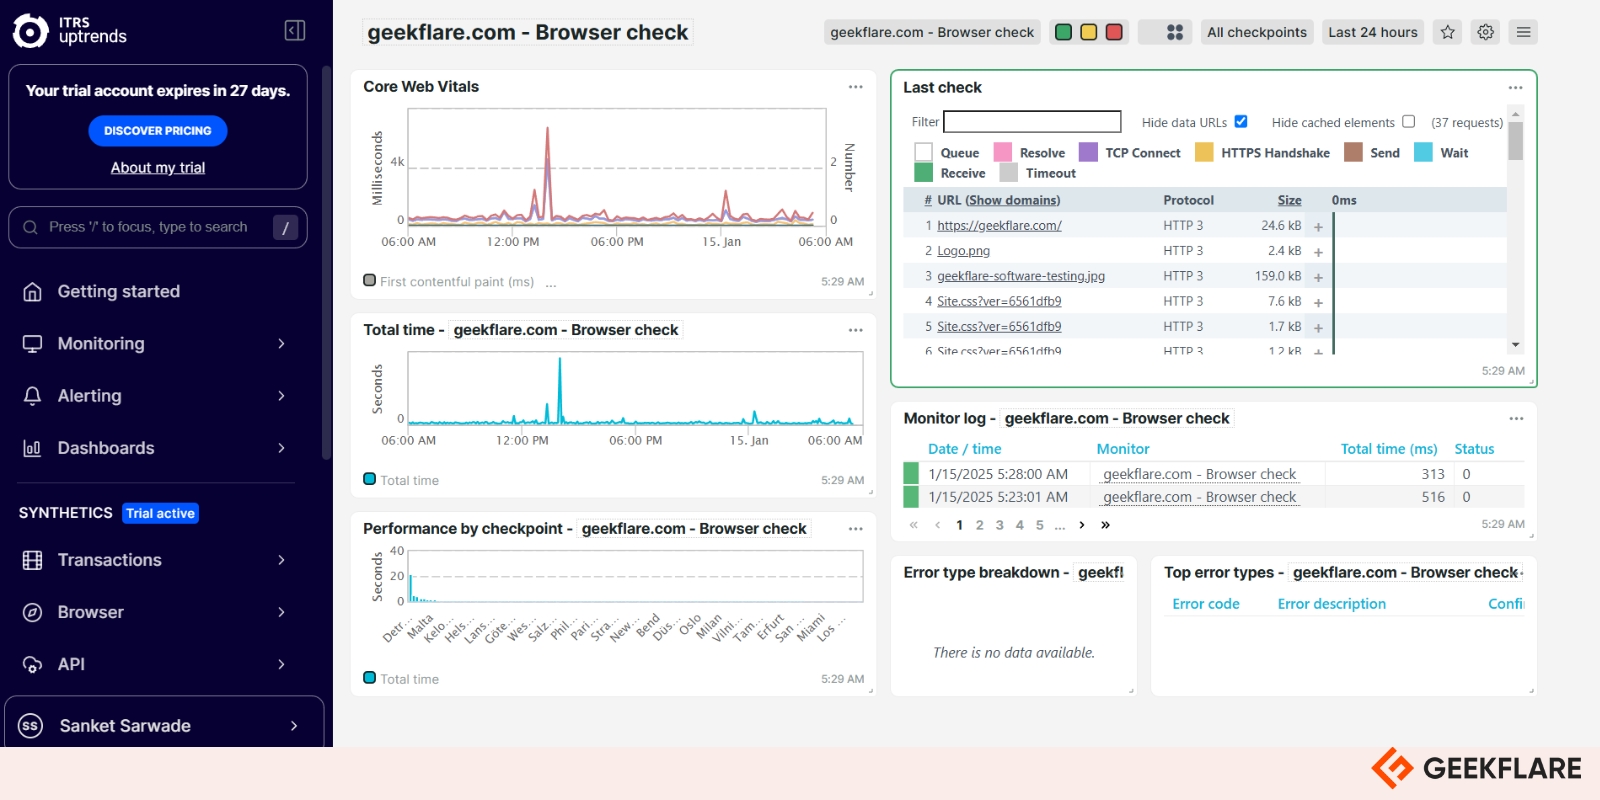
Besides, Uptrends offers Real User Monitoring (RUM) and alerting. RUM uses a simple script embedded in your page HTML to gather actual performance data from your real end users, in real time.
Why Use Uptrends
- Synthetic and API monitoring – This involves an active approach to testing a website or API by simulating visitor requests to test for availability, performance, and function. It includes availability, web performance and transaction monitoring.
- Real User Monitoring – RUM involves a passive approach to web performance monitoring by collecting and reporting performance data as experienced by its end users. This data includes load and page ready times, redirect, DNS and connection duration, frontend and backend specific delays.
- Infrastructure Monitoring – Uptrends’ ITRS Opsview provides you the capability to monitor and resolve infrastructure issues proactively and completely. It is highly scalable while providing monitoring via Opspacks for operating systems, networks, cloud, VMs, containers, databases, and applications compatible with Nagios plugins. It supports integration with PagerDuty, JIRA and Splunk.
- Alerting – Uptrends provides powerful and versatile alerting. You can determine when alerts should be generated and what messages should be sent using alert definitions while supporting multiple out-of-the-box and custom integrations to send messages via email, SMS, phone call, or an external platform.
Don’t Use Uptrends, if you are looking for free website monitoring or on a tight budget. You are better off using UptimeRobot to monitor up to 50 websites for FREE.
Uptrends Pricing
Uptrends offer multiple pricing plan and depending on what you need to monitor, you can pick one. I’ve created a table to compare the popular pricing plans.
| Plan | Starting price (mo, annual billing) |
|---|---|
| Website uptime and availability | $5.25/monitor |
| Real user monitoring (RUM) | $9.20 |
| Synthetic monitoring (single browser) | $14/monitor |
Uptrends pricing was simple and cheaper earlier, but since ITRS acquisition, it has become expensive. I would suggest Uptrends for small website or infrastructure monitoring, as pricing will shoot up if you have the large number of sites to monitor.
You can take a 30-day free trial to evaluate the platform.
2. Checkly
Best for API and E2E monitoring
Checkly allows you to perform code-first synthetic monitoring for your infrastructure. It allows you to code, test, verify and deploy your monitoring checks by creating resources programatically using code instead of configuring them.
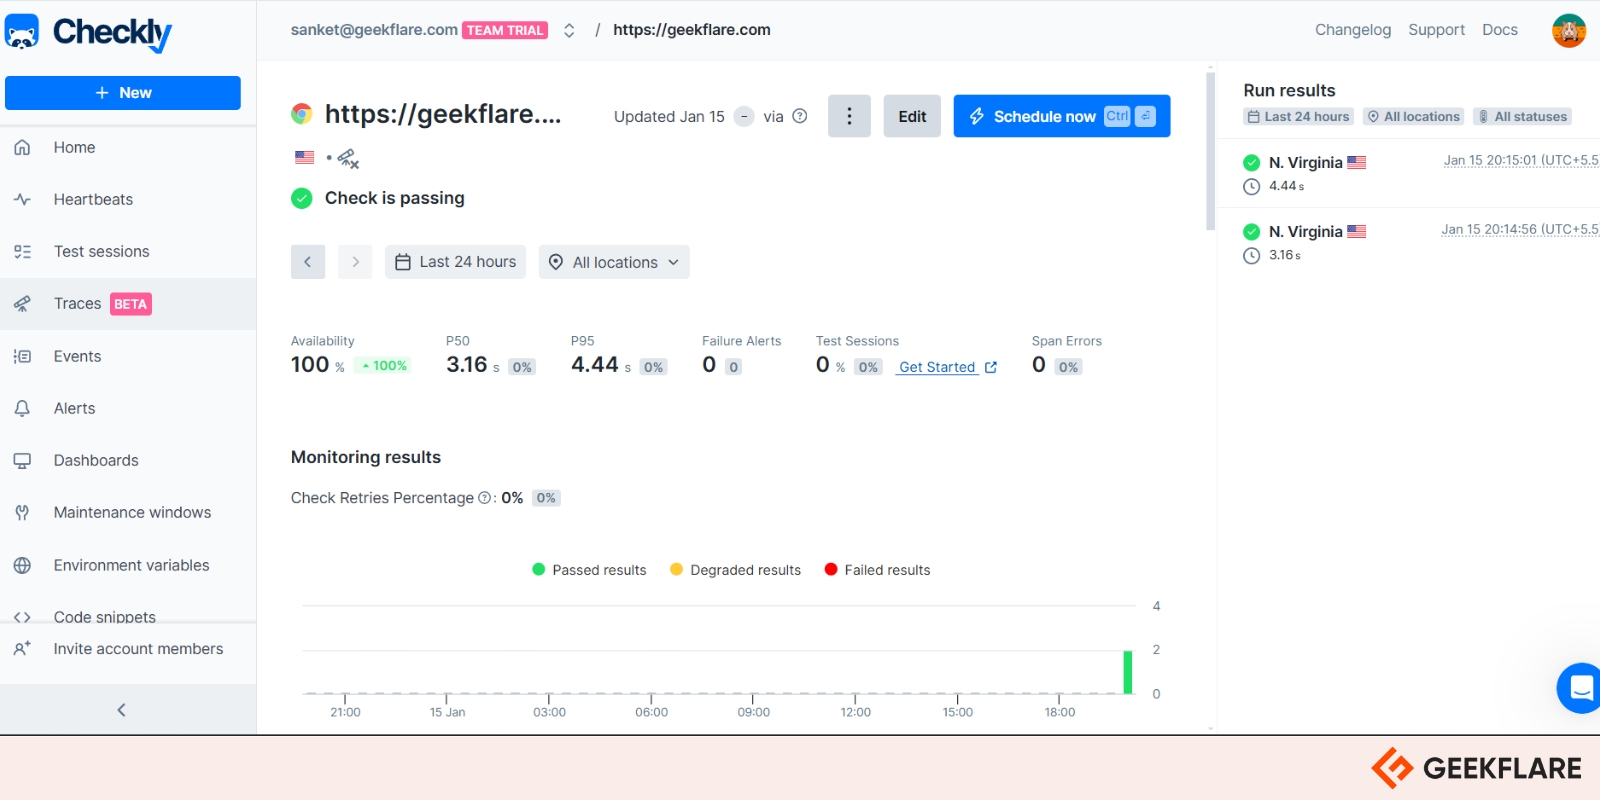
It supports synthetic, API, heartbeat and traces monitoring with extensive integration support for many key tools and frameworks in modern DevOps ecosystem.
Why Use Checkly
- Monitoring as Code – Monitoring as Code (MaC) enables you to create and configure your reliability workflow straight from your IDE. Like your code, your monitoring can be pushed to a version control like Git. Monitoring as Code with Checkly CLI enables you to code, test, and deploy your monitoring setup reliably.
- Synthetic and API Monitoring with Traces – Continuously monitors your website and APIs for downtime and performance with instant alerting. It supports real scenario checks from real browsers spread across the globe while tracking app performance over time providing historical data. Checkly also provides immediate and detailed traces when a monitor fails bridging the gap between detection and resolution of any incident.
- Heartbeat Monitoring – Checkly supports monitoring of critical scheduled jobs with heartbeat check using unique Checkly URL. These scheduled jobs can be configured to send heartbeat regularly, at defined intervals, which can trigger an alert if there is a miss or unexpected delay.
- Alerting and Integration – Using Checkly’s programmable workflow, you can code every alert precisely. You can configure custom alert conditions, route notifications and automate response workflows. There are multiple preconfigured channels that can be easily integrated with Checkly, from email to PagerDuty and SMS etc. or you can configure your own using custom web hooks.
Don’t use Checkly if your monitoring needs are simple (or you’ve limited budget for it), and you don’t plan to code just to set it up.
Checkly Pricing
Checkly offers monthly and annual subscriptions with up to 20% savings with annual plans. Based on your requirements and team size, you can choose one of the following plans.
| Plan | Starting Price (mo, annual billing) |
|---|---|
| Hobby | Free |
| Team | $64 +$2 for every 10,000 extra API checks +$5 for every 1,000 extra browser checks |
I would suggest you to try Checkly, if you love coding or want to manage your monitoring infrastructure as code. Its programmable workflow can better integrate with your DevOps workflow and especially if your requirement is to monitor APIs, which is Checkly’s strength.
You can take a 14-day free trial to evaluate Checkly with the free Hobby plan, which includes 14 days of Team plan trial without need of credit card.
3. Paessler PRTG
Best all-in-one infrastructure and application monitoring
Paessler PRTG monitoring solution is an integrated platform for monitoring your entire IT infrastructure anywhere from web, desktop and mobile environments. PRTG is a complete monitoring suite which is suitable for small to large enterprises with varying complexity of IT and network infrastructure.
Why Use Paessler PRTG
- Integrated Monitoring – Paessler PRTG supports all important technologies for monitoring including SNMP, WMI, SSH, traffic analysis, HTTP, rest APIs, ping, SQL etc. It also allows monitoring unlimited number of remote locations in a unified dashboard.
- Maps and Dashboards – Paessler PRTG provides real-time maps with live status and PRTG map designer to visualize your network infrastructure the way you need.
- Alerts and Notifications – It supports instant alerts based on custom thresholds as and when an incident occurs. There are multiple supported notification channels including email, push, HTTP requests etc.
- Multiple User Interfaces – Paessler PRTG provides web and mobile applications for iOS and Android for ease of use and anytime access of monitoring dashboards. Customizable reports can be created for any reporting requirements.
Don’t use Paessler PRTG if your monitoring focus is to review and analyze logs. You can check out Sematext or Datadog instead.
Paessler PRTG Pricing
Paessler PRTG Network Monitor offers monitor based licensing for small to large-sized environments. I’ve added the pricing details in the table below, which you can choose based on your environment size.
| Plan | Yearly Pricing |
|---|---|
| PRTG 500 (Small – About 50 devices) | $2,149 |
| PRTG 1000 (Small & Medium – About 100 devices) | $3,899 |
| PRTG 2500 (Medium – About 250 devices) | $8,099 |
| PRTG 5000 (Large – About 500 devices) | $14,199 |
| PRTG 10000 (Very Large – About 1000 devices) | $17,899 |
I would use Paessler PRTG for monitoring and mapping my IT and network infrastructure, which allows me to do its complete monitoring and get alerts from both web and mobile applications.
Paessler PRTG offers 30-day trial with unlimited use, which you can upgrade to paid license anytime.
4. Sematext
Best unified monitoring with logs, metrics, and events
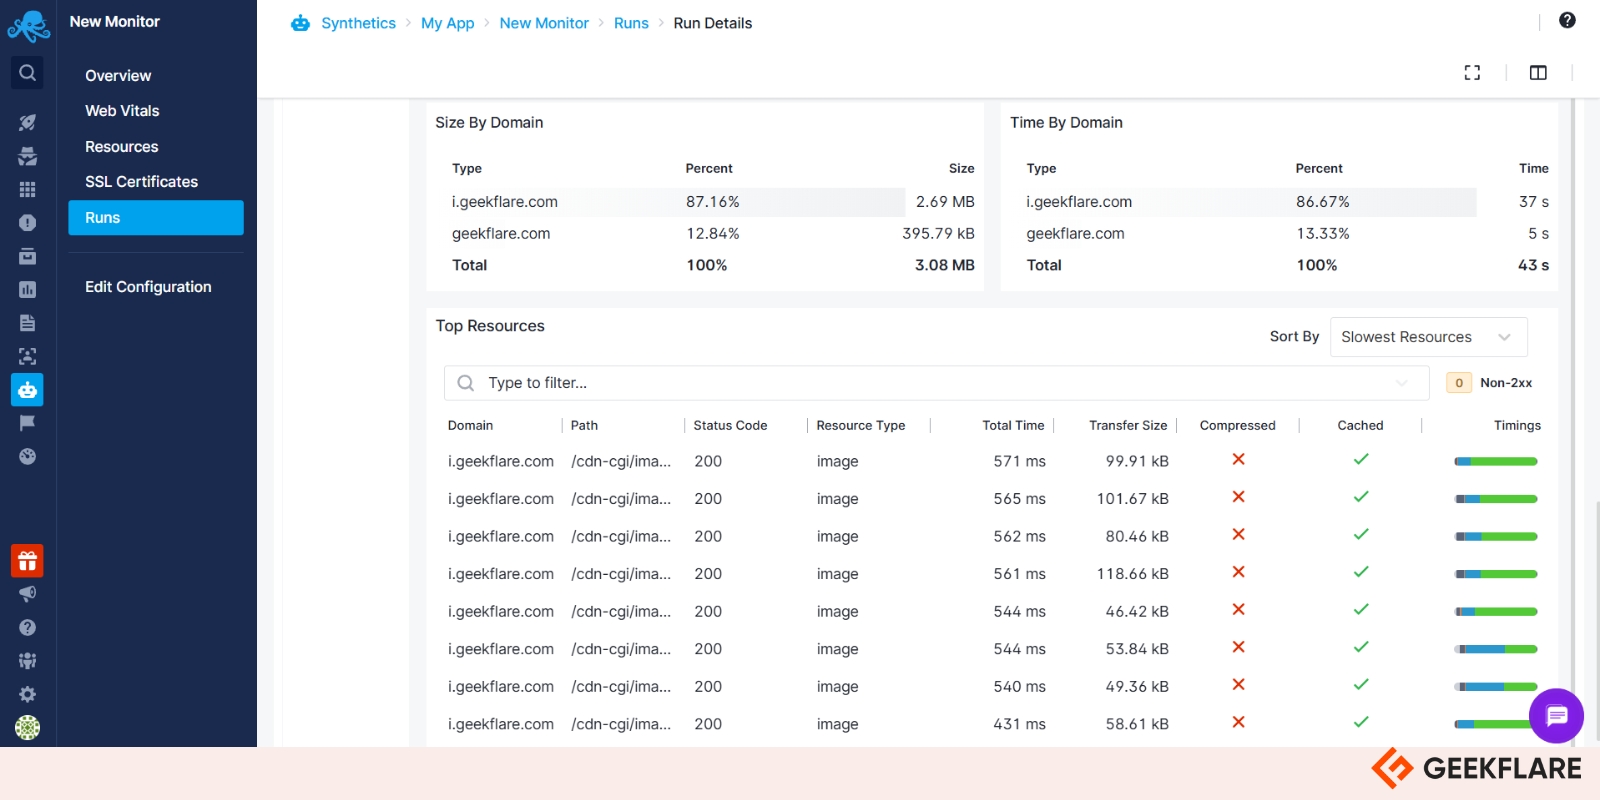
Sematext offers you an all-in-one application and infrastructure monitoring platform that is both scalable and secure. This includes logs, service, experience, synthetics, and cloud monitoring. You can create customizable dashboards and tags for better management of your monitoring infrastructure.
Why Use Sematext
- Logs Monitoring – Sematext logs is an alternative to Datadog, Splunk etc. with Elasticsearch and OpenSearch-compatible ingestion and query APIs for indexing and searching. It supports collecting logs from any part of your software stack, IoT devices and network and IT infrastructure in a single place.
- Application and Infrastructure Monitoring – Supporting over 100 integrations, Sematext can collect events from anywhere in your entire stack. With service auto discovery, it is easy to setup allowing to get started easily and quickly. Sematext agents can be installed on your core infrastructure components to gather performance and health metrics.
- Sematext Experience – By directly measuring from your web users, Sematext gives you an overview of your website’s performance and user satisfaction. This is delivered as Javascript library to your end users and loaded asynchronously. The performance metrics is then collected and analyzed on Sematext cloud.
- Alerts and Notifications – Sematext supports multiple types of alerts from metrics, logs, experience and synthetics with extensive integration support with PagerDuty, Slack, Email etc. for notifications. Besides classic threshold alerts, heartbeat, and anomaly alerts are also supported.
Don’t use Sematext if pricing is a concern for you, but your main requirement is to monitor logs. You can try the free edition of Graylog Open instead for collecting and monitoring logs as an open-source solution.
Sematext Pricing
Sematext offers 10% off on annual plans and pricing is based on monitor type and their measuring quantity. I’ve mentioned their pricing bifurcation for different plans and tiers below.
| Plan | Basic | Standard | Pro |
|---|---|---|---|
| Infrastructure (per month per host) | $2.8 1 day retention | $3.6 7 days retention | $5.76 7 days retention |
| Service (per month per agent) | $8.64 1 day retention | $10.08 7 days retention | $15.12 7 days retention |
| Logs (per month) | $5 | $50 | $60 |
| Synthetics | (Pay-As-You-Go) $2/HTTP monitor $7/Browser monitor Min. $5/month | $29/month for 40 HTTP & 5 Browser monitors | $29/month for 100 HTTP & 15 Browser monitors |
| Experience (per month) | $9 25k Page Views/month | $19 100k Page Views/month | $89 100k Page Views/month |
Sematext is a practical alternative to Splunk and has exhaustive application and synthetic monitoring capabilities that you can utilize for your infrastructure.
You can start a free trial for 14-day for any plan of Sematext without a credit card and see if it works for you.
5. Dotcom-Monitor
Best for external, geographically distributed monitoring
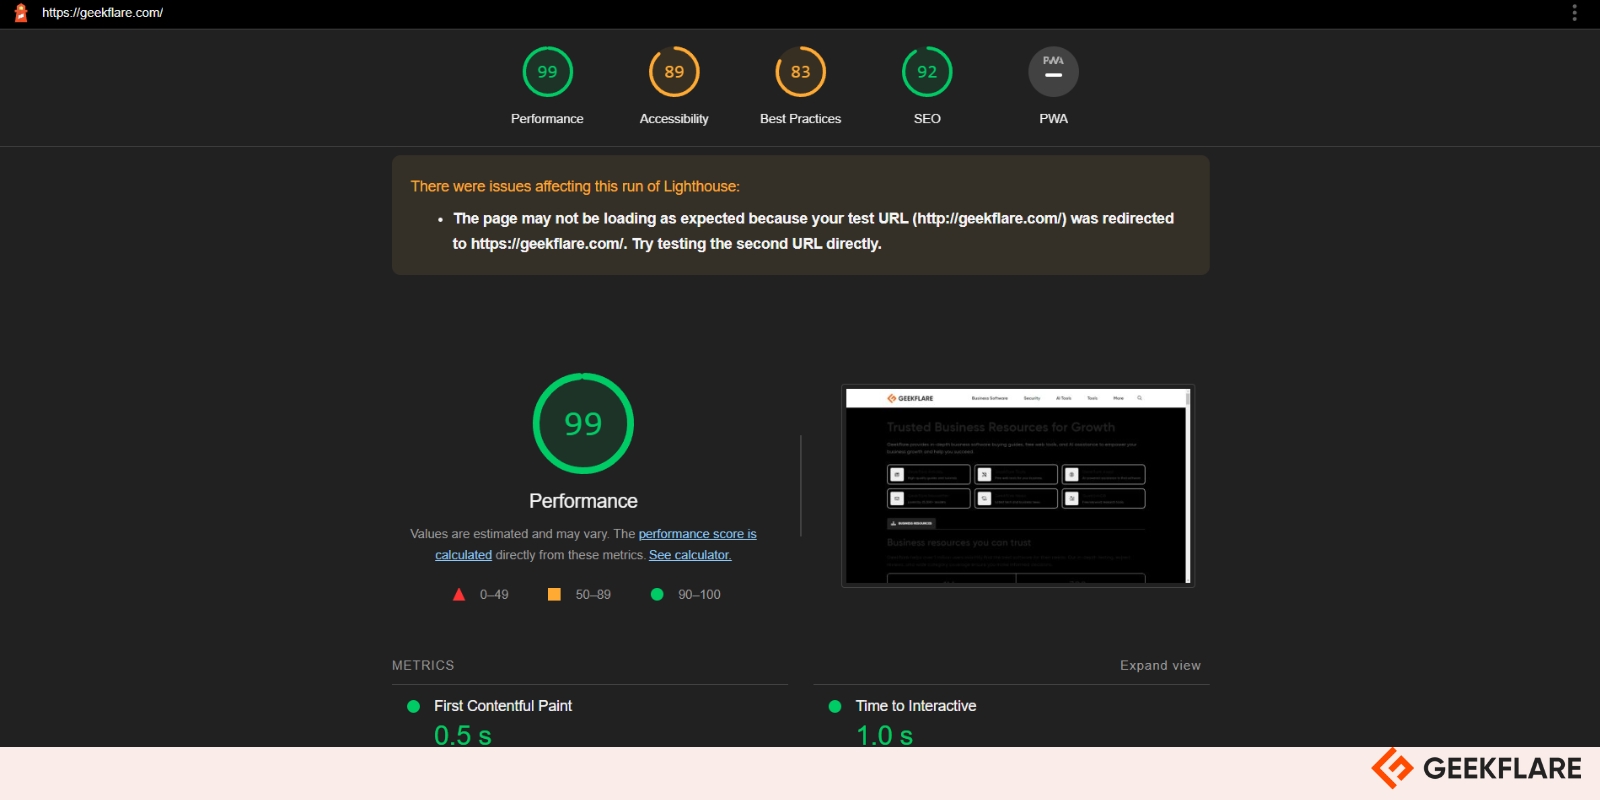
Dotcom-Monitor is a web application and Internet infrastructure monitoring platform with global geographical coverage. It allows you to get a comprehensive picture of web performance and availability trends by automatically monitoring a web resource with high frequency from global monitoring locations.
Why Use Dotcom-Monitor
- Global Coverage – Dotcom-Monitor offers global monitoring from strategically located data centers worldwide. This provides exhaustive monitoring coverage to measure your app performance from any of its monitoring station.
- Comprehensive APM – Dotcom-Monitor has comprehensive APM tools that gives you full visibility into your applications, pages, services, and infrastructure from a single dashboard. With holistic application insights and configurable reporting with real-time dashboards you can stay aligned with SLAs using detailed device performance tracking.
- Instant and Reliable Alerts – Allowing seamless integration with popular channels like email, phone, SMS, PagerDuty, Slack, ServiceNow, MS Teams etc., Dotcom-Monitor can send detailed reports with failure information reliably.
- Private Agents – Dotcom-Monitor supports network performance, application functionality and monitoring of private IT infrastructure using Private Agents that can be securely deployed to your servers.
Don’t use Dotcom-Monitor if you want to self-host your monitoring solution on a limited budget. You can give Zabbix a try for medium to large-scale infrastructure monitoring setup.
Dotcom-Monitor Pricing
Dotcom-Monitor provides pricing based on platform and quantity of targets being monitored with their frequency. I’ve added the starting price details in the table below.
| Plan | Starting Price (mo, annual billing) |
|---|---|
| Websites and APIs | $17.99 |
| Internet Infrastructure | $36.00 |
| Page Performance | $26.96 |
| Web Applications | $35.06 |
I would use Dotcom-Monitor as my monitoring tool of choice if I want to have global comprehensive monitoring coverage of my website and/or application with detailed reporting.
You can instantly start a free 30-day trial of Dotcom-Monitor without credit card to evaluate its features.
6. IBM Instana
Best to automate issue resolution
IBM Instana is a cloud-native, automated observability platform which provides high-fidelity real-time data for your DevOps full stack. Its AI-driven alert and incident analysis provides you with quick resolution for your incidents and fewer false positives overall.
Why Use IBM Instana
- Real-time Observability – IBM Instana provides you with real-time observability metrics and can monitor mobile, web, and applications. It can trace your end-to-end mobile, web, and application transactions while supporting all physical, virtual, and serverless services and functions.
- Rapid-Issue Prevention and Remediation – IBM Instana gives you Automated Smart Alerts that provide threshold-based alerts based on out-of-the-box blueprints. It shares correlated and unsampled transaction traces that instantly identify application and infrastructure issues quickly.
- Open Standards with OpenTelemetry – You can easily integrate IBM Instana with Prometheus, Jaeger, Grafana, cAdvisor, Fluent, Telepresence, and other open-source technologies. Its open-source telemetry support uses both Open Collector and high-performance Instana agent’s knowledge graph correlation.
- Automation and Intelligence – IBM Instana minimizes troubleshooting and optimizes performance by using automated AI-driven intelligent actions. It automates configuring, monitoring, tracing, and profiling for all applications and services. It also enables automatic remediation procedures in real-time through integration with IBM Watson AIOps and Turbonomic ARM.
Don’t use IBM Instana if you’re a small organization with no need for enterprise scale features and automation provided by this tool.
IBM Instana Pricing
IBM Instana offers Observability Essentials and Standard plans with extra cost for Add Ons like Instana Managed PoPs and Logs in context. Actual prices differ by country and local taxes and any other active offers at that time. For calculating your discounted IBM Instana price based on the scope of your needs, use their pricing calculator for an estimate.
I would recommend IBM Instana for their enhanced and automated real-time observability capabilities and AI-driven intelligent actions that can save lot of man-hour cost for medium to big-sized organizations.
You can start a free (without credit card) 14-day trial of IBM Instana Observability with access to all its features right now.
7. Amazon CloudWatch
Best for applications hosted on AWS
You can use Amazon CloudWatch to observe and monitor resources and applications that are deployed on any cloud, on-premise or hybrid infrastructure.
CloudWatch gives visibility into system-wide performance and allows users to set alarms, automatically react to changes, and gain a unified view of operational health. It is easy to use and provides scalable infrastructure for your monitoring needs within AWS itself.
Why Use Amazon CloudWatch
- Visualize and Analyze – You can collect and analyze different kind of metrics and logs, anywhere from your infrastructure to Amazon CloudWatch including from cloud, on-premise servers and VMs, Docker, Kubernetes, AWS Lambda etc.
- Automated Operations – You can use pre-determined thresholds to trigger automated actions to your infrastructure. Alarms can be set to alert on incidents and performance issues supporting all common notification channels like email, SMS, Slack etc.
- Infrastructure Dashboard – AWS services can be seamlessly integrated with Amazon CloudWatch for simplified monitoring and scalability. Resources outside can also be added to your dashboard to customize it according to the requirements.
- Proactive Monitoring – Amazon CloudWatch provides actionable insights from your collected logs and metrics to troubleshoot operational issues proactively and effectively.
Don’t use Amazon CloudWatch if you don’t have an Amazon AWS account and all your infrastructure resources are hosted on other platforms or outside AWS.
Amazon CloudWatch Pricing
Amazon CloudWatch is part of AWS, and its cost depends on your country and taxes as well as AWS region, along with the specific monitoring attributes you selected to use with it. An estimate of monthly billing for Amazon CloudWatch can be obtained from AWS Pricing Calculator.
If I’m using one or more AWS services, Amazon CloudWatch works perfectly with all its services with ease of integration. I can even add resources outside AWS, which could be on-premise or on another cloud.
Amazon offers Free Tier for its CloudWatch solution with most AWS Services (EC2, S3, Kinesis, etc.) able to send metrics automatically for free to CloudWatch. You can sign up for an AWS account and get started with CloudWatch for free.
8. Nagios
Popular open-source application and server monitoring
Nagios is a popular, open-source monitoring platform with extensive capabilities for monitoring your application and entire IT infrastructure. It provides you with complete monitoring of websites, web applications, web transactions, and web services, including availability, URL monitoring, HTTP status, content monitoring, hijack detection, and more.
Why Use Nagios
- Comprehensive IT Monitoring – Nagios can monitor your entire IT infrastructure, from website to applications to any of your IT infrastructure equipment. It can collect metrics and show historical performance data for all such services and devices.
- Big Trusting Community – With 25+ years of proven track record since 1999 and 1M+ trusting customers from small to global organizations that rely on Nagios for monitoring their IT infrastructure, its support base is strong and reliable for any type of organization.
- On-Premise Solution – All Nagios solutions are on-premises and not based in the Cloud. This allows you more control over your data and security. Though you can host it on Cloud yourself, depending on your needs.
- Community Extensions and Add-Ons – Though Nagios provides out of the box support for most devices, you can further extend their capabilities using over 4000 plugins and extensions provided by Nagios Community.
- Perpetual Licenses – Nagios provides you with a perpetual license and if at some point you decide not to renew your solution, you can still keep on using it without access to Enterprise Features or Maintenance & Support benefits. Also, this is without any SaaS Lock-In, so you’ve full control on updates and upgrades.
Don’t Use Nagios, if you want a flexible, easy to set up solution for small-scale monitoring or if you do not have resources to self-host the product. You are better off using UptimeRobot to monitor up to 50 websites for FREE.
Nagios Pricing
Nagios provides different pricing structures for their different monitoring solutions. Its plans are primarily based on the Node-count of the license. Nagios also offer Enterprise add-on which enhances its capability for reporting, capacity planning etc.
While their base product, Nagios Core is always free to use, I’ve summarized the pricing of Nagios XI, the enterprise solution, in the table below.
| Plan | Starting Price |
|---|---|
| Free (Small Scale Environments) | Free 7 Nodes or 100 Services with no support |
| Standard (Small to Medium Environments) | $1,995 50 Nodes |
| Enterprise (Small to Medium Environments) | $3,990 50 Nodes with Premium Features |
For a custom environment size, you can always get a pricing estimate using their pricing calculator.
I would start with their free license for my project, if I know I’m going to scale my IT infrastructure to more services with time and probably switch to their paid plans as need arises. Nagios extensive capabilities cover most of my monitoring needs.
You can start with their free plan using the link below.
9. SigNoz
Best for open-source observability
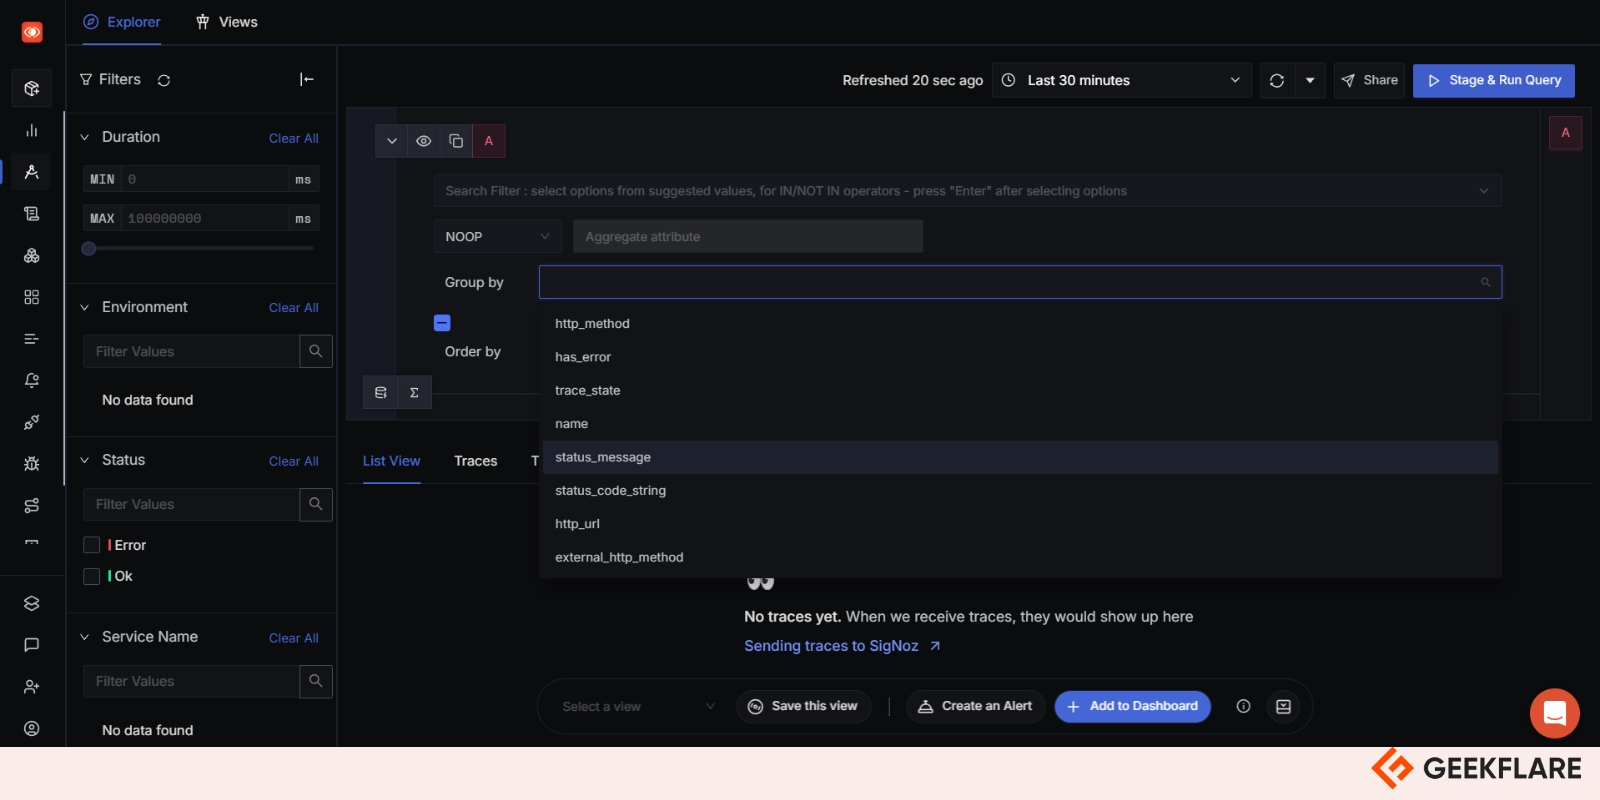
SigNoz is an open-source observability tool which uses OpenTelemetry to monitor your applications and infrastructure. It supports logs, metrics, traces, and exceptions, allowing you full-stack observability for your application. You can also use SigNoz as an analytics tool to debug the issue using its different features.
Why Use SigNoz
- SigNoz APM – SigNoz allows you to monitor your applications and services with out-of-the-box charts for key metrics like error rate and operations per second. It also has visibility to your database and external calls made by the application or service.
- Log Management – SigNoz is a centralized log management solution that you can use in place of tools like Datadog, Splunk, Graylog etc. With ClickHouse as data store, it allows you to run instant search on all your logs using quick filters with integrated powerful query builder. It also allows you to create charts and dashboards for your log monitoring needs.
- Distributed Tracing – SigNoz can also record traces for troubleshooting your microservices for your applications. Distributed tracing allows you to track user requests across services for performance bottlenecks. The data can be viewed as charts, allowing you to track issues in the flow of requests.
- Exceptions Monitoring – SigNoz can monitor exceptions in Python, Java, Ruby and Javascript automatically while also allowing support for other languages using custom code. You can track detailed stack trace for exceptions in your application while also supporting custom attributes for additional context.
Don’t use SigNoz if your monitoring requirements are very basic and don’t involve complex configurations, a simpler tool might suffice.
SigNoz Pricing
SigNoz provide both cloud-based and self-hosted solution for monitoring setup. The pricing for SigNoz cloud and self-hosted one is different and summarized in the table below.
SigNoz Cloud
| Plan | Starting Price (per month) |
|---|---|
| Teams | $199 |
| Enterprise Cloud | $4000 |
Self-Hosted
| Plan | Starting Price (per month) |
|---|---|
| Community Edition | Free to Self-Host |
| Enterprise Edition | $2500 |
SigNoz Community Edition is a great start in trying out this tool, which is free to self-host with most of its important features available and also includes community support.
For SigNoz Cloud, you can start using it immediately with no installation, maintenance, or scaling effort. A free 30-day trial account without need of credit card is available to test it out.
10. Apache SkyWalking
Best for distributed systems and microservices monitoring
Apache SkyWalking is an open-source observability platform used to collect, analyze, aggregate and visualize data from services and cloud native infrastructures.
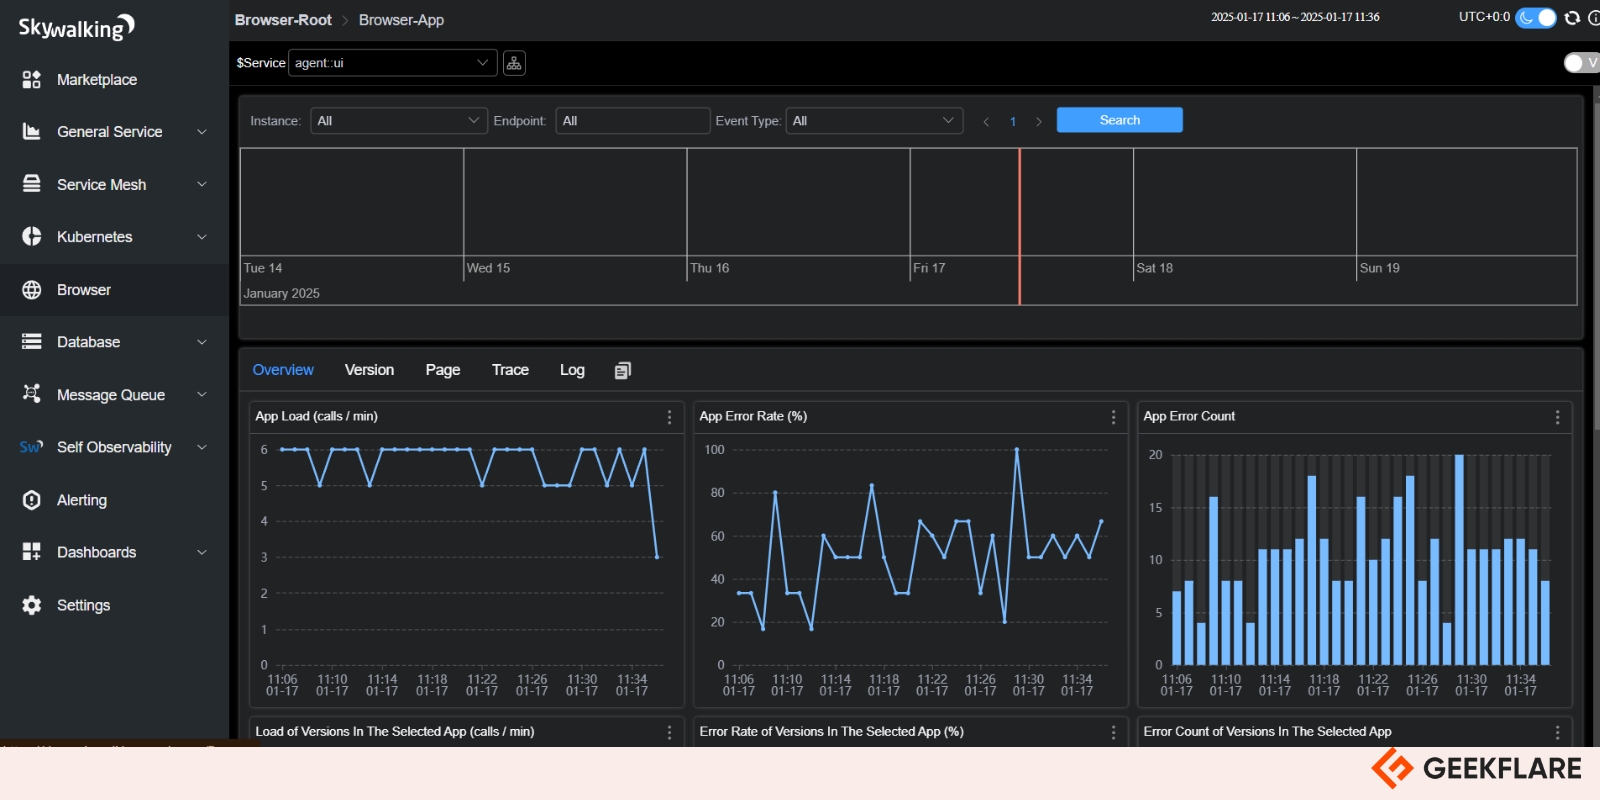
It provides auto-instrument agents for services, such as Java, C#, Node.js, Go, PHP and Python. Its service mesh receiver allows SkyWalking to receive telemetry data from service mesh frameworks such as Istio/Envoy, allowing users to understand the entire distributed system. It can also integrate with other distributed tracing, metrics, and logging systems and build a unified APM system to host all data.
Why Use SkyWalking
- Distributed Tracing – SkyWalking covers all the observability needs in the Cloud Native world, including supporting SkyWalking native data formats, and Zipkin traces of v1 and v2 formats.
- Mature Metrics – SkyWalking supports mature metrics formats, including native meter format, OTEL metrics format, and Telegraf format while integrating with Service Mesh platforms, typically Istio and Envoy, to build observability into the data plane or control plane.
- Logs Collection – SkyWalking supports logging, which includes logs collected from the disk or through the network. SkyWalking native agents could bind the tracing context with logs automatically or use it to bind the trace and log through the text content.
- Contextual Events – SkyWalking supports linking the events on your infrastructure with metrics that could help to explain the peaks or valleys in the metrics. Linking the events with traces and logs could also help on troubleshooting root cause of any incident.
Don’t use SkyWalking if you prefer a fully managed service rather than managing an open-source tool yourself, a cloud-based APM solution might be a better fit. You can check out SigNoz as an alternative for cloud distributed monitoring.
SkyWalking Pricing
Apache SkyWalking is an open-source tool that is available for free to download and use on your infrastructure. If you want to deploy it on a cloud like AWS, there may be charges related to the specific deployment.
I would recommend SkyWalking for monitoring any microservices for your applications since the features it offers are specifically suited for such observability.
You can download the latest version of SkyWalking from its official website or GitHub release page. There is a free demo available if you want to test out its features and UI.
11. Jaeger
Best for tracing requests in microservices
Jaeger is an open-source and cloud-native, distributed tracing observability platform that is designed for monitoring and troubleshooting workflows in complex distributed systems.
It can help you to monitor and debug your microservices by allowing you to visualize the flow of requests across different services in your application, which not only helps you to understand your application better but also identify potential performance bottlenecks and related issues.
Why Use Jaeger
- Highly Scalable Distributed Tracing – Jaeger backend is designed in such a way to avoid single point of failures and scalability. It can process billions of spans per day without affecting its performance.
- Cloud Native with OpenTelemetry – Jaeger backend and Web UI supports OpenTracing standard and can receive trace data in the standard OpenTelemetry Protocol (OLTP). Its backend is distributed as a container image or raw binary for most popular platforms and supports deployment on Kubernetes clusters. Jaeger also provides backwards compatibility with Zipkin by accepting spans in Zipkin formats (Thrift, JSON v1/v2 and Protobuf) over HTTP.
- Topology Graphs – Jaeger supports two types of service graphs, i.e., System Architecture and Deep Dependency Graph. The System Architecture, “classic” service dependency graph for all services observed in the architecture. The graph represents only one-hop dependencies between services, similar to what one could get from telemetry produced by service meshes. While “Deep Dependency Graph” shows multiple dependencies, where a chain
A -> B -> Cmeans thatAhas a transitive dependency onC. - Service Performance Monitoring – Jaeger allows you to monitor and investigate trends in the performance of your services by computing aggregate metrics from traces and visualizing them as time series charts. SPM in Jaeger is a powerful tool that can help you to identify and investigate performance issues in your application.
Don’t use Jaeger if you have limited microservices exposure or if you’re looking to monitor just your hardware IT infrastructure. Zabbix might be a good alternative for IT infrastructure monitoring.
Jaeger Pricing
Jaeger is 100% open-source, cloud-native, and infinitely scalable and is provided free of charge for everyone.
It is really helpful with systems having complex microservices architecture, where delays and errors can be challenging to track. It can help you to identify performance bottlenecks, troubleshoot errors and improve your application’s overall reliability.
You can download Jaeger components as either executable binaries for macOS, Linux and Windows platforms or container images to be run with Docker or Kubernetes environment.
12. Grafana
Best for visualizing Prometheus metrics
Grafana is an open-source tool that you can use to query, visualize, alert on, and explore your metrics, logs, and traces from wherever they are stored. With Grafana you can turn your time-series database (TSDB) data into insightful dashboards with graphs and visualizations.
Using plugin framework, Grafana enables you to connect various other data sources like NoSQL/SQL databases, ticketing tools like Jira or ServiceNow, and CI/CD tooling like GitLab.
Why Use Grafana
- Explore Monitoring Data – With Grafana, you can visualize your data like metrics, logs, and traces through ad-hoc queries and dynamic drilldown. Different metrics and time range statistics can be compares easily with split view side-by-side.
- Alerts and Annotations – Grafana Alerting tool allow you to send alerts through a number of popular notifier platforms like PagerDury, SMS, email, OpsGenie, Slack etc. Alert rules can be visually defined. Further graphs can be annotated with rich events from different data sources allowing you to correlate data for any issues.
- Community Dashboards and Plugins – Grafana provides hundreds of dashboards and plugins created by the Grafana community in their official library for you to import and use in your projects without putting in efforts to rebuild from scratch. With a huge community of members and users, new dashboards and plugins are added regularly.
- Integration with Grafana Labs Tools – In addition to Grafana, Grafana Labs also provides multiple open-source projects that can be easily integrated with Grafana OSS like Grafana Loki for logging stack, Grafana Tempo for distributed tracing, Grafana Mimir for a scalable long-term storage for Prometheus, Grafana OnCall as incident response management tool etc.
Don’t use Grafana if you need an all-in-one monitoring and alerting solution, as Grafana specializes in visualization with graphs and dashboards, so other tools might be more suitable.
Grafana Pricing
Grafana Labs provides an OSS or Open-Source Software, Enterprise, and Cloud versions of their popular Grafana tool.
Grafana OSS is open source and provided free of charge for self-hosting. Grafana Enterprise is a commercial edition of Grafana that includes additional features not found in the open-source version. While Grafana Cloud is a highly available, fast, fully managed OpenSaaS logging and metrics platform hosted by Grafana Labs and provided as SaaS.
Grafana Enterprise is a self-managed stack for enterprises with custom pricing option which includes features that provide better scalability, collaboration, operations, and governance in a self-managed environment.
For Grafana Cloud, I’ve listed down the starting price for its different tiers in the table below:
| Plan | Starting Price (per month) |
|---|---|
| Free Forever | $0 |
| Pro | $19 |
| Advanced | $299 |
You can start quickly with the free plan of Grafana Cloud, which offers the basic features without charge.
13. Prometheus
Cloud-native monitoring with powerful queries
Prometheus is a popular, open-source monitoring and alerting tool with a highly active developer and user community. Using Prometheus, you can collect and store metrics as time series data with the timestamp at which it was recorded, alongside optional key-value pairs called labels.
Prometheus ecosystem consists of multiple components like Prometheus Server, client libraries, push gateway, special-purpose exporters, alertmanager and various other support tools.
Why Use Prometheus
- Excellent Tool for Time Series Recording – Using Prometheus, you can record any purely numeric time series which fits both machine-centric monitoring and monitoring of highly dynamic service-oriented architectures.
- Reliable and Resilient Service – Prometheus is designed for reliability to allow you to quickly diagnose problems where each Prometheus server is standalone, not depending on network storage or other remote services. Further, it does not require you to setup extensive infrastructure to use it.
- Flexible Query Language – Prometheus comes with PromQL (Prometheus Query Language) that lets the user select and aggregate time series data in real time. While querying Prometheus, it can be an instant query, evaluated at one point in time, or a range query at equally spaced steps between a start and an end time. PromQL works exactly the same in each case; the range query is just like an instant query run multiple times at different timestamps.
- Large Active Community – Prometheus is supported by a large and active developer and user community which shapes and helps it in evolving to changing requirement of its user base. It is a standalone open-source project and maintained independently of any company.
Don’t use Prometheus if you are looking to monitor website or small infrastructure. Setup requires some sysadmin skills.
Prometheus Pricing
Prometheus is an open-source tool that can be downloaded and installed by anyone without any cost.
Officially, you can download precompiled binaries for various components of Prometheus from its website or GitHub page. The other option is to use provided Docker images for most officially maintained Prometheus components. There is also a constantly growing number of independently maintained exporters available for Prometheus.
Prometheus is an excellent tool for collecting time-series data for your monitoring metrics. You can get started with Prometheus by following the link below.
14. Zabbix
Scalable infrastructure monitoring
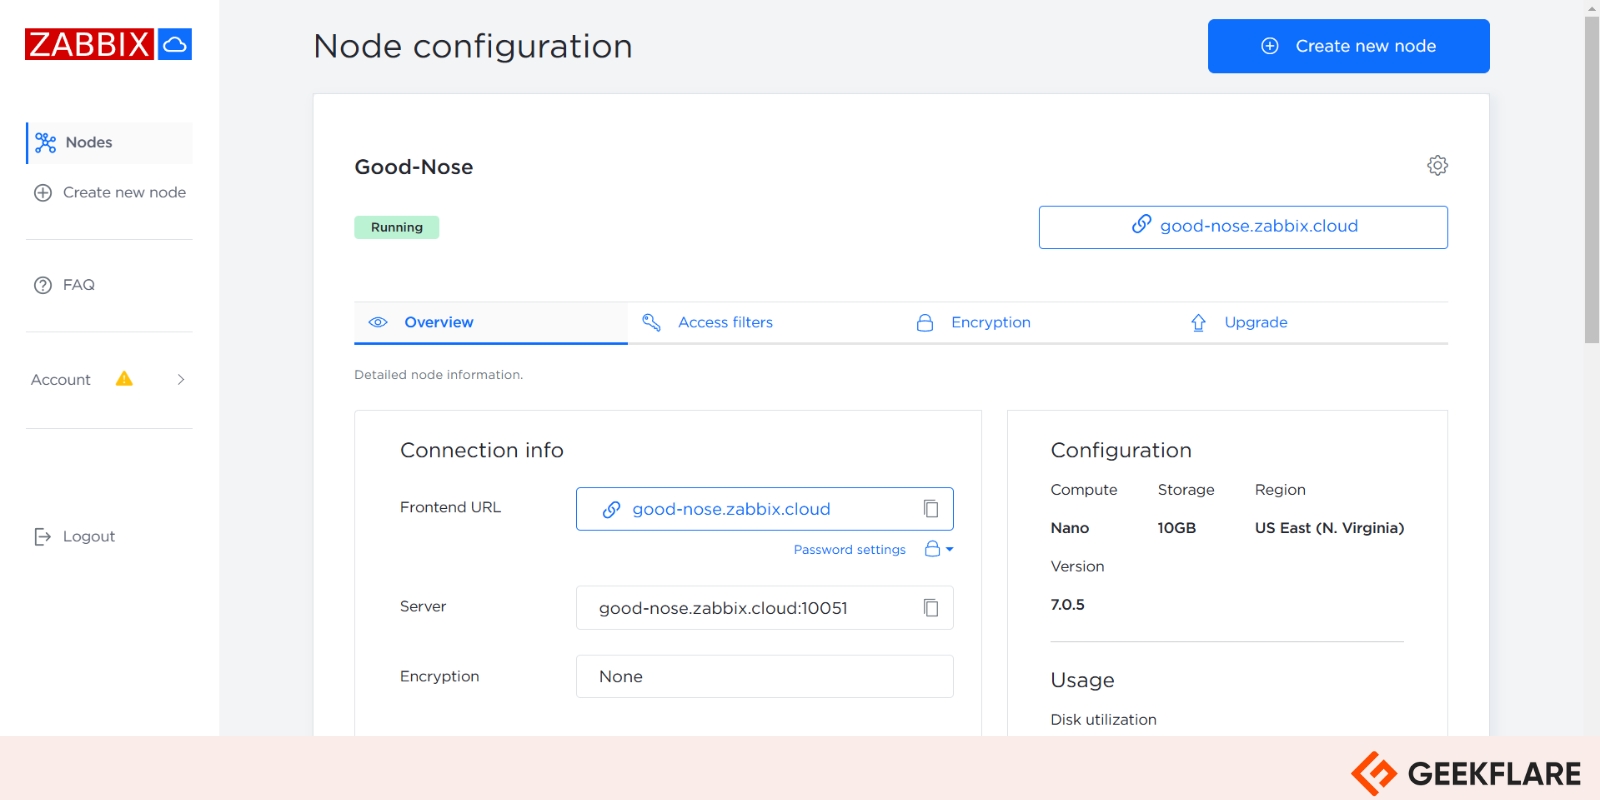
Zabbix is an enterprise-class, open-source distributed monitoring solution that can help you to monitor anything from networks to clouds and websites to IoT devices, and more. It is a software that can monitor multiple parameters of a network and your entire IT infrastructure.
Zabbix is suitable for small organizations with a few servers and for large companies with a range of servers and hardware.
Why Use Zabbix
- Highly Integrated Monitoring – Zabbix has powerful data gathering capability which can perform availability and performance checks while having support for SNMP, IPMI, JMX, VMware. You can also configure custom checks, gathering desired data at custom intervals and define very flexible problem thresholds, called triggers, referencing values from the backend database. Zabbix also has highly configurable alerting system which can be customized for the escalation schedule, recipient, media type etc.
- Extensive Visualization Options – Zabbix allows you to graph monitored items immediately using the built-in graphing functionality. You can create custom graphs that can combine multiple items into a single view. You can also create network maps, slideshows, reports, and business view of monitored resources.
- Extensible Agent – Zabbix has a highly extensible and full-featured agent that can be easily deployed on monitoring targets including physical machines, VMs and cloud instances. The agent is supported on both Linux and Windows operating systems.
- Zabbix API – Zabbix API provides you with programmable interface to Zabbix for mass manipulations, third-party software integration and other purposes. This is especially useful in automating your monitoring infrastructure and customizing Zabbix functionalities according to your business needs.
Don’t use Zabbix if your IT infrastructure is limited, and you require only small-scale monitoring of only a few devices since Zabbix is a full suite of monitoring solution with relatively moderate system requirement and learning curve.
Zabbix Pricing
Zabbix software is a free of cost enterprise monitoring solution. You can download and use Zabbix On-Premise without any charge.
There are technical support subscriptions tiers that can be purchased for instant access to a team of Zabbix experts. These tiers are Silver, Gold, Platinum, Enterprise and Global whose pricing can be requested on quote.
They also offer Zabbix Cloud, which is a fully managed SaaS platform that provides scalable, secure monitoring using Zabbix without the need for hosting it yourself or doing its regular maintenance. Zabbix Cloud tiers range from Nano to 2xLarge based on NVPS (the number of new data points or metrics processed by Zabbix per second) with various starting prices, which are summarized in the table below.
| Plan (NVPS – New Values Per Second) | Starting Price (per month) |
|---|---|
| Nano (50) | $50 |
| Micro (100) | $100 |
| Small (250) | $250 |
| Medium (1000) | $750 |
| Large (2500) | $1875 |
| xLarge (5000) | $2500 |
| 2xLarge (10000) | $5000 |
Zabbix offers you comprehensive, scalable, and customizable open-source monitoring of your entire IT infrastructure and is well suited for medium to large scale enterprises.
You can try Zabbix Cloud for free with its free trial offer for its Nano tier.
15. Scouter
Best for Java application monitoring
Scouter is an open-source Application Performance Management tool similar to New Relic and AppDynamics which can monitor targets using its agents. These agents can run on different environments like Java agents of web application, host agents for Linux, Windows, and Unix. Besides from Telegraf and Zipkin-Scouter storage, you can monitor other tools like web servers, proxies, databases etc. and any Zipkin instrumentation.
Why Use Scouter
- Installation and Security – Scouter is an installation-based tool that must be deployed within the security zone of your application systems. This allows for deeper monitoring and heavier data collection compared to SaaS services, and provides more comprehensive monitoring capabilities despite more complex setup.
- Client Architecture – Scouter uses a standalone client built on Eclipse RCP platform instead of web-based interface, which enables handling and visualization of larger performance datasets. This also offers you with enhanced monitoring capabilities compared to traditional web clients.
- Data Management – Scouter implements data compression for storage efficiency and is capable of collecting and analyzing individual service transactions. It stores service performance and profile data in compressed file format and enables management of large volumes of monitoring data.
- Advanced Monitoring Features – Scouter can track individual service transactions (XLOG) with detailed profiling, and this provides you with cumulative analysis of active thread-stacks. It also features “Stack Frequency Analyzer” for comprehensive performance problem-solving and enables collective stack analysis for enhanced problem identification.
Don’t use Scouter if you cannot install Java on your monitoring target or Java is not supported. Scouter relies heavily on Java framework and needs either JDK or JRE on the targets.
Scouter Pricing
Scouter is an open-source Application Performance Management solution, and its binaries are freely available from its GitHub Releases page for download.
16. New Relic
Best for in-depth APM with code-level insights
New Relic is a popular application monitoring and observability platform which gives you a 360-degree view of telemetry for your infrastructure stack.
It includes health, code-level and user insights with full-stack performance visibility for your entire stack including browser and synthetic monitoring. New Relic offers a complete suite of features for end-to-end monitoring of your microservices application.
Why Use New Relic
- Application Health at a Glance – New Relic instantly monitors your golden metrics and shows their dependencies. It can spot issues with alerts and error tracking. You can observe user experience stats in the APM interface with key transactions, synthetic checks, and browser monitoring. You can also monitor SLOs and business KPIs in real time to spot potential issues before they impact your business.
- Insights across Application Lifecycle – New Relic can easily track the impact of deployment and changes on your application performance by allowing instant visibility into all application vulnerabilities. New Relic also supports bringing telemetry data to your engineers in their IDE itself with CodeStream.
- Faster Debugging with Unified View – New Relic allows you to view infrastructure metrics within APM to quickly detect root causes and get instant insights with error user impact view and log patterns. Distributed tracing allows you to trace and visualize the path of any service request.
- Automatic Agents for Instrumentation – New Relic supports 775+ integrations, including automatic instrumentation. You can either use New Relic agents for this instrumentation or have full OpenTelemetry support. This allows you to instrument everything on a single platform and thus monitor all your data in a unified experience.
Don’t use New Relic if budget is a concern for you.
New Relic Pricing
New Relic offers tiered pricing for their monitoring product. There are both user and usage-based pricing tiers which can be selected based on your needs.
A summary of their pricing structure is given in the table below:
| Plan | Details |
|---|---|
| Free | Perpetual with 100 GB/mo ingest limit |
| Standard | Small teams up to 5 engineers with ticket support |
| Pro | Teams with more than 5 engineers with 2-hour critical initial support response SLA |
| Enterprise | For large-scale organizations |
New Relic provides end-to-end observability, allowing you to monitor everything from infrastructure to application performance, logs, and user experience in a single platform.
17. Dynatrace
AI-powered observability
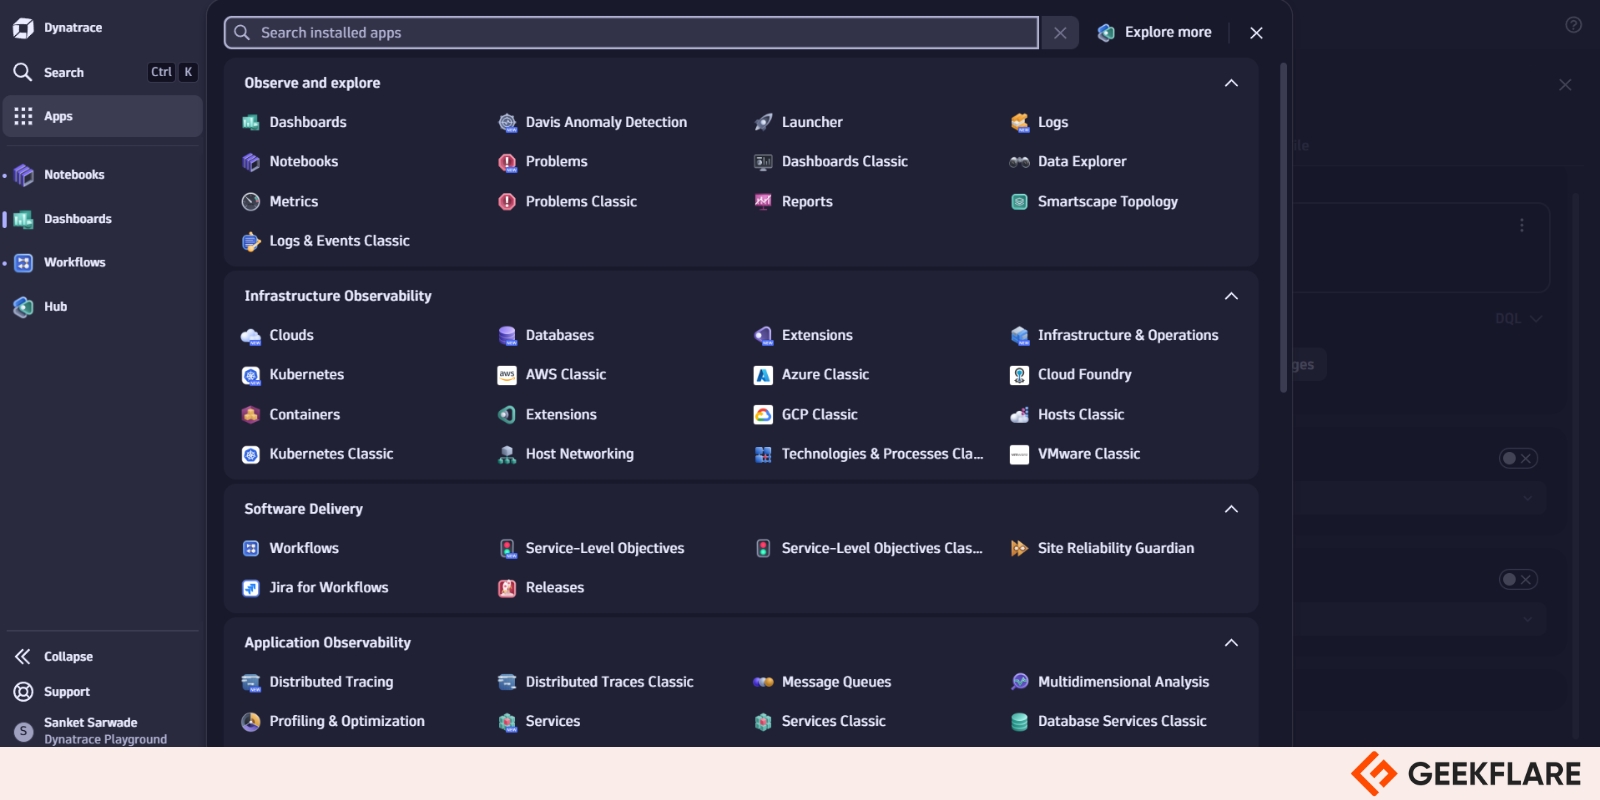
Dynatrace is an AI powered unified observability platform which allows faster innovation with enhanced security. It is the only analytics and automation platform powered by causal AI. Dynatrace is an all-in-one platform that’s purpose-built for a wide range of use cases including infrastructure and application observability, logs, application security and threat observability, software delivery and business analytics.
Why Use Dynatrace
- AI Powered Observability – Dynatrace allows you to get automatic and intelligent infrastructure monitoring and observability across hybrid and cloud environments, with precise AI-powered answers. It leverages best-in-class application performance monitoring (APM) to ensure optimal service performance and SLOs which allows faster innovation and efficient collaboration.
- Integrates Security and Runtime Observability – With Dynatrace, you can get continuous application security posture insights and protection from attacks. It can detect and block common attacks on application-layer vulnerabilities like SQL injection while also protecting against some critical zero-day attack types, like those for Log4Shell.
- Real-Time Threat Detection – Dynatrace can provide real-time threat detection for multiple vectors using the combination of ingested data and metrics. It can quickly detect, investigate, and respond to threats with intelligent automation.
- Powerful Analytics – Dynatrace allows you to verify current or suspected security incident like an application attack. You can quickly verify what happened, leverage its observability context to analyze in detail, and take proactive actions. Log analytics allows you to make smarter, faster decisions when troubleshooting and measuring the health of your application environments. Dynatrace can simplify critical, real-time business decisions with precision, speed, and context.
Don’t use Dynatrace if your observability requirement is limited to simple monitoring without need of AI-driven monitoring, security features or analytics provided by this product.
Dynatrace Pricing
Dynatrace offers a transparent hourly charge-based pricing for its different platform features with no hidden fees. The table below shows you some of the important features of Dynatrace along with their hourly charge.
| Type of Monitoring | List Price |
|---|---|
| Full-Stack | $0.08 per hour for 8GiB host |
| Infrastructure | $0.04 per hour for any size host |
| Kubernetes Platform | $0.002 per hour for any size pod |
| Application Security | $0.018 per hour for 8GiB host |
| Real User | $0.00225 per session |
| Synthetic | $0.001 per synthetic request |
| Log Management & Analytics | $0.20 per GiB (Ingest & Process) $0.02 per GiB-day (10 to 35 days retention) |
You can refer to their full rate card for further details about pricing of individual features.
Dynatrace is suggested for anyone who is looking for AI-powered, full-stack observability with automated root cause analysis. It allows you to ensure optimal performance of your applications with limited manpower.
You can evaluate Dynatrace and its features with its free 15-day trial without need of a credit card.
18. Datadog
Comprehensive monitoring across your stack
Datadog is the observability and security platform for cloud applications. Its Application Performance Monitoring (APM) is powered by AI and provides code-level distributed tracing from browser and mobile applications to backend services and databases.
Using Datadog, you can correlate traces with logs, metrics, real user monitoring (RUM) data, security signals, and other telemetry. It provides you with a unified, real-time observability and security for your entire technology stack
Why Use Datadog
- Application Security – Datadog detects vulnerable open-source libraries and custom code-level vulnerabilities during development and in production as they monitor the overall health of their services. It monitors and blocks ongoing threats that target your applications through the service chain with end-to-end attack flows. Further, you can assess and improve the performance and security posture of all your API endpoints in a single view.
- Monitoring Consolidation – Datadog’s observability and security platform brings your tools, technologies, telemetry, and teams together, enabling better collaboration and resource efficiency. With its extensive integration support and AI-powered technology, you can ingest, visualize, and troubleshoot telemetry from any source in your stack in one unified platform.
- Digital Experience Monitoring – The Digital Experience Monitoring suite provided by Datadog, which includes Real User Monitoring (RUM), Synthetic Monitoring, and Error Tracking, provides a single source of truth for frontend monitoring data, so you can better understand your user’s activity and troubleshoot frontend issues efficiently.
- Powerful Integration Support – Datadog supports more than 500 integrations and if you need an integration that doesn’t exist, you can build one. Further, if you need something more specific or specialized for your application, integrations allow you to monitor technical information in different systems, apps, and services.
Don’t use Datadog if you need small-scale or limited monitoring of your application or services, considering its cost.
Datadog Pricing
Datadog comes with flexible, transparent pricing which is scalable to your business needs. The cost varies based on monitoring type and region where your data is housed. They also offer multi-year/volume discounts available for the platform. For most monitoring checks, they offer free (basic), pro and enterprise tiers.
Annual, monthly and hourly plans are also available which can be customized according to meet your business needs. For a detailed explanation of pricing, you can check out their Billing FAQ.
You can use Datadog for comprehensive, cloud-scale monitoring and analytics that provide real-time visibility into your entire technology stack, ensuring optimal performance and quick issue resolution. Plus, its extensive integration support makes it easy to incorporate into your existing workflows.
You can get started with its 14-day free trial without need of payment proof like credit card.
19. Sentry
Best for error tracking and front-end performance
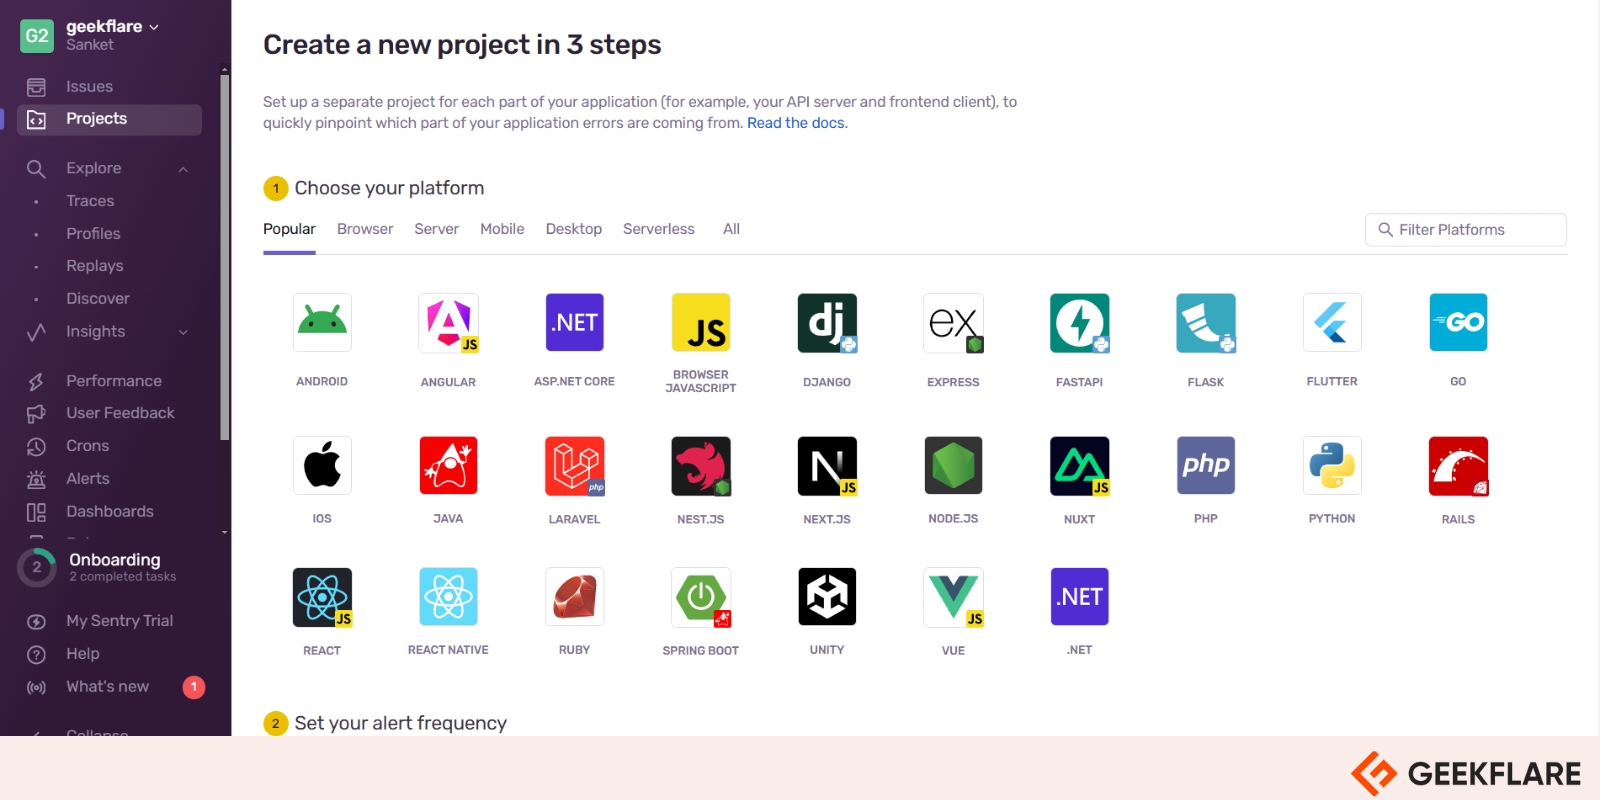
Sentry is an end-to-end, developer-first, distributed tracing and software monitoring platform that enables you to identify and debug performance issues and errors across your systems and services. It provides code-level observability that makes it easy to diagnose issues and learn continuously about your application code health.
Why Use Sentry
- Error Monitoring – The error monitoring capabilities in Sentry makes it possible for you to quickly get to the root of a problem and fix it. It automatically captures errors in your codebase and further groups similar errors into issues, making it possible to triage and manage them more efficiently.
- Distributed Tracing and Profiling – Tracing feature of Sentry gives you a full view of what’s happening in your application or service from frontend to backend and in between. With distributed tracing, you can quickly identify performance bottlenecks.
- Code-Level Insights – Sentry’s Profiling provides code-level insights into your application performance allowing you to find and fix your code faster. This profiling can be done in any environment your application is running on, allowing you to identify which functions are causing a slow span.
- Release Health Monitoring – Sentry can monitor your releases, making it possible to see the moment a release starts to degrade, allowing you to take immediate action. It provides real-time visibility on your releases with core metrics like crash-free sessions, version adoption, and failure rate etc. It further gives you observability on how an error or performance issue gets affected by a release.
Don’t use Sentry if your release cycle is rare and/or your monitoring requirement is not specific to code-level insights or errors in your code.
Sentry Pricing
Sentry offers both monthly and annual plans for dev teams of all sizes. There are discounts on annual plans.
Pricing summary for different plans offered by Sentry is given in the table below.
| Plan | Starting Price (per month) |
|---|---|
| Developer (Solo Devs) | Free |
| Team (Growing Teams) | $26 |
| Business (Multiple Teams) | $80 |
I would suggest Sentry if you would like to monitor and fix errors in real-time, providing developers with detailed insights and alerts to improve application performance and user experience. Its seamless integration with various development tools ensures efficient issue tracking and resolution.
You can get started with a 14-day free trial without need of a credit card using the link below.
20. Airbrake
Easy-to-use error monitoring
Airbrake is an error monitoring and APM tool that provides continuous monitoring for your entire application stack with real-time alerts. With agentless and serverless architecture, it’s designed for easy setup while gaining visibility into the health of your entire web or application services.
Why Use Airbrake
- Developer Focused Error Monitoring – Airbrake error monitoring supports all major languages and frameworks while also integrating with your favorite apps, providing a developer focused monitoring platform. It also supports single sign-on for authentication.
- Real-Time Alerts with Easy Setup – You can get started with Airbrake’s error and performance monitoring quickly, which is simple to get up and running in minutes. It provides you with real-time error alerts and discovers errors up to the line of code.
- Agentless and Serverless Architecture – Airbrake comes with agentless and serverless architecture which provides with open-source SDK-based install. It is easy to maintain yet provides you with visibility into the health of your entire application stack.
- Aggregations and Breadcrumbs – Airbrake provides you with Aggregations that offers detailed insights across all occurrences of an error group, including error messages, server details, user information, and more. Additionally, breadcrumbs capture a timeline of events leading to an error, such as web requests and user interactions, to help you understand the error’s context.
Don’t use Airbrake for tiny or personal projects with minimal traffic, the overhead of setting up and maintaining Airbrake might not be worth it.
Airbrake Pricing
There is a flexible usage-based pricing offered by Airbrake. There are monthly and annual plans available with discounts.
The starting price of their 3 plans is given in the table below for your reference.
| Plan | Starting Price (per month) |
|---|---|
| Dev (1 User with 1 Team) | $17 |
| Basic (Unlimited Users with up to 3 Teams) | $34 |
| Pro (Unlimited Users and Teams) | $68 |
Airbrake offers you free 30-day trial for every plan with requirement of a valid email and credit card which can be cancelled any time during your trial. During the trial, you’ll have unlimited access to all of Airbrake’s key features.
You can use Airbrake for real-time error monitoring and bug tracking of your applications, helping you to quickly identify and resolve issues. Its integration with development tools enhances your workflow efficiency and application reliability.
21. LogRocket
Best for finding UX issues
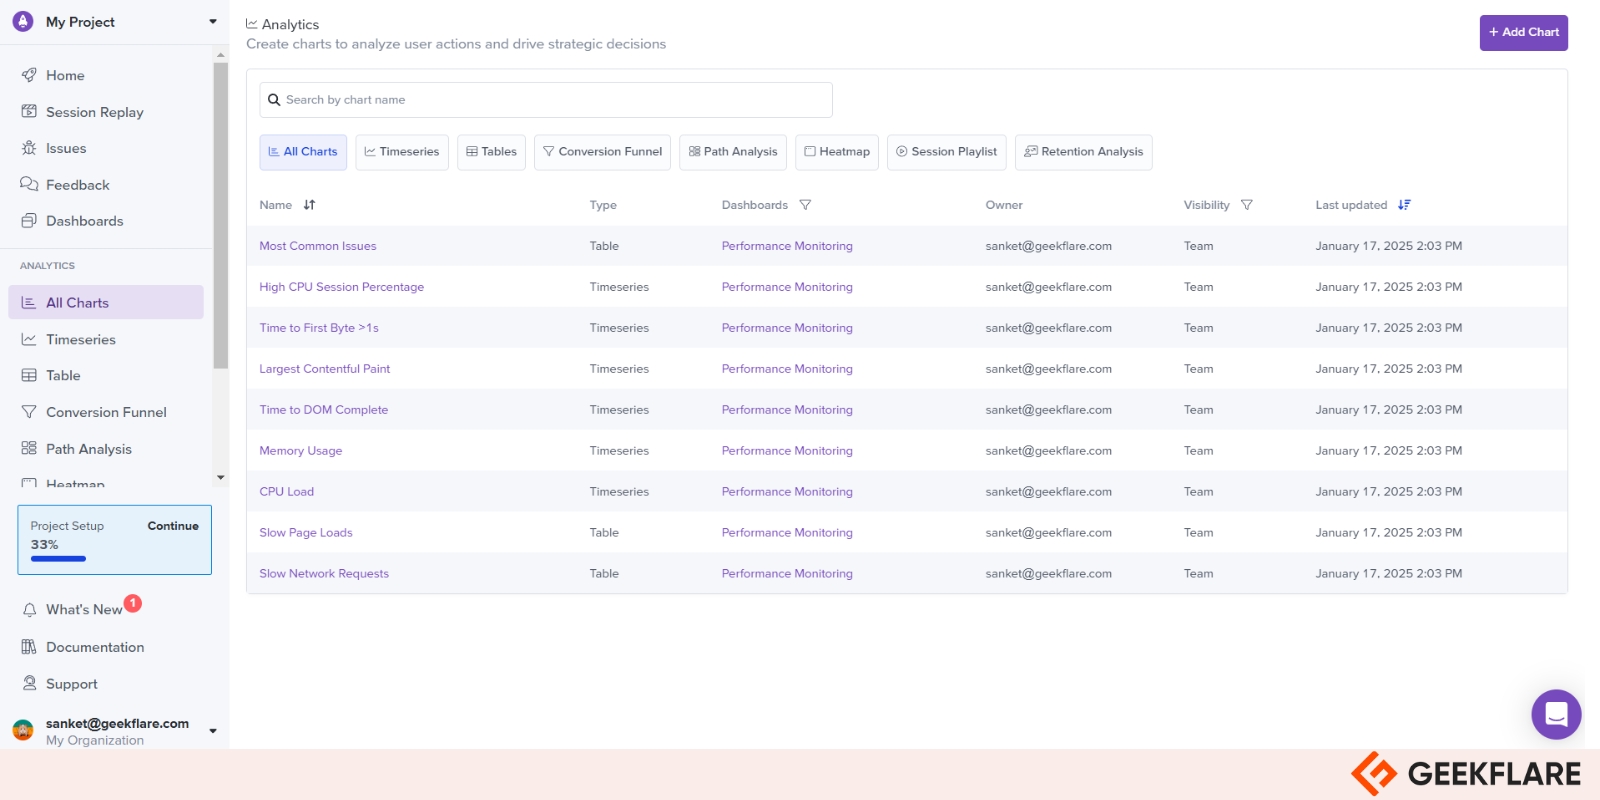
LogRocket provides you with comprehensive observability into how users engage with and behave within your website or mobile application. It combines session replay with product analytics and technical and usability issues, offering actionable insights which can be used to enhance every user’s experience.
Why Use LogRocket
- AI-Based Optimizations – LogRocket Galileo AI can highlight the most impactful issues blocking your users. It can answer questions and measure success without code changes through auto capture and self-serve product analytics.
- User-Reported Issues – LogRocket can help you summarize user sessions and identify key moments using Galileo AI. It can validate insights and diagnose root cause with its pixel-perfect session replay and in-depth telemetry.
- Surface User Struggle – LogRocket can help you proactively identify where users get stuck in your app and immediately find high-impact issues. Galileo AI monitors sessions automatically and can identify priorities. It can further send alerts when new issues arise.
- Mobile Apps Monitoring – LogRocket can reproduce every issue with pixel-perfect session replay. It can track sign-ups, checkouts, and other user flows to quantify the impact your user experience has on conversion. Further it can create custom metrics to maximize app engagement and adoption.
Don’t use LogRocket if your team has limited resources or budget constraints, you might want to consider more cost-effective alternatives or built-in error tracking solutions.
LogRocket Pricing
LogRocket has pricing plans that can scale with your growth. The plans come with mobile and web support, which are available for both monthly and yearly subscriptions. Discounts are available for prepaid annual subscriptions. Additionally, a self-hosted version is available for on-premises deployment in the Enterprise tier.
A summary of LogRocket offered plans is given in the table below.
| Plan | Web (per month) | Mobile (per month) |
|---|---|---|
| Free (1k sessions/month) | Free Forever | Free Forever |
| Team (10k sessions/month) | $69 | $139 |
| Professional (10k sessions/month) | $295 | $350 |
LogRocket can help you with front-end performance monitoring and error tracking of your application, providing detailed insights into user interactions and application issues. Its robust analytics and session replay capabilities help you to quickly identify and resolve performance bottlenecks.
You can get started with LogRocket either using their Free plan or get a 14-day free trial for their Team or Professional plans.
22. Firebase Crashlytics
Best for mobile crash reporting
Firebase Crashlytics is a real-time crash reporter that allows you to track, prioritize, and fix stability issues with your Apple, Android, Flutter, and Unity based mobile applications. It can further intelligently group crashes and highlight the context that caused those crashes.
Crashlytics can alert you if a particular crash is impacting a lot of your users, or when an issue suddenly increases in severity. It can also help you in pointing out which lines of code are causing crashes.
Why Use Firebase Crashlytics
- Streamlined Crash Reporting – Crashlytics combines a number of crash reports into a concise list of actionable issues. It can provide you with contextual information about each crash and also ranks their severity and frequency, enabling quicker identification of root causes.
- Solutions for Frequent Crashes – With Crash Insights, Crashlytics provides you with valuable tips on common stability issues. These resources simplify the troubleshooting process, making it easier for you to triage and resolve recurring problems effectively.
- Seamless Analytics Integration – Crashlytics integrates with Analytics to track your app errors as
app_exceptionevents. This feature enhances debugging by linking crashes to preceding events and allows for detailed audience insights through customized Analytics reports. - Real-Time Alerts – Receive real-time alerts for new, regressed, or escalating issues that may need urgent attention. This proactive approach ensures that you can address potential problems before they impact your users.
Don’t use Firebase Crashlytics if high-end performance is a key concern for your app. Adding Crashlytics can impact your app performance due to the additional overhead of logging and reporting crashes. Depending on your specific needs, other crash reporting tools like Sentry or Microsoft App Center might be more suitable.
Firebase Crashlytics Pricing
Firebase Crashlytics is available free of cost for everyone.
You can use Crashlytics to help track, prioritize, and fix stability issues in your mobile app in real-time. This ensures a smoother user experience for your app. It also provides you with detailed insights into app crashes and non-critical errors, making it easier to maintain a high-quality app.
You can get started with Crashlytics using the link below.
23. BugSnag
Best for error monitoring in mobile apps
BugSnag is an error and performance monitoring platform designed specifically for use with mobile apps. It provides error reporting libraries for all major software platforms which automatically detect and report errors in your applications while also capturing diagnostic data.
BugSnag dashboard gets updated in real-time with reported errors, allowing you and your team to triage and prioritize each error immediately. It also provides performance monitoring libraries for front end platforms, which can help you with performance monitoring of your applications.
Why Use BugSnag
- App Stability Management – With BugSnag’s App Stability Management, you can track your application’s stability across releases against a set target and intervene when its stability drops. You can investigate stability issues on the timeline to understand error trends, pinpoint error spikes, investigate specific incidents, or determine if a release has introduced a new bug.
- Error Monitoring – BugSnag’s error monitoring with actionable insights allows you to see exactly what type of errors are occurring, and where in your application with all the information you need to fix them. You can create custom filters for errors on multiple attributes and save the search filters with bookmarks. Its error prioritization and automatic assignment feature makes it easy to get things done and resolve reported issues.
- Real User Monitoring – With BugSnag, you can zero-in on slow performance by identifying performance outliers with search and segment. You can customize your dashboard by selecting your most popular screens, page loads etc. and get context behind specific user actions with waterfall views of performance traces. BugSnag is also compatible with OpenTelemetry, which allows you to control your data.
- Distributed Tracing – Distributed Tracing helps you to quickly troubleshoot performance bottlenecks and errors within your microservices. It allows you to monitor errors and performance issues and correlate root causes across traces, logs, and metrics. You can resolve issues faster by viewing spans and traces at the same time with side-by-side correlation.
Don’t use BugSnag if you’re working on a small project with minimal complexity and few users, the overhead of setting up and maintaining BugSnag might not be worth it.
BugSnag Pricing
BugSnag has free as well as paid plans available. The plans are tiered mainly on error monitoring events and performance monitoring spans. You can further get discounts on annual plans.
There is also BugSnag On-Premise version available for you to install, maintain, and manage your own data.
A summary of their different plans is given in the table below.
| Plan | Starting Price (per month) |
|---|---|
| Free (Solo users) | $0 (1 user) 7.5k events + 1M spans |
| Select (Small Teams) | $20 (Unlimited users) 50k events + 1M spans |
| Preferred (Large Teams) | $33 (Unlimited users) 100k events + 1M spans |
BugSnag is recommended for real-time error monitoring and stability management, providing you with actionable insights to improve your application’s reliability. Its intuitive interface and detailed error reports streamline the debugging process, ensuring a smooth user experience.
You can check out BugSnag free for 14-day without need of a credit card.
24. Instabug
Best for in-app bug reporting and feedback
Instabug is an AI-powered mobile observability platform that allows you to test new features, improve your app quality, and collect actionable user feedback for your product’s whole development lifecycle.
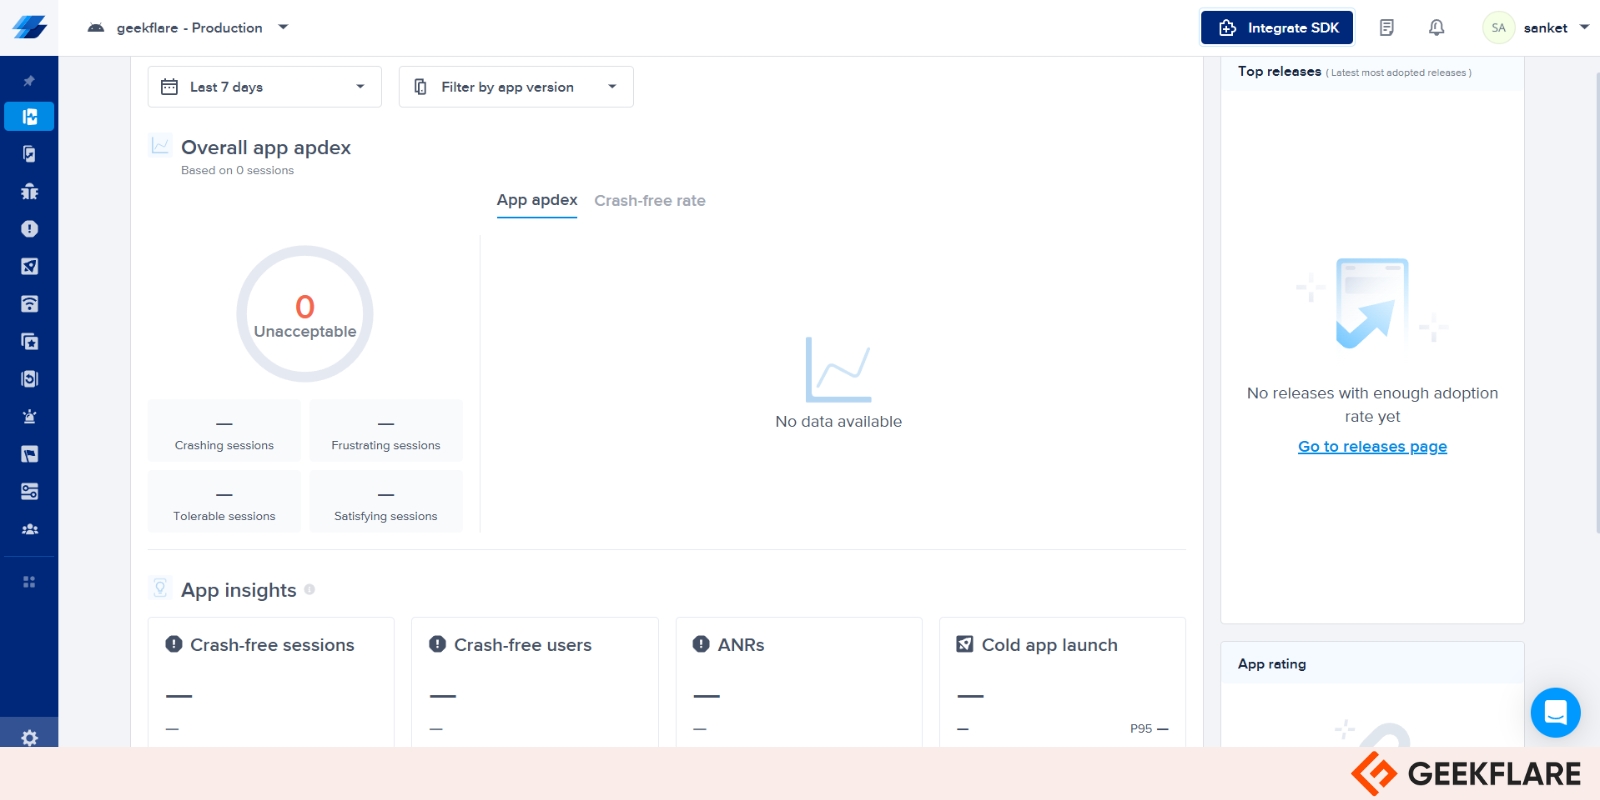
It supports multiple platforms like iOS, Android, React Native, Xamarin, Cordova, Flutter, and Unity mobile apps.
Why Use Instabug
- AI-Powered Platform – Instabug’s AI-powered mobile observability platform includes features like comprehensive performance monitoring, crash analytics, bug reporting, app ratings and reviews, release management, and session replay. These can help you to seamlessly balance innovation and app stability.
- AI-Driven Insights – Instabug’s
SmartResolve, powered by AI, helps you with crash resolution from root cause identification to code fixes.Visual Issuesassists you with the process of identifying UI inconsistencies across devices and OS versions using advanced AI vision models to ensure your app looks flawless on every screen. LastlyBroken Functionalitycan analyze user flows to catch breakdowns that don’t trigger crashes or performance alerts. - App Performance Monitoring – Instabug can help you stay on top of critical issues which can affect your users’ experience even before anyone complains. Using mobile-focused performance metrics, Instabug can help you prioritize between resolving issues and building new features.
- Data Protection & Security – Instabug follows the highest security standards with high availability and redundancy. Your data is protected through encryption in transit and at rest. It is SOC2, GDPR-compliant and follows practice of regular third-party penetration testing.
Don’t use Instabug if your app doesn’t require frequent user interaction or feedback. In such a case, the benefits of using Instabug might not outweigh its costs, and another solution might be better.
Instabug Pricing
Instabug offers 3 pricing plans for its product, with monthly and yearly payment options. There are savings in overall cost if you opt for its annual plan.
The below table summarizes the starting price of their different annual plans.
| Plan | Starting Price (mo, annual billing) |
|---|---|
| Basic | $249 |
| Pro | $499 |
| Ultimate | $749 |
You can use Instabug for real-time feedback, bug reporting, and crash reporting, providing you with detailed insights to enhance your app’s quality. Its in-app chat and survey capabilities streamline communication with users, ensuring a smooth experience.
Instabug provides 14-day free trial option for their Basic, Pro and Ultimate plans without need of a credit card. Use the link below to get started.
Conclusion
Selecting the right application monitoring tool is crucial for ensuring the performance, reliability, and user satisfaction of your applications. This article highlighted the best application monitoring tools of 2025, offering a range of free and paid options to suit diverse needs and budgets.
By understanding the unique features, strengths, and use cases of each tool, you can make an informed decision that aligns with your specific monitoring requirements and organizational goals along with the estimated budget.

