Network monitoring software helps keep IT systems running smoothly by tracking the health and performance of network devices. It identifies issues such as slow speeds, data loss, or downtime early, allowing IT teams to resolve them quickly.
As more businesses move to the cloud, support remote teams, and use complex setups, reliable monitoring has become essential. The right monitoring tool helps prevent problems, protects data, and ensures stable performance.
To make your search easier, Geekflare has researched and compiled top network monitoring solutions across various categories, including SaaS-based, enterprise-grade, and open-source, listing key features and use cases to help you find the perfect fit for your needs.
- SaaS Network Monitoring Tools (Easy Deployment & Scalability)
- Network Monitoring Suites (Enterprise-Grade)
- Open Source & Free Network Monitoring Tools (Cost-Effective)
You can trust Geekflare
At Geekflare, trust and transparency are paramount. Our team of experts, with over 185 years of combined experience in business and technology, tests and reviews software, ensuring our ratings and awards are unbiased and reliable. Learn how we test.
SaaS Network Monitoring Tools (Easy Deployment & Scalability)
SaaS-based network monitoring tools are cloud-managed services that offer fast setup, low infrastructure costs, and easy scaling. Many businesses prefer them to avoid the hassle of maintaining on-premise systems.
A key advantage of SaaS network monitoring is the ease of deployment. There’s no need to install or maintain physical servers, as the SaaS vendor handles all processing and storage. They provide web-based dashboards, making them accessible to teams regardless of their location.
Scalability is another major benefit. SaaS-based solutions can monitor everything from a few local endpoints to hundreds of global branches without major reconfiguration. These platforms often come with APIs and integrations with major cloud providers (AWS, Azure, GCP), enabling seamless visibility across hybrid or fully cloud-native environments.
Many SaaS network monitoring tools also bring in AI/ML-powered analytics, anomaly detection, and automated alerting, which lets you proactively manage networks of all sizes – from small LANs to multi-region VPCs.
For a broader view of cloud asset management, check out Geekflare’s comprehensive guide to cloud monitoring tools.
Below are some of the top SaaS-based network monitoring tools you can deploy today:
1. Datadog
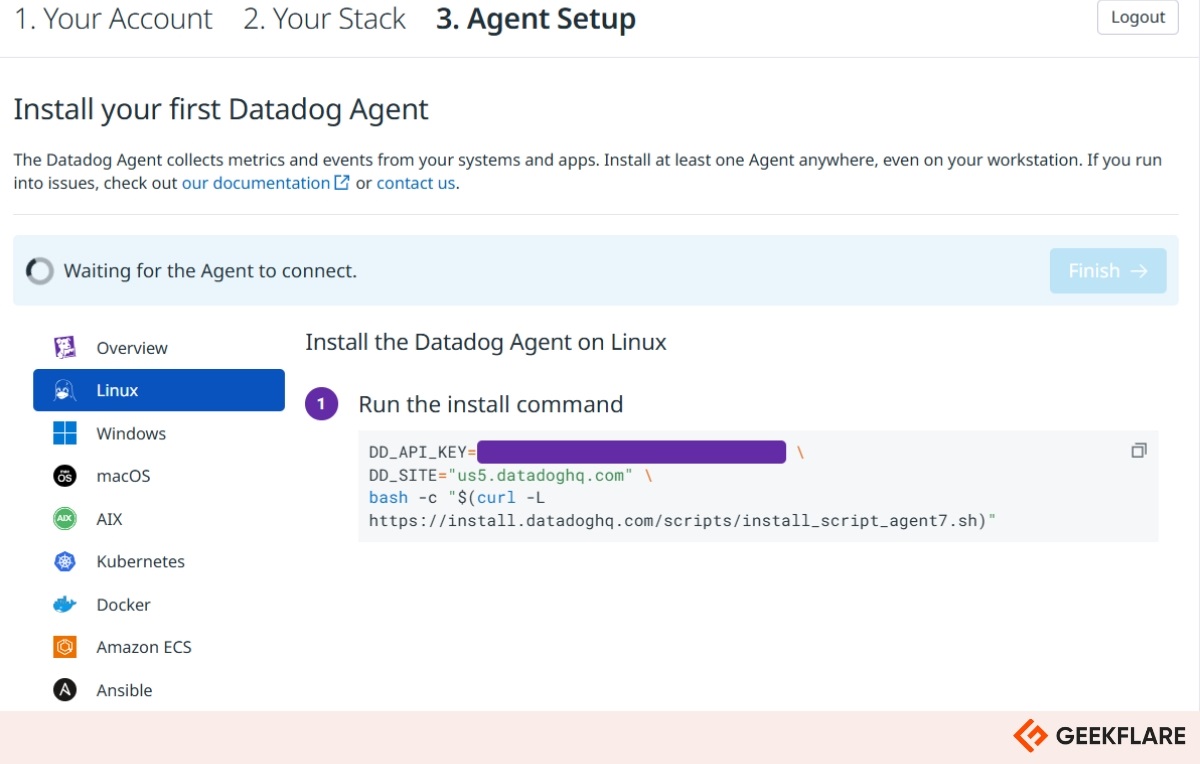
Datadog is a cloud-native monitoring and analytics platform that provides end-to-end visibility into network performance across hybrid environments.
Datadog Key Features
- Real-time network flow analytics and automatic device discovery
- Cloud integrations with AWS, Azure, and GCP
- Real-time performance metrics & dashboards
- AI-powered anomaly detection for proactive insights
- Customizable alerting mechanisms for faster incident response
Datadog Use Cases
- Monitoring complex, distributed cloud environments
- Optimizing performance across hybrid cloud infrastructures
- Proactive identification of network bottlenecks
2. Auvik
Auvik offers cloud-based network monitoring and management, prioritizing simplicity and automation to support IT teams.
Auvik Key Features
- Automated network discovery and mapping
- Configuration backup and management
- Traffic analysis with actionable insights
- Real-time alerts and notifications
- Support for multivendor network devices
- Remote network monitoring capabilities
Auvik Use Cases
- Managed Service Providers (MSPs) managing multiple client networks
- Small to medium-sized businesses seeking automated network management
- IT teams requiring rapid deployment and scalable solutions
3. Site24x7 Network Monitoring
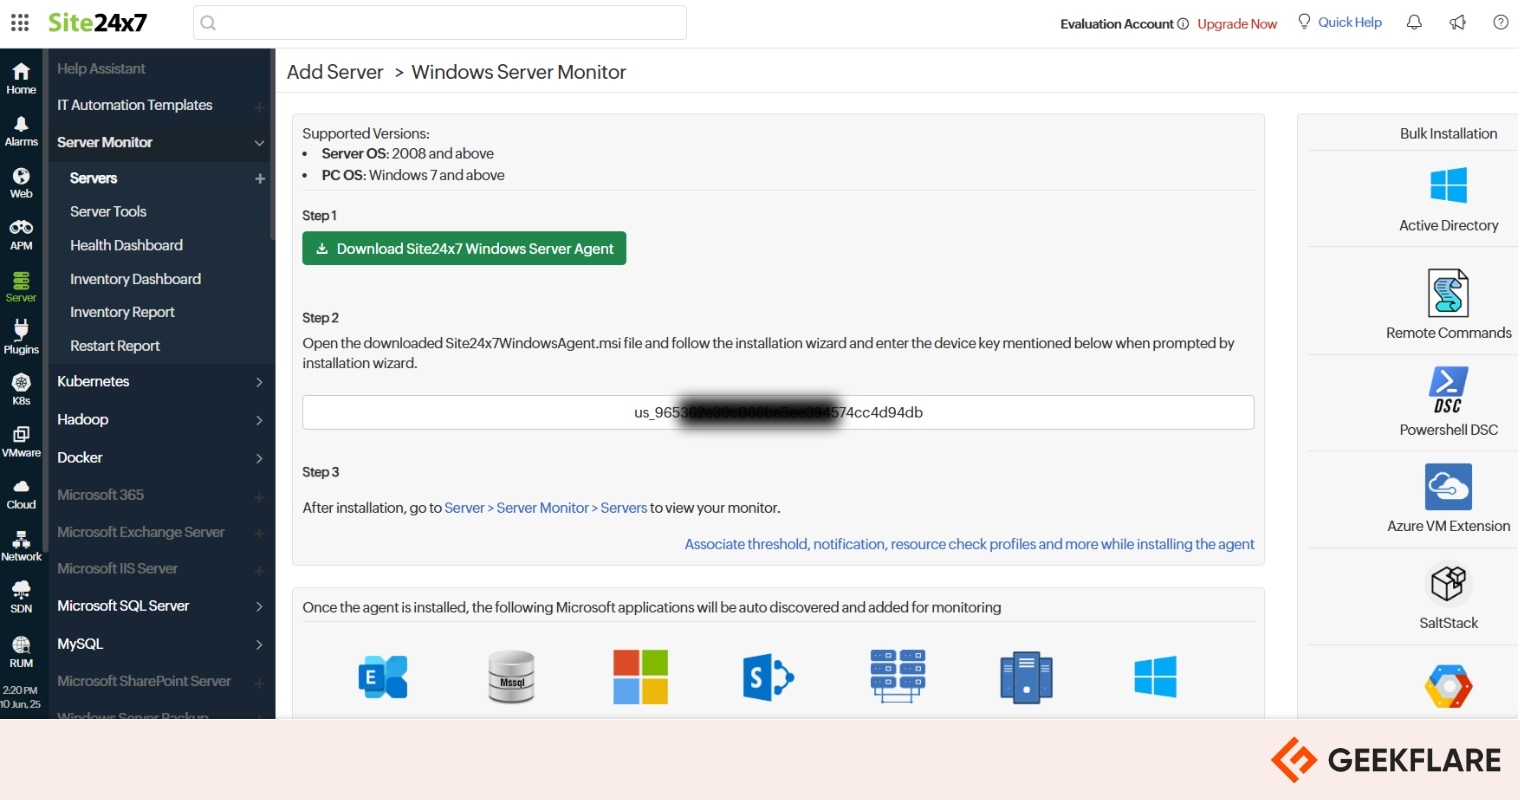
Site24x7 Network Monitoring is an all-in-one monitoring solution that covers networks, servers, applications, and websites, featuring a user-friendly interface.
Site24x7 Network Monitoring Key Features
- SNMP-based network monitoring
- Threshold-based alerting
- Integration with various cloud services
- Website defacement monitoring
- Comprehensive reporting and analytics
- Mobile app for on-the-go monitoring
Site24x7 Network Monitoring Use Cases
- Businesses requiring comprehensive monitoring across IT assets
- Organizations seeking cost-effective monitoring solutions
- IT teams need real-time alerts and mobile access
4. New Relic Infrastructure
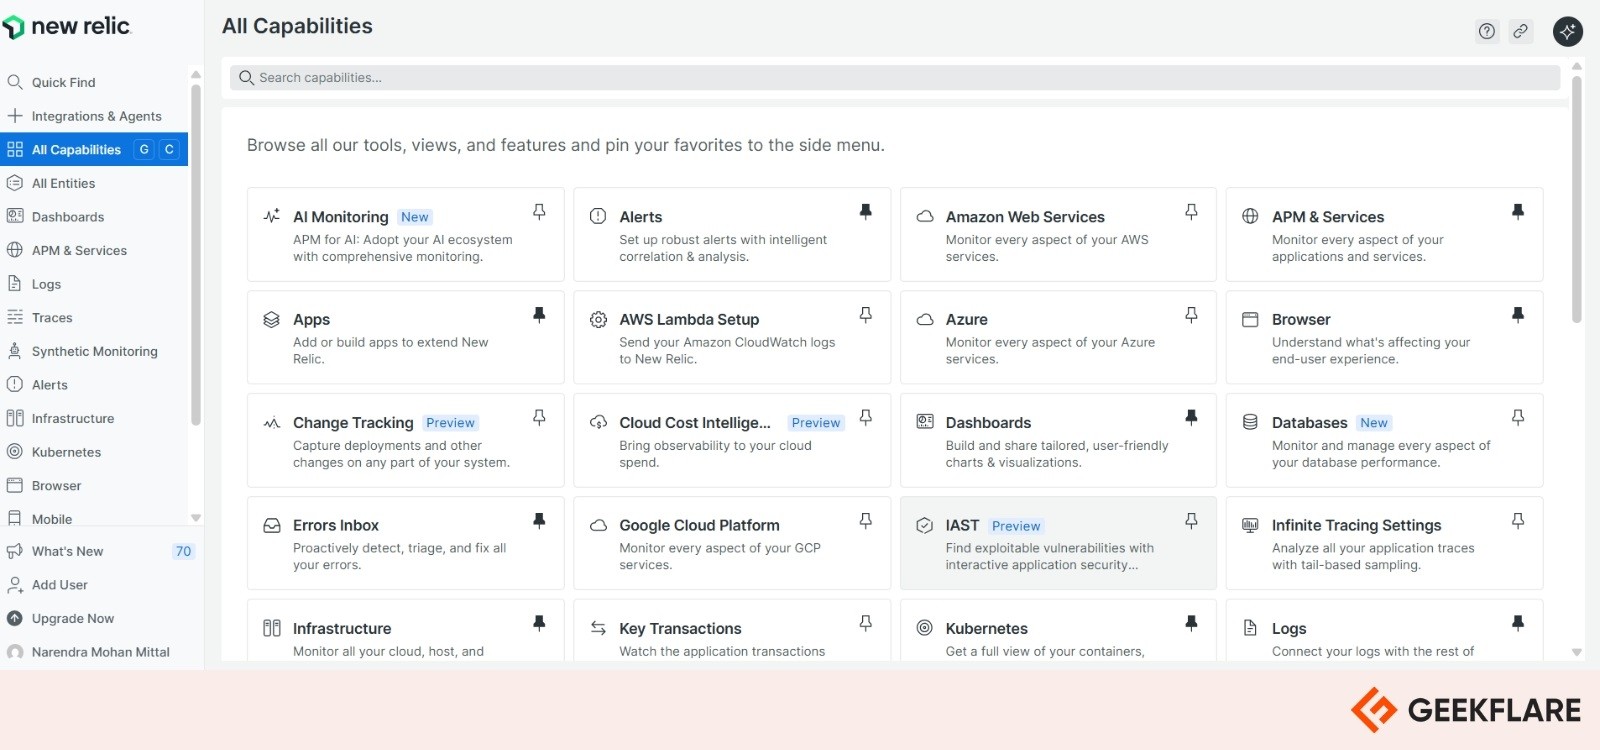
New Relic Infrastructure provides real-time monitoring for servers and cloud environments, integrating seamlessly with the broader New Relic observability platform.
New Relic Infrastructure Key Features
- Live system metrics and health indicators
- AI-powered anomaly detection
- 750+ integrations with popular tools and platforms
- Customizable dashboards and visualizations
- Infrastructure-as-code (IaC) compatibility
- Dynamic resource tagging and intelligent grouping
New Relic Infrastructure Use Cases
- Organizations adopting DevOps practices
- Businesses operating in cloud-native environments
- Teams requiring deep visibility into infrastructure performance
5. LogicMonitor
LogicMonitor provides unified monitoring across networks, servers, applications, and cloud services, with a focus on automation and scalability.
LogicMonitor Key Features
- Automatic device discovery and configuration
- AI-driven alerts and anomaly detection
- Support for multi-cloud environments
- Customizable dashboards and actionable reports
- Integration with ITSM tools
- Scalable architecture for growing infrastructures
LogicMonitor Use Cases
- Enterprises managing hybrid or multi-cloud deployments
- IT teams seeking automated monitoring solutions
- Organizations requiring integration with existing IT workflows
6. Zenoss
Zenoss is an AI-driven IT operations platform that provides real-time monitoring and analytics across hybrid IT environments.
Zenoss Key Features
- Service modeling and dependency mapping
- Event correlation and root cause analysis
- Hybrid infrastructure monitoring
- Predictive analytics for issue prevention
- Integration with various ITSM tools
- Customizable dashboards and reporting
Zenoss Use Cases
- Large enterprises with complex IT infrastructures
- Organizations aiming for proactive incident management
- IT teams requiring deep insights into service dependencies
Pandora FMS
Pandora FMS is a flexible monitoring solution that offers both SaaS and on-premise deployments, making it suitable for diverse IT environments.
Pandora FMS Key Features
- SNMP and WMI Integration
- Interactive dashboards and reporting
- Alert management and escalation workflows
- Application and server monitoring
- Customizable plugins and modules
- Multi-platform agent support
Pandora FMS Use Cases
- Organizations needing hybrid deployment flexibility
- Businesses seeking a customizable monitoring solution
- IT teams managing diverse operating systems and applications
Network Monitoring Suites (Enterprise-Grade)
These enterprise-grade platforms offer extensive network monitoring capabilities, which are best suited for medium to large enterprises with diverse environments, compliance needs, or multi-site operations. In such scenarios, SaaS solutions might not always offer the depth, control, and customization needed. These are typically deployed on-premise or in hybrid environments and offer powerful capabilities suited for complex environments.
“The global network monitoring market is projected to grow from USD 4.13 billion in 2025 to USD 8.24 billion by 2032, exhibiting a CAGR of 10.4% during the forecast period.”
Source: Fortune Business Insights
Network monitoring suites are designed to monitor large numbers of devices, interfaces, and flows, and are tailored for network engineers, infrastructure administrators, and NOC teams. The ability to correlate events across layers and pinpoint the root cause of failures is crucial in such large deployments.
These tools further provide advanced integrations with SIEM systems, configuration managers, ticketing platforms, and even AI/ML-based decision engines. Many of such tools support features to enhance security, compliance, and granular access control.
They also support legacy infrastructure, on-premises data centers, and proprietary protocols. Unlike many SaaS tools that prioritize modern stacks, enterprise-grade network monitoring suites can handle hybrid workloads, mainframes, VPNs, and complex topologies. They’re often modular, with license-based access to specialized add-ons.
For deeper insights, I would recommend exploring Geekflare’s packet capture and analysis tools, which pair well with these enterprise platforms.
Here’s a comparison of top enterprise network monitoring suites:
8. PRTG Network Monitor
PRTG Network Monitor by Paessler is a comprehensive monitoring solution that uses a sensor-based approach to provide real-time insights into network performance, ensuring optimal uptime and reliability.
PRTG Network Monitor Key Features
- Sensor-based architecture for customizable monitoring
- Automatic discovery and mapping of network devices
- Broad protocol support, including SNMP, WMI, NetFlow, and others
- Customizable dashboards with advanced reporting capabilities
- Flexible alerting with thresholds, notifications, and escalation options
- Mobile apps for real-time remote monitoring and alerts
PRTG Network Monitor Use Cases
- Organizations requiring detailed network component monitoring
- IT teams seeking customizable alerting and reporting
- Businesses requiring real-time insights into network health
9. SolarWinds Network Performance Monitor
SolarWinds Network Performance Monitor (NPM) is a scalable and robust network monitoring solution that provides deep visibility into network performance, facilitating rapid issue detection and resolution.
SolarWinds NPM Key Features
- NetPath for visualizing end-to-end network paths
- PerfStack for real-time performance analysis
- Intelligent, context-aware alerting system
- Wireless network monitoring and performance tracking
- Customizable dashboards and reports
- Integration with other SolarWinds tools
SolarWinds NPM Use Cases
- Enterprises needing complete network visibility
- IT teams focused on minimizing downtime
- Organizations seeking integrated IT management solutions
10. ManageEngine OpManager
OpManager by ManageEngine offers real-time network monitoring with a focus on ease of use and comprehensive coverage, suitable for networks of all sizes.
ManageEngine OpManager Key Features
- Real-time network and server monitoring
- Automated network discovery and topology mapping
- Customizable dashboards and widgets
- Advanced alerting and notification system
- Support for SNMP, WMI, and CLI protocols
- Integration with ITSM tools
ManageEngine OpManager Use Cases
- Small to medium businesses needing affordable monitoring solutions
- IT teams seeking quick deployment and ease of use
- Organizations requiring integration with helpdesk systems
11. OpenText Network Node Manager
OpenText Network Node Manager (NNMi) is an enterprise-grade network management solution that provides advanced fault, performance, and availability monitoring for large-scale networks.
OpenText NNMi Key Features
- Automated network discovery with dynamic topology mapping
- Root cause analysis and event correlation
- Scalable architecture for large networks
- Multi-protocol support, including SNMP, ICMP, and more
- Customizable dashboards with advanced reporting capabilities
- Integration with other OpenText ITOM solutions
OpenText NNMi Use Cases
- Telecommunications and service providers managing vast networks
- Enterprises requiring high availability and performance monitoring
- Organizations seeking integration with broader IT operations management
12. WhatsUp Gold
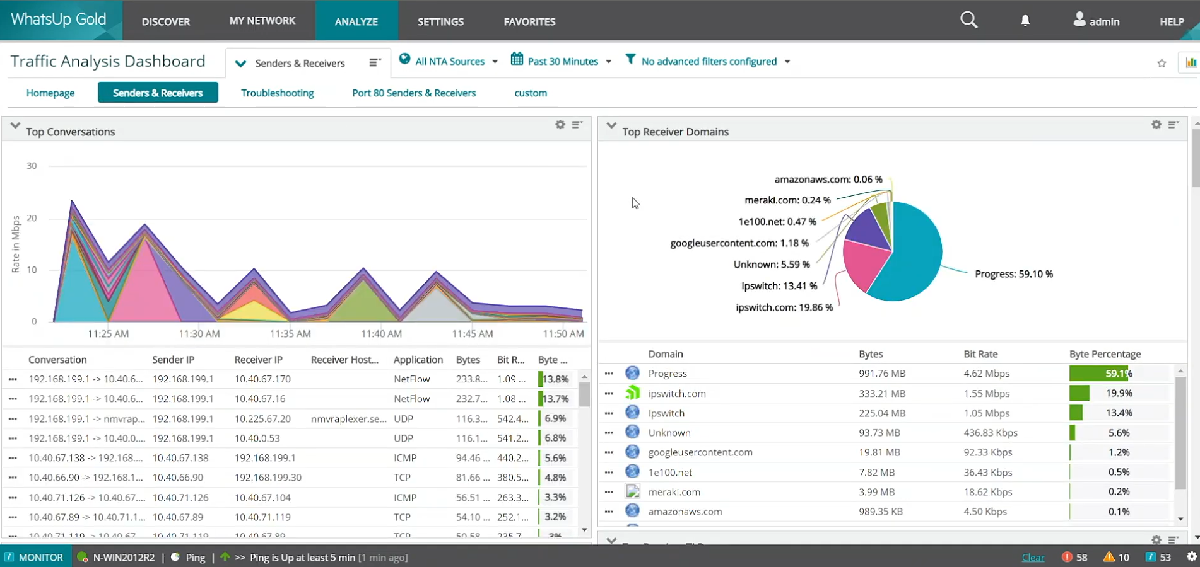
WhatsUp Gold by Progress Software is a versatile network monitoring tool that offers intuitive visualization and comprehensive monitoring capabilities for both on-premises and cloud environments.
WhatsUp Gold Key Features
- Interactive network mapping
- Real-time performance monitoring
- Customizable alerting and notifications
- Cloud resource monitoring (AWS, Azure)
- Application and server monitoring
- RESTful API for integrations
WhatsUp Gold Use Cases
- Organizations seeking user-friendly network visualization
- IT teams managing hybrid cloud environments
- Businesses requiring comprehensive infrastructure monitoring
13. ThousandEyes
ThousandEyes, a Cisco company, provides deep visibility into network performance, enabling organizations to monitor and troubleshoot issues across the internet, cloud, and enterprise networks.
ThousandEyes Key Features
- End-to-end network path visualization
- Cloud and SaaS application monitoring
- Global vantage points for external monitoring
- BGP route monitoring and analysis
- Real-time alerts and historical reporting
- Integration with Cisco networking products
ThousandEyes Use Cases
- Enterprises relying on cloud and SaaS applications
- Organizations need to monitor user experience across the internet
- IT teams aiming to quickly identify and resolve network issues
14. IBM SevOne
IBM SevOne Network Performance Management provides scalable and real-time monitoring of network performance, helping organizations to ensure optimal service delivery and user experience.
IBM SevOne Key Features
- High-frequency data collection and analysis
- Customizable dashboards and visualizations
- Automated anomaly detection
- Support for SNMP, NetFlow, and other protocols
- Integration with IBM’s AIOps solutions
- Scalable architecture for large enterprises
IBM SevOne Use Cases
- Large enterprises require detailed network performance insights
- Organizations aiming to integrate network monitoring with AI-driven operations
- IT teams seeking to proactively manage network health
15. Kentik
Kentik offers a network observability platform that combines real-time traffic analysis with performance monitoring, enabling organizations to optimize and secure their networks effectively.
Kentik Key Features
- Real-time network traffic analysis
- DDoS detection and mitigation
- BGP monitoring with advanced analytics
- Cloud and hybrid infrastructure visibility
- Customizable dashboards and detailed reports
- Easily integrate with existing tools and workflows via robust API support.
Kentik Use Cases
- Service providers and ISPs need detailed traffic insights
- Enterprises aiming to secure and optimize network performance
- Organizations requiring visibility into multi-cloud environments
16. Colasoft Capsa
Colasoft Capsa is a network analyzer that provides comprehensive packet-level analysis, helping organizations to troubleshoot and monitor network performance effectively.

Colasoft Capsa Key Features
- Real-time packet capture and deep analysis
- Decodes 300+ network protocols efficiently
- Network traffic and bandwidth analysis
- Customizable dashboards and insightful reports
- Alarms and alerts for network anomalies
- VoIP traffic monitoring and analysis support
Colasoft Capsa Use Cases
- Network admins are troubleshooting complex network issues
- Security teams analyzing suspicious network activity
- Organizations requiring in-depth protocol analysis
17. Opsview
Opsview is an enterprise IT infrastructure monitoring solution that provides unified visibility into hybrid environments, helping organizations to reduce complexity and improve service delivery.
Opsview Key Features
- Comprehensive monitoring of hybrid IT environments
- Business Service Monitoring for service-centric visibility
- Advanced alerting and smart notification system
- Integration with ITSM tools like ServiceNow
- Customizable dashboards and reporting
- Supports 4,700+ plugins and third-party integrations
Opsview Use Cases
- Enterprises managing complex hybrid IT infrastructures
- IT teams aligning monitoring with business services
- Organizations reducing alert fatigue, improving incident response
Open Source & Free Network Monitoring Tools (Cost-Effective)
Open-source tools offer your teams unparalleled flexibility and community support. If your team is comfortable with hands-on system management, open-source network monitoring tools offer cost-effectiveness and better customization potential over other categories. These solutions are widely used by budget-conscious IT departments, educational institutions, startups, and tech enthusiasts.
Open-source monitoring tools typically provide a core framework with essential monitoring features. With their modular nature and community ecosystems, it is easier to extend them with plugins, templates, and integrations, but they often require more technical skill to deploy and maintain compared to commercial products.
One of the strongest advantages is vendor independence by not locking your monitoring capabilities into a pricing model or being forced to renew licenses. Most such tools support SNMP, NetFlow, ICMP, and custom scripts, enabling robust device and traffic monitoring across diverse network environments.
These platforms are also ideal for experimental and educational use. You can learn about real-world monitoring practices, security setups, and system administration while customizing the system to your exact needs.
Here are some of the most trusted open-source and free network monitoring tools:
18. Zabbix
Zabbix is an enterprise-grade open-source monitoring solution designed for real-time monitoring of millions of metrics collected from tens of thousands of servers, virtual machines, and network devices.
Zabbix Key Features
- Support for SNMP, IPMI, JMX, and VMware monitoring
- Flexible thresholds and intelligent problem detection
- Highly configurable alerting with escalation and remote commands
- Real-time graphs and rich visualization features
- Automatic network and device discovery
- Secure user authentication and permissions system
Zabbix Use Cases
- Monitoring large-scale, complex IT infrastructures
- Automating issue detection and resolution
- API integration with third-party applications
19. ntopng
ntopng is a high-speed web-based traffic analysis and flow collection tool that provides 360° network visibility, enabling users to monitor network traffic in real-time and perform historical analysis.
ntopng Key Features
- Sort traffic by IP, port, Layer-7 protocols, and throughput
- Real-time traffic monitoring with active host identification
- Generate long-term reports on throughput and protocol metrics
- Analyze top talkers by sender, receiver, and application protocol
- Monitor live throughput, latency, RTT, TCP stats, and packets
- Store traffic statistics persistently for in-depth future analysis
ntopng Use Cases
- Analyzing network traffic patterns and identifying bottlenecks
- Monitoring application usage and performance
- Performing historical traffic analysis for capacity planning
20. OpenNMS Meridian
OpenNMS Meridian is a highly scalable open-source network management platform that offers comprehensive fault, performance, and traffic monitoring, tailored for enterprise environments.
OpenNMS Meridian Key Features
- Automated discovery and provisioning of network devices
- Scalable architecture suitable for large networks
- Support for SNMP, WMI, and other protocols
- Customizable dashboards and reporting capabilities
- Event management and correlation for efficient issue detection
- Integration with third-party applications and services
OpenNMS Meridian Use Cases
- Monitoring large-scale enterprise networks
- Automating network device discovery and management
- Integrating with existing IT management systems
21. Nagios Network Analyzer
Nagios Network Analyzer is a network traffic analysis and bandwidth monitoring solution that provides organizations with extended insight into their IT infrastructure, enabling proactive problem resolution.
Nagios Network Analyzer Key Features
- Security Alerts for suspicious or unusual network activity
- Advanced visualizations for in-depth insights into network traffic and health
- Comprehensive dashboards offering high-level overviews of network sources
- Custom application monitoring with individualized queries and reports
- Specialized views for tracking specific subsets of network flow information
- Automated alert system for abnormal activity and bandwidth thresholds
Nagios Network Analyzer Use Cases
- Monitoring network bandwidth usage and trends
- Detecting and alerting on suspicious network activities
- Generating reports for network usage analysis
22. Cacti
Cacti is a complete network graphing solution designed to harness the power of RRDTool’s data storage and graphing functionality, providing an intuitive interface for managing network data.
Cacti Key Features
- Data collection via SNMP and scripts
- Graphing of network bandwidth utilization
- User management with access control
- Template-based configuration for devices and graphs
- Support for plugins to extend functionality
- Scheduled data collection and graph generation
Cacti Use Cases
- Visualizing network performance over time
- Monitoring bandwidth usage across devices
- Generating reports for capacity planning
23. Icinga
Icinga is an open-source monitoring system that checks the availability of network resources, notifies users of outages, and generates performance data for reporting.
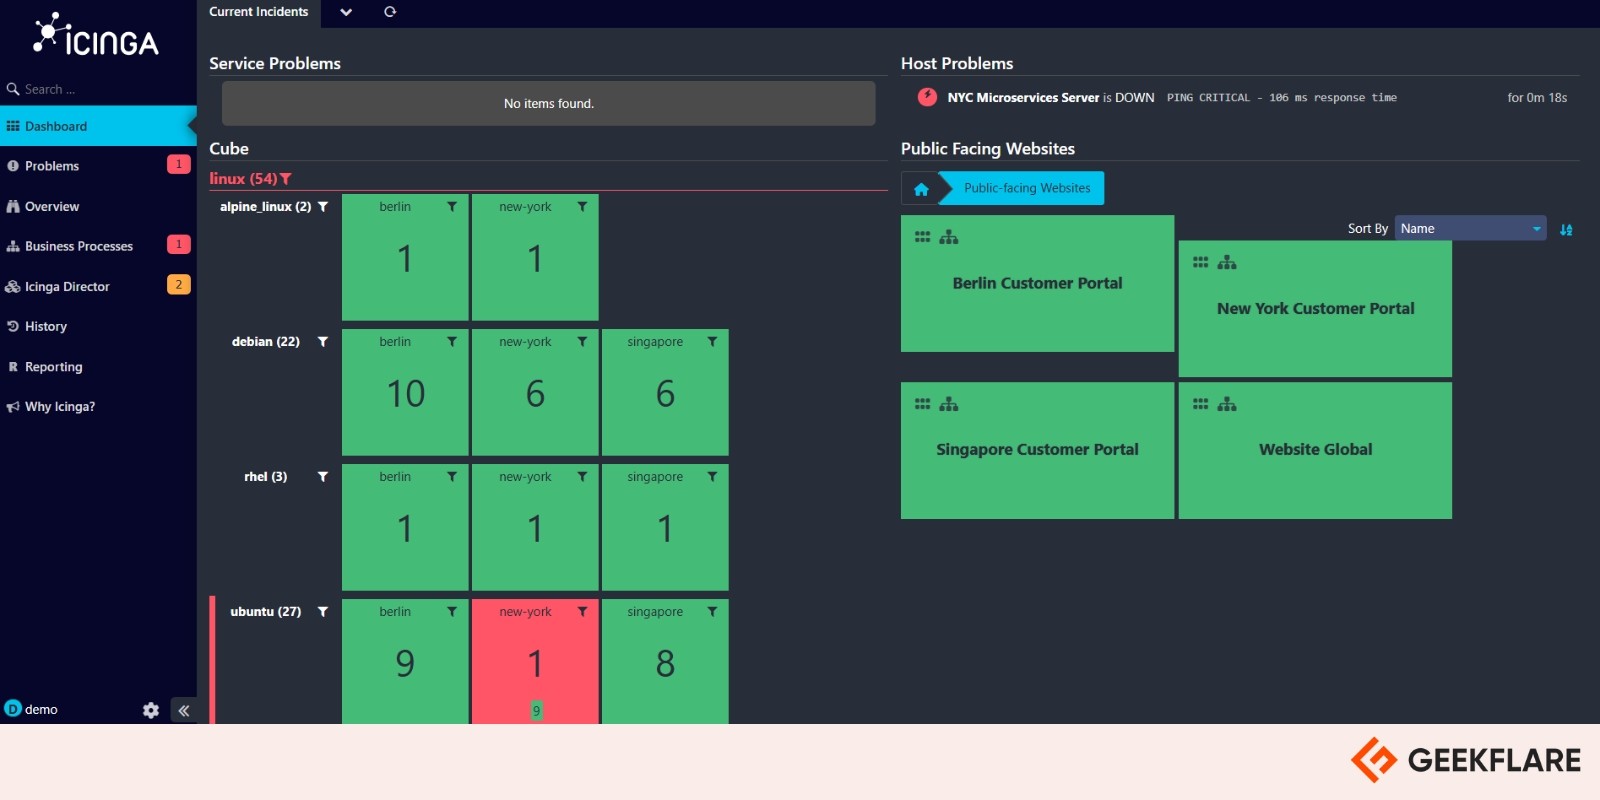
Icinga Key Features
- Scalable and extensible architecture
- Support for monitoring networks, servers, cloud, and containers
- Advanced alerting mechanisms with notifications via email, SMS, etc.
- Comprehensive reporting capabilities
- Integration with tools like Grafana and Puppet
- Multi-platform support including Windows, Linux, and Unix
Icinga Use Cases
- Monitoring hybrid IT environments
- Integrating monitoring with configuration management tools
- Generating detailed performance reports
24. LibreNMS
LibreNMS is a fully-featured network monitoring system that provides a wealth of features and device support, making it a robust solution for network visibility and management.
LibreNMS Key Features
- Automatic network discovery using various protocols
- Customizable alerting system with notifications via multiple channels
- Full API access for data management and retrieval
- Bandwidth-based billing with usage tracking
- Distributed polling architecture for horizontal scalability
- Mobile-friendly web UI and native mobile apps
LibreNMS Use Cases
- Monitoring diverse network devices and services
- Implementing bandwidth billing for clients
- Scaling monitoring infrastructure horizontally
Conclusion
Choosing the right network monitoring tool depends on your scale, technical expertise, budget, and infrastructure complexity.
- For quick deployments, go with a SaaS solution.
- For deep integrations and granular control, enterprise suites are ideal.
- If you prefer customization or are on a tight budget, open-source tools are the way to go.
Investing in the right monitoring solution now ensures your systems remain healthy, secure, and performant as your organization scales.
What’s Next
-
 EditorNarendra Mohan Mittal is a senior editor & writer at Geekflare. He is an experienced content manager with extensive experience in digital branding strategies.


