Google Analytics is a free web analytics tool that tracks and reports website traffic, real-time and past performance. It provides valuable insights into user behavior, conversion rates, demographics, and website performance. GA is popular, but its inflexibility, lack of features, and privacy concerns have led users to search for alternative options.
Geekflare has researched and listed the best Google Analytics alternatives based on key features, such as live website traffic monitoring, user segmentation, conversion tracking, and custom reporting.
- 1. Fathom Analytics – Best for Privacy-focused
- 2. Clicky – Best for Real-Time Visitor Insights
- 3. Plausible – Best for Cookieless Analytics
- 4. Cloudflare Web Analytics – Best for Cloudflare Users
- 5. Microsoft Clarity – Best for User Behavior Insights
- 6. Matomo – Best for Complete Data Ownership
- 7. Simple Analytics – Best for GDPR, PECR, and CCPA Compliance
- 8. Mixpanel – Best for Product and User Engagement
- 9. Piwik PRO – Best for Enterprise-Level Data Privacy
- 10. Heap – Best for Automatic Event Tracking
- 11. Adobe Analytics – Best for Advanced Marketing
- 12. GoSquared – Best for Customer Data Hub
- 13. Smartlook – Best for Qualitative Analytics
- 14. PostHog – Best for Product Team
- 15. Woopra – Best for Understanding Customer Journey
- 16. Realtime – Best for Live Traffic Monitoring
- 17. Gauges – Best for Ease of Use
- 18. Cronitor (formerly Panelbear) – Best for Developers
- 19. SealMetrics – Best for Paid Ads
- 20. Usermaven – AI-Powered Insights
- 21. Pirsch – Privacy-friendly Analytics
- 22. TinyAnalytics – Hosted in the UK
- Show less
You can trust Geekflare
At Geekflare, trust and transparency are paramount. Our team of experts, with over 185 years of combined experience in business and technology, tests and reviews software, ensuring our ratings and awards are unbiased and reliable. Learn how we test.
1. Fathom Analytics
Best for Privacy-focused
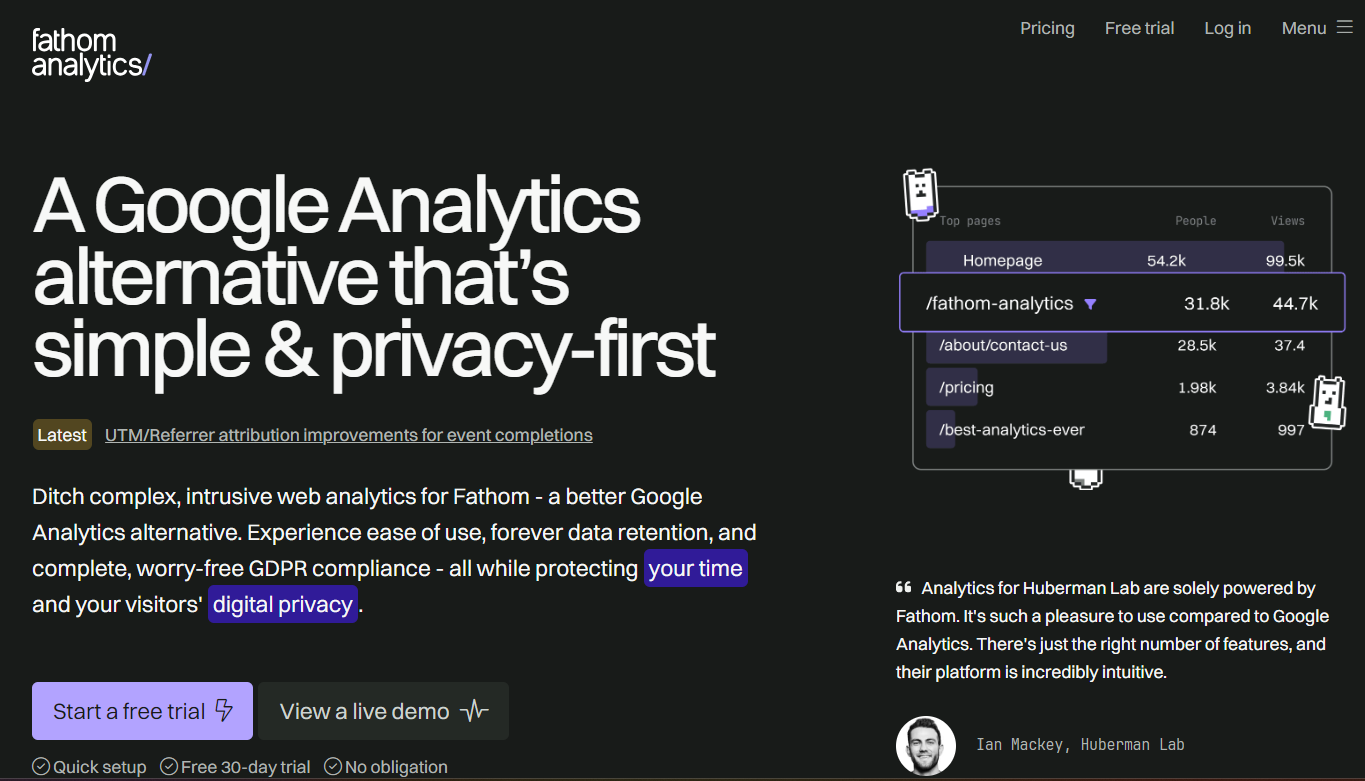
Fathom Analytics is a privacy-focused, real-time website traffic analytics software trusted by data-heavy organizations like IBM, McLaren, and GitHub. It routes its traffic through European-owned infrastructure.
Unlike Google’s offering, Fathom Analytics uses one-line lightweight JavaScript that doesn’t slow down webpage loading time. It automatically blocks bots, crawlers, DDoS attacks, and company-specific IP addresses to reflect accurate numbers.
Besides, you get a customizable dashboard with live web traffic metrics like visitors, views, time on site, and bounce rate. It includes advanced filters, user segments, geolocations, UTMs, and other options for detailed analysis.
Fathom Analytics lets you track form submissions, newsletter sign-ups, button clicks, and e-commerce transactions through custom events and UTM parameters. It provides one-click data export to a CSV file for further analysis and allows scheduling email reports for trend analysis and reporting.
Fathom Analytics Pros
Full compliance with privacy policy laws
Unlimited historical data retention
Pre-built GA4 importer for easy data transfer
Fathom Analytics Cons
No free version is available
Limited third-party integrations
Fathom Analytics Pricing
The pricing for Fathom Analytics starts at $15/month and includes event tracking, API access, and unlimited reporting and data retention.
👀Note: Fathom provides a tiered pricing model; the pricing increases as your monthly data points increase.
2. Clicky
Best for Real-Time Visitor Insights
Clicky is an open-source live website traffic monitoring tool. Its state-of-the-art Spy feature lets you view a live stream of website visitors – without needing to refresh at regular intervals.
The tool offers an intuitive dashboard indicating visitor numbers, total clicks, event conversion rates, organic searches, bounce rates, and everything that you’ll see in GA4. You can also categorize visitors based on demographics, geolocation, device used, and other criteria for targeted analysis.
Some essential features that set Clicky ahead of Universal Analytics are heatmaps, split tests, video analytics, audio analytics, and detailed path analysis.
Clicky provides conversion tracking metrics to monitor event-based conversions, outbound links, and downloads. To ensure accurate tracking for visitors with ad-blockers enabled, it offers reverse proxy tracking. Additionally, its big screen mode displays real-time stats in an optimized format for large screens, making it easy to keep an eye on your favorite metrics.
Clicky Pros
Free-to-use (open-source)
Built-in video analytics
Promotes social listening via Twitter analytics
Clicky Cons
Poor UI/UX design
Limited integration options
Clicky Pricing
| Plans | Key Features | Pricing |
|---|---|---|
| Free | Real-time data, basic segmentation, customizable dashboard | Free |
| Pro | On-site analytics, data export, multiple dashboards, API access | $9.99/month |
| Pro Plus | Advanced filtering and segmentation, split testing, heatmaps | $14.99/month |
| Pro Platinum | Custom data tracking, big screen mode, video analytics, uptime monitoring | $19.99/month |
| Custom | Path analysis, goal and revenue tracking, longer data retention | Custom Pricing |
3. Plausible
Best for Cookieless Analytics
Plausible is another privacy-friendly alternative to Google Analytics for visualizing live website traffic. It does not use cookies or engage in behavior profiling and ensures complete compliance with privacy regulations like GDPR, CCPA, and PECR.
Plausible Analytics’ dashboard provides real-time visitor insights and segments them based on demographics, geolocations, and the device, browser, or operating system used.
Using customizable UTM tags and conversion funnels, you can track paid ads, emails, and social media posts for custom events, conversions, and attributions.
Plausible Analytics offers email and Slack reporting on traffic spikes, time-sensitive goals, outbound link clicks, file downloads, and 404 error pages.
Plausible Pros
Complete transparency on the source code
Supports real-time team collaboration
Lightweight and cookieless analytics
Plausible Cons
Costly to scale
Limited insights compared to other analytical tools
Plausible Analytics Pricing
| Plans | Key Features | Pricing |
|---|---|---|
| Growth | Data retention, intuitive dashboard, Slack reports, Google Analytics migration, and custom events | $9/month |
| Business | Custom Properties, e-commerce revenue attribution, priority support, stats API | $19/month |
| Enterprise | Technical onboarding, site API access for reselling, technical onboarding | Custom Pricing |
4. Cloudflare Web Analytics
Best for Cloudflare Users
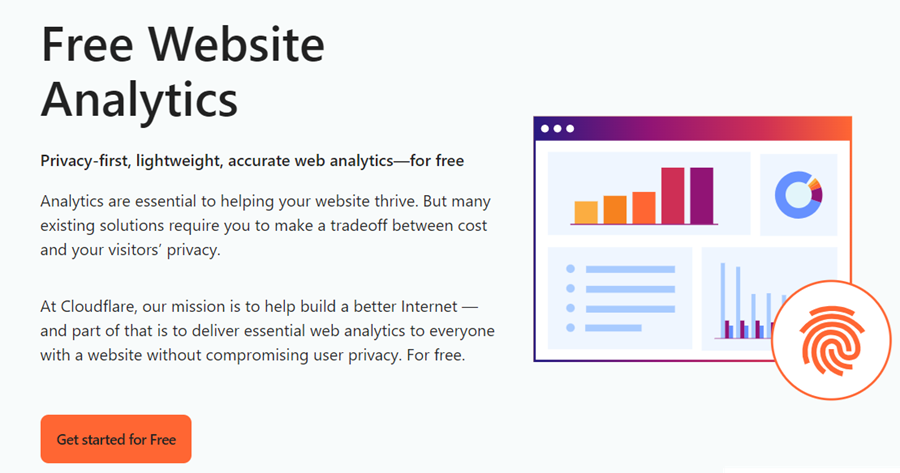
Cloudflare Web Analytics is a free web analytics software offered as part of the Cloudflare content delivery network (CDN) and cloud security platform. It’s best for Cloudflare users seeking a cost-effective web analytics solution within the Cloudflare network.
Cloudflare’s Adaptive Bit Rate (ABR) servers help auto-optimize resolution for each chart or table depending on the data size and other factors. Interactive visualizations allow you to investigate spikes in traffic by zooming into charts and graphs.
While Cloudflare Web Analytics falls short in user segmentation and conversion tracking features compared to GA4, it delivers detailed metrics and KPIs for gaining actionable insights into conversions.
Cloudflare provides custom reporting features through its GraphQL Analytics API, allowing you to build sophisticated analytics dashboards for tailored reporting based on your business needs.
Cloudflare Web Analytics Pros
Well-integrated with Cloudflare network
Reliable customer support
Attractive data visualization through ABR servers
Cloudflare Web Analytics Cons
Lacks advanced segmentation and tracking features
Lacks in-app reporting
Cloudflare Pricing
| Plans | Key Features | Pricing |
|---|---|---|
| Free | Static content caching, web sockets, comment spam protection, bot detection | Free |
| Pro | TCP turbo, image resizing, DDoS alerts, page shield | $20/month |
| Business | Cache bypass on cookie, CNAME setup, security analytics, custom SSL | $200/month |
| Enterprise | Custom cache keys, prefetching URLs, SSO support, AMPs | Custom Pricing |
5. Microsoft Clarity
Best for User Behavior Insights
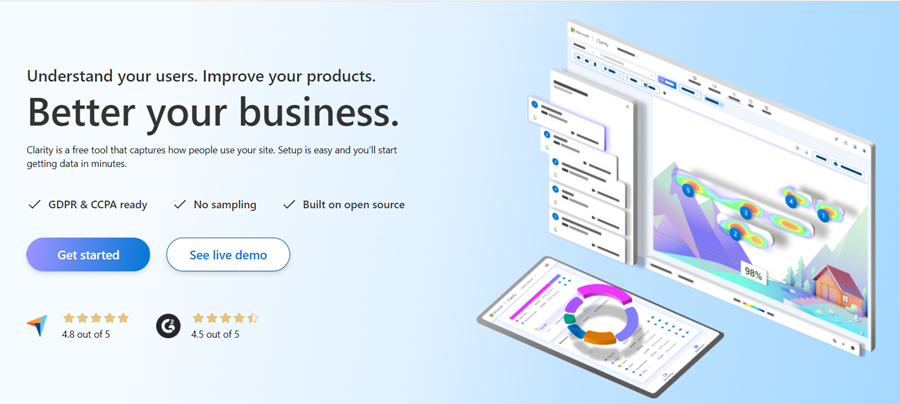
Microsoft Clarity is a free user behavior analysis tool that provides real-time insights into how users interact with your website and mobile app.
Microsoft Clarity allows you to record, view, and share live user sessions as they happen, showing user movements, clicks, scrolls, and navigation through the website or app in real time.
With Microsoft Clarity’s Google extension, you can overlay heatmaps on your live site and watch where people click, what they ignore, and how far they scroll.
Microsoft Clarity’s intuitive dashboard presents bite-sized insights that are expandable using 25+ parameters, including user information, actions, path, and session data. It offers customizable dashboards with custom conversion goals and metrics, such as rage clicks, dead clicks, and kickbacks, to track user behavior around specific events.
Microsoft Clarity integrates with third-party analytics, testing, and automation tools, enabling you to distribute data or perform actions without leaving clarity.
Microsoft Clarity Pros
Analytics for website and mobile app
Integrated AI assistant
Live session recording with auto heatmaps
Rich segmentation with 25+ filters
Microsoft Clarity Cons
Users find inaccuracies in data collection
No option to exclude specific data points from the heatmap analysis
Microsoft Clarity Pricing
Microsoft Clarity is free to use and offers unlimited traffic analysis, heat maps, and session recordings.
6. Matomo
Best for Complete Data Ownership
Matomo is an open-source web analytics software that offers 100% data ownership and full regulatory compliance. It’s trusted by 1 million users, including organizations like the United Nations and EU Commission and brands like Ahrefs.
Matomo integrates traditional web analytics (such as visits and acquisition data) with behavioral analytics (like heatmaps and session recordings). It offers the ability to segment users by geolocation, demographics, purchase orders, and over 110 preset filters. Users can also create custom segments using AND and OR operators.
Matomo uses goal tracking to track event-focused conversions, such as a purchase or a newsletter sign-up, and offers heatmaps and session recording to track user behavior across events.
Matomo lets you create custom reports using conditional filters, pivoting, and dynamic visualizations. Moreover, it allows you to add custom-created visualizations as widgets to your dashboard.
Matomo Pros
Provides real-time data tracking and reporting
Multi-lingual language support (50+ languages)
Offers greater data privacy and control
Matomo Cons
You can only use MySQL for backend data storage
May require technical knowledge to fully optimize and utilize all features
Matomo Pricing
| Plans | Key Features | Pricing |
|---|---|---|
| On-Premise | GDPR Manager, API access, SQL raw data access, custom Domain, LADP integration | Free |
| Cloud | Funnels, user flow, A/B testing, roll-up reporting, activity log, media analytics, custom reports | $19/month |
7. Simple Analytics
Best for GDPR, PECR, and CCPA Compliance
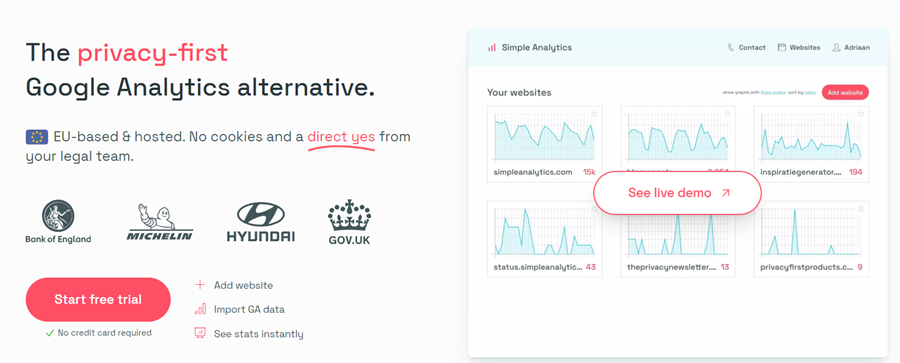
Simple Analytics is among the leading privacy-oriented alternatives to Google Analytics. The product is easy to use, lightweight, and compliant with user privacy laws, including GDPR, PECR, and CCPA.
Simple Analytics’ intuitive dashboard provides real-time insights into user behavior and website performance. Using advanced segmentation, you can perform behavioral analysis on specific user groups, such as new vs. returning visitors, by attributes like location, device, and referral source.
Using Simple Analytics AI, you can ask questions about your data in natural language and get instant insights.
Simple Analytics uses a goals tracker and events explorer to correlate, monitor, and analyze marketing campaigns, sales funnels, and other conversion-focused initiatives.
Unlike Google Analytics, the product lets you create and schedule email reports on a one-off or recurring basis without leaving the app.
Simple Analytics Pros
Integrated AI assistant
No cookie banners
Fully responsive mobile app
Simple Analytics Cons
Lacks conversion tracking in the free version
Poor customer support
Simple Analytics Pricing
| Plans | Key Features | Pricing |
|---|---|---|
| Free | Unlimited page views/events, community support, public dashboard | Free Forever |
| Simple | Goals dashboard, automated event tracking, metadata analysis, Trendlines, email support | $10/month |
| Team | Admin API, Export API, Invoices via email, custom views, data proxy, AI chat, IP range blocking | $40/month |
| Enterprise | Separate data storage, contract redlining, uptime SLA, video support, legal support | Custom Pricing |
8. Mixpanel
Best for Product and User Engagement
Mixpanel is a powerful analytics software for analyzing product and user engagement. It has helped product teams at Uber, Netflix, and monday.com build faster, better products through data-driven decisions.
Mixpanel’s real-time dashboard offers comprehensive engagement metrics to uncover trends and provide immediate insights into user interactions with your product.
Using behavioral segmentation, you can group users based on specific traits, events, or geographic levels. Mixpanel integrates with third-party apps like A/B Tasty, Vitally, Zapier, and more, making it easy to analyze individual user segments.
It also offers conversion funnels, retention graphs, and flow reports to track conversions having one or multiple touchpoints. Similarly, you’ll find a gallery of reporting templates, which you can add as widgets to your dashboards or download as PDF reports.
While you can still track pageviews with Mixpanel, it’s best used for tracking product and user engagement.
Mixpanel Pros
Fast and intuitive data visualizations
Comes with a versioning history
Excellent customer support
Mixpanel Cons
Difficult to set up and configure
Steeper learning curve for beginners
Mixpanel Pricing
| Plans | Key Features | Pricing |
|---|---|---|
| Free | Templates, cart analysis, custom events, campaign reporting, Slack community | Free Forever |
| Growth | Platform and query API access, report-level roles and permissions, custom properties | $28/month |
| Enterprise | Data warehouse ingestion, anomaly detection, experiment reporting, cross-product analytics, dedicated accounts manager | Custom Pricing |
9. Piwik PRO
Best for Enterprise-Level Data Privacy
Piwik PRO stands out for its enterprise-level data privacy and autonomous compliance with privacy policy laws, such as GDPR in the EU, LGPD in Brazil, and CCPA in the US. It offers real-time user behavior tracking, segmentation, and reporting around your web and app.
Using the Piwik PRO analytics dashboard, you can monitor user activity, engagement, and multi-channel attribution to optimize the customer journey.
Piwik PRO Analytics suite provides webhooks and built-in app integrations to collect and segment visitor data across channels, websites, and apps into unified customer profiles.
You can create personalized user profiles based on attributes and conditions, such as demographics, user characteristics, behavior, buying history, and other behavioral data.
The Piwik PRO drag-and-drop editor enables users to create custom reports for multi-channel attribution, ads, and conversion funnels. It also has the capability for roll-up reporting to view data from multiple websites in one report.

Piwik PRO Pros
Has advanced user management
Multi-lingual support
Offers e-commerce conversion and revenue tracking
Piwik PRO Cons
Unintuitive, complex user interface
Has a relatively low data retention policy
Piwik PRO Pricing
| Plans | Key Features | Pricing |
|---|---|---|
| Core Plan | Analytics, consent management, DPA, password policy, community support, Google search console, test and debug mode | Free |
| Enterprise Plan | Private cloud, unlimited websites, audience insights, tag manager, webhooks, dedicated technical support, and onboarding | Custom Pricing |
10. Heap
Best for Automatic Event Tracking
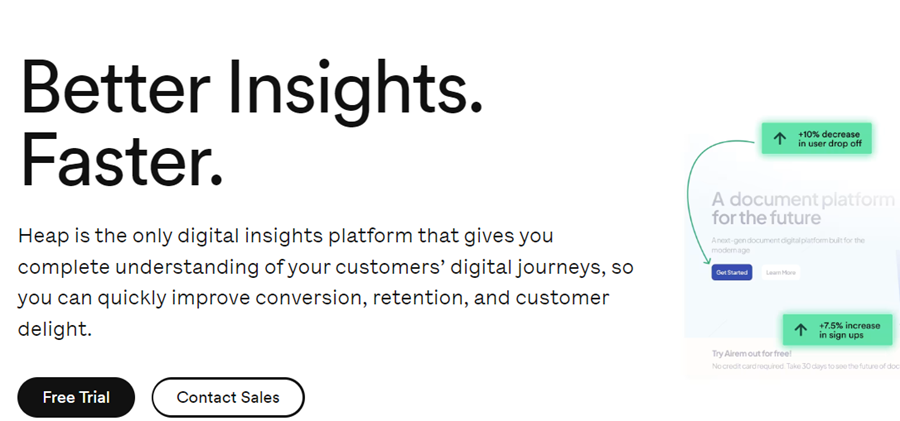
Heap is among the most comprehensive alternatives to Google Analytics. Its data collection toolkit lets you capture every view, click, swipe, session replay, and form filled by users on your website or app.
Heap’s Illuminate, a data science intelligence framework, analyzes user data to automatically surface key insights even about actions and behaviors you haven’t considered before.
Heap uses behavior segmentation to group users based on actions and movements across your website. It integrates with major A/B testing platforms like Optimizely and marketing suites like Marketo, allowing you to test different user segments on the fly.
Whether you’re in e-commerce or tech, Heap offers ready-made dashboard templates tailored for industries and purposes, with preset events and metrics that matter to you.
Heap Pros
Offers live data feed promoting retroactive analysis
Real-time reporting and flexibility to customize charts
Automatically captures and tracks events
Has well-numbered integrations
Heap Cons
May struggle to handle vast data sets
Steep learning curve for non-tech users
Heap Pricing
| Plans | Key Features | Pricing |
|---|---|---|
| Free | Core analytics charts, funnels, event auto-capture, customizable dashboards | Free |
| Growth | Unlimted users and reports, chart customizations, email support, Heap community membership, SSO | Custom |
| Pro | Account analytics, engagement matrix, report alerts, optional add-ons, standard support | Custom |
| Premier | Audit logs, SCIM, shared spaces, custom user permissions, premium support | Custom |
11. Adobe Analytics
Best for Advanced Marketing
Adobe Analytics provides advanced marketing analytics that focuses on customer acquisition and retention, ROI, and ad campaign performance metrics.
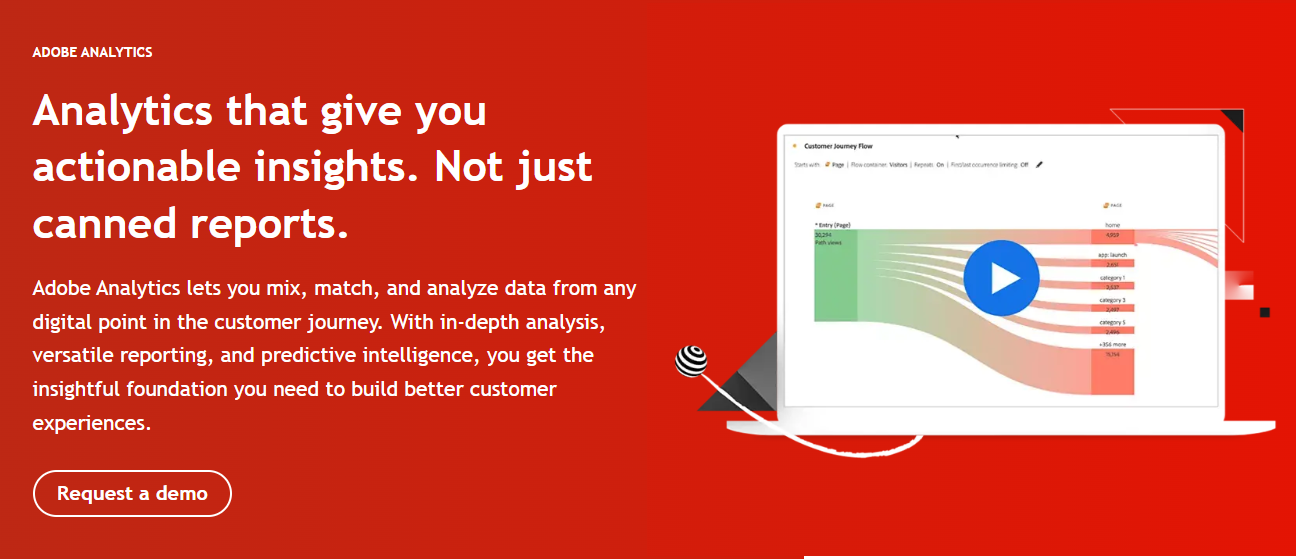
Adobe’s Live Stream feature allows data access in near real-time (30 to 90 seconds). Its cross-device analytics help unify web and app data into a single dashboard, allowing for a better understanding of customer journeys.
Adobe Analytics offers automated tools for analyzing user behavior and delivering insights, patterns, and trends. It includes tools for ad hoc analysis, cohorts, retroactive analytics, and predictive analysis to help forecast behavioral trends like customer churn and conversion likelihood.
Adobe Analytics uses AI to group, segment, and visualize audiences based on behavior. With robust marketing attributions from paid, owned, and earned media, it’s easy to analyze what’s driving leads and revenues and invest accordingly.
Adobe Analytics Pros
Has a user-friendly, drag-and-drop interface
Ability to create custom metrics
Comes with an integrated AI assistant
Adobe Analytics Cons
Lacks technical support
No real-time data refreshes
Adobe Analytics Pricing
| Plans | Key Features | Pricing |
|---|---|---|
| Select | Analysis workspace, ad hoc analysis, voice assistant, privacy controls, cohort analysis, histograms | Custom |
| Prime | Intelligent alerts, anomaly detection, segment comparison, usage reporting | Custom |
| Ultimate | Quick insights, cross-device analysis, field based identity stitching, data repair API, algorithmic attribution | Custom |
12. GoSquared
Best for Customer Data Hub
GoSquared is among the leading privacy-focused alternatives to Google Analytics. Its award-winning, customizable dashboards are a customer data hub for businesses like J.P. Morgan, Dell, Canon, and more.
GoSquared Analytics offers a real-time dashboard with features like smart predictions, annotations, content analysis, instant comparisons, and conversion tracking. It uses retroactive analytics that auto-segment incoming data based on visitor location, channel, browser, or device.
Using webhooks and native Zapier integration, you can trigger custom workflows across 1000+ without leaving the GoSquared dashboard. You can send alerts to Slack, schedule email reports, or display your dashboard alongside Klipfolio and Geckoboard.
GoSquared Pros
Easy to set up and use
Offers advanced analytics features
An extensive range of integrations
Unlimited data retention
GoSquared Cons
Has no free version
The dashboard feels cluttered due to overloaded insights and metrics
GoSquared Pricing
| Plans | Key Features | Pricing |
|---|---|---|
| Starter | Unlimited data retention, email support, language detection | $9/month |
| Standard | Retroactive analytics, smart predictions, instant comparisons, event tracking, UTM campaign tracking | $24/month |
| Pro | Strong privacy controls, email reports, smart bounce rate, single-click data export | $49/month |
| Scale | Email reports, UTM campaign tracking, event tracking, email support, GDPR compliant | $99/month |
13. Smartlook
Best for Qualitative Analytics
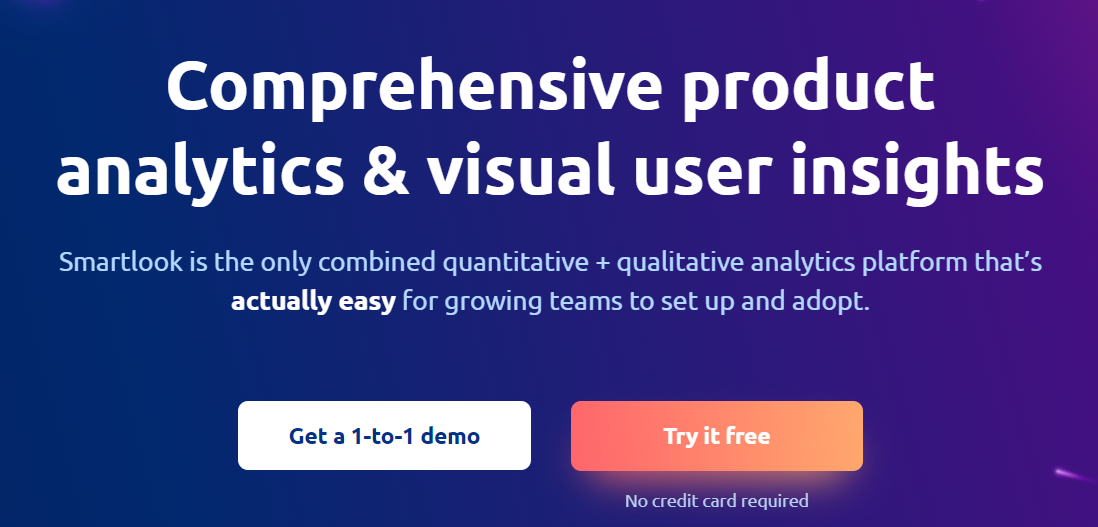
Smartlook offers a unique combination of qualitative and quantitative analytics tools, including session recordings, heatmaps, events, funnels, crash reports, and more.
Smartlook’s intuitive dashboard and retroactive analytics help identify and address time-sensitive bugs or issues as they happen.
Live session recording allows you to track user interactions and drop-offs from beginning to end, with full context and user details like location, last activity, etc.
Smartlook uses event statistics tools such as heat maps, funnels, and behavioral flows so that you can track URL visits, text and button clicks, and more.
Smartlook crash reporting for iOS and Android apps lets you see exactly where a collision occurred, including which user interaction preceded it.
Smartlook Pros
Supports both web and mobile app
Access to premium integrations
DevTools and product analytics add-ons
Has custom reporting options
Smartlook Cons
Users encounter occasional bugs in session recordings and funnel reports
The free plan has limited recording room
Smartlook Pricing
| Plans | Key Features | Pricing |
|---|---|---|
| Free | Historical data in heatmaps, Integration with Slack, basic product analytics, one-month data retention | Free |
| Pro | Daily anomaly reporting, exports to CSV, session API, product analytics add-ons, always-on recording, dev tools | $55/month |
| Enterprise | Unlimited users and projects, dedicated customer success, Single Sign-On, frame rate configuration, all premium integrations | Custom Pricing |
14. PostHog
Best for Product Team
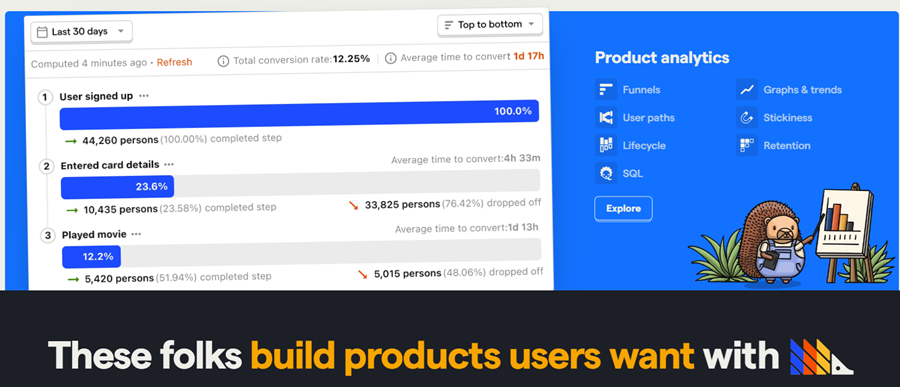
PostHog is an innovative product analytics platform designed to analyze user behavior and optimize product experiences. It’s ideal for users looking for product-centric alternatives to Google Analytics.
PostHog can visualize any sequence of page views, screen views, or events with up to 20 steps. It offers insights into how users navigate your product using conversion funnels, user paths, trend charts, retention graphs, and more.
PostHog’s real-time dashboard allows users to filter data and customize layouts to display insights and metrics for event properties, user groups, cohorts, and segments. Its reports and dashboards can be presented on TV, sent to a Slack channel, or shared individually within your product team with role-based permissions.
PostHog Pros
Open-source platform, allowing complete transparency on the source code
Long data retention periods
Allows to download session recordings
PostHog Cons
Live support is not available
Tier-based pricing model may prove costly to small businesses
PostHog Pricing
| Plans | Key Features | Pricing |
|---|---|---|
| Free | Enforce SSO login, security assessment, personalized onboarding, advanced audit logs, white label | Free |
| Paid | Advanced audit logs, white label, email support, dedicated account manager | $0/month (tier based pricing) |
| Enterprise | Seven years of data retention, email support, dedicated account manager, SSO, downloadable session recordings | Custom Pricing |
15. Woopra
Best for Understanding Customer Journey
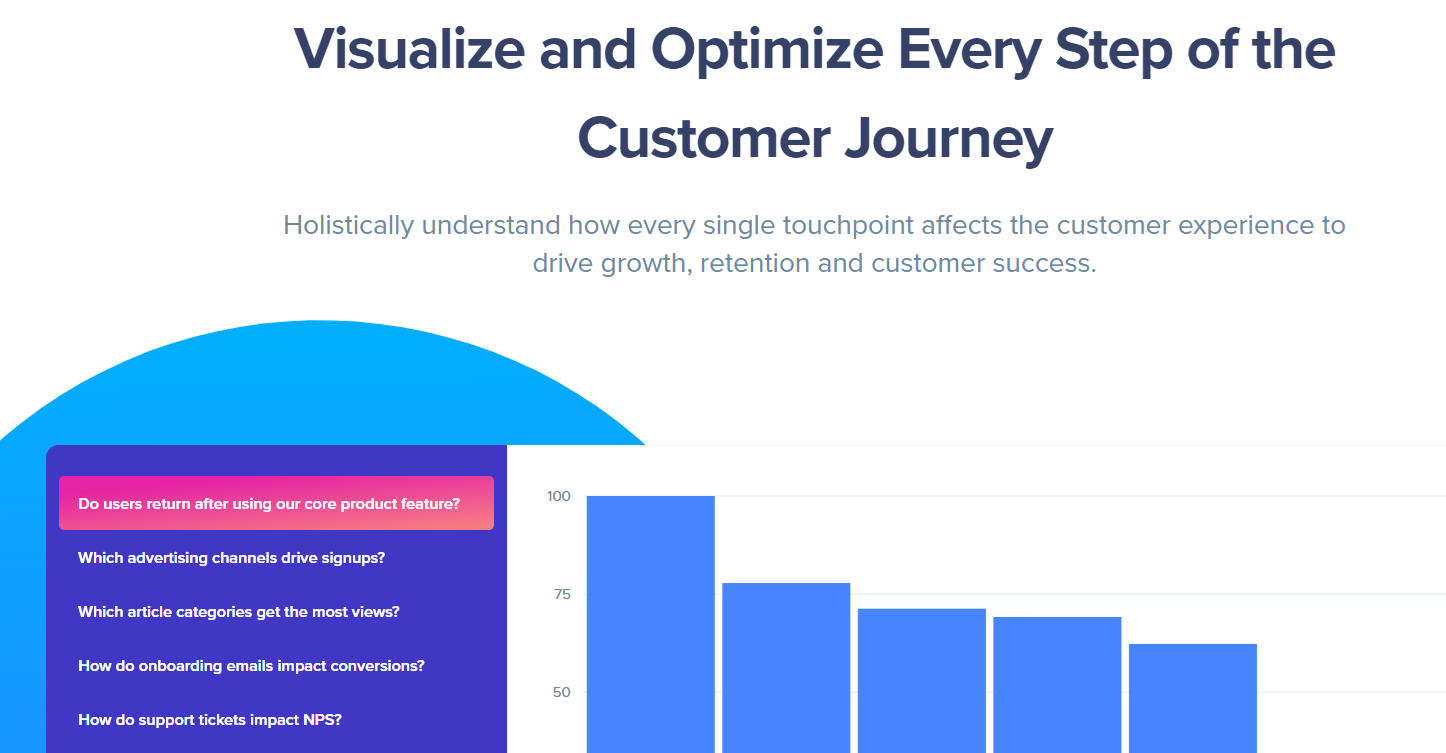
Woopra is an end-to-end customer journey analytics solution. It integrates with a range of third-party email, calendar, cloud storage, and CRM tools, providing a holistic view of the customer journey across platforms.
Woopra offers retroactive analytics to track and analyze various metrics, from website traffic and user behavior to marketing campaigns and customer interactions. It allows users to create dynamic user segments based on various criteria, such as email openings, trial sign-ups, or feature testing.
One of the standout features of Woopra is its ability to generate custom reports. It offers flexible report creation tools and a gallery of tailor-made reports for trend analysis, cohorts, and retention analysis among users.
Woopra Pros
Provides detailed customer profiles and behavior analytics
Offers advanced segmentation features
Has data warehousing and retention abilities
Offers customizable reports and dashboards
Woopra Cons
Costly for small businesses looking to scale operations
May require some technical knowledge to fully utilize all features
Woopra Pricing
| Plans | Key Features | Pricing |
|---|---|---|
| Core | Basic reporting and segmentation tools, standard support, 90-day data retention, user profiles, core analytics | Free |
| Pro | Behavioral segmentation, custom metrics, scheduled batches, two year data retention, drill-down reporting | $999/month |
| Enterprise | Data warehouse sync, workflows, data stores, organization (B2B) tracking, dedicated support | Custom Pricing |
16. Realtime
Best for Live Traffic Monitoring
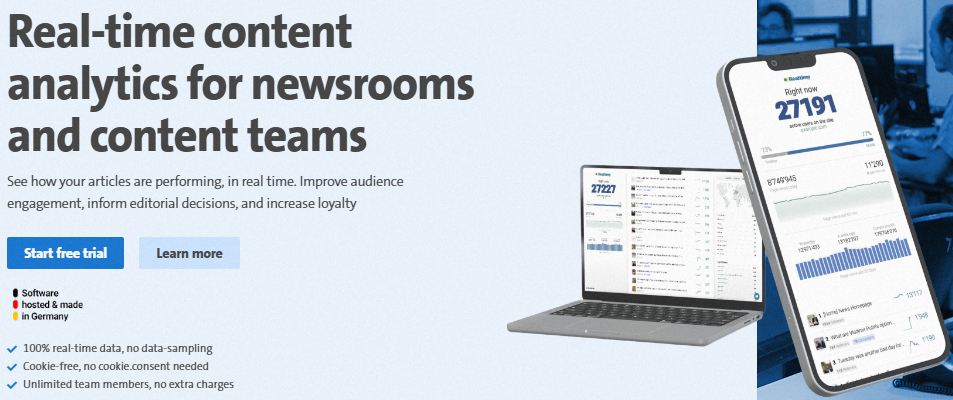
Realtime is a live traffic analysis platform that provides access to raw, unfiltered data and works without users’ cookie content. Teams get to see live website traffic statistics, including top-performing articles, user locations, referral sources (UTM tracking), and performance summaries for the last 30 days.
The user dashboard indicates active users, top pages, traffic lifecycle per article, last 3-hour history, and sources (such as Direct, Google Discover, newsletter, and WhatsApp). You can also sort data based on the URL or keywords.
Advanced use cases are supported with Realtime API, which is as comprehensive as the user dashboard and updates every 10 seconds.
Realtime supports AMP tracking, adding unlimited team members per subscription, and 99.99% uptime. Besides, its 2 KB-sized tracking script loads with global CDN, ensuring minimum adverse impact on website speed.
A few more features included with all plans include unlimited websites, unlimited concurrent visitors, 24/7 uptime monitoring, and free support.
Realtime Pros
Live traffic tracking supporting UTM paramters
Unlimited team members
Realtime API is excellent for advanced users
Realtime Cons
Expensive for small-scale projects
Data storage limited to 24-Hours
Realtime Pricing
Realtime has no free tier. However, it has a 30-day free trial across all subscriptions, and the paid subscriptions start at €37/month (approx. $40.20/month) when billed annually. The subscription models only differ in the number of page views/year they can handle; the rest of the features remain the same across all plans.
17. Gauges
Best for Ease of Use
Gauges is a simple Google Analytics alternative that admins can deploy for live website traffic monitoring. It comes with an air traffic data map updating in real-time, giving webmasters accurate visual information about their global audience spread.
The platform presents details about top-performing pages, traffic sources, search terms, and page views. You also get information about user locations, devices, and other such metrics.

Gauges Pros
Automatically updating live traffic map
Simple user interface
Quick data sharing
Gauges Cons
Too simplistic for detailed analytics
Outdated UI
Gauges Pricing
Gauges offers a no-credit-card trial for 7-days. Paid plans are based on the number of page views and sharing capabilities.
- Solo: $6/month (100K monthly page views, limited sharing)
- Small: $12/month (250K monthly page views, unlimited sharing)
- Plus: $48/month (1 million monthly page views, unlimited sharing)
18. Cronitor (formerly Panelbear)
Best for Developers
Cronitor has several monitoring tools, covering real user monitoring (RUM), website and API checks, status pages, cron jobs, etc., in one simple package.
The web analytics aspect is taken care of by RUM. It indicates live web traffic, which admins can sort by location, browser, webpage, referrer, etc.
Cronitor RUM also mentions page load time on different browsers and crucial web page performance indicators, such as core web vitals. Moreover, users get charts mentioning time spent over individual connection parameters, such as DNS and SSL.
Teams can configure Cronitor to alert in case of traffic spikes and performance thresholds.
Cronitor takes care of user privacy by using a fully open-source web analytics script without tracking cookies.

Cronitor Pros
Traffic segmentation by operating systems, browsers, etc.
Performance alerts and automatic reporting
First free 100K events
Cronitor Cons
No standalone web analytics subscription
Difficult to set up for beginners
Cronitor Pricing
Cronitor has a free plan, Hacker, which offers 5 free monitors and 100K free events for RUM. Afterwards, users need to upgrade to the Business subscription, which bills $10 per 100K events.
19. SealMetrics
Best for Paid Ads
SealMetrics is a privacy-focused analytics solution suited for businesses that run paid ads. It offers rich insights into campaign performance to help you determine which channels drive sales. As a result, you can optimize those channels to boost your revenue.
It doesn’t use cookies to track your users, so you don’t have to show consent notices to your website users. Its data collection complies with all global privacy standards.
In my research, I have noticed that SealMetrics is legally audited by third parties to ensure that its data collection process is transparent and meets the highest data privacy and security standards. Its servers are located in the EU, and it doesn’t fingerprint users or save their IP addresses.
The key features of SealMetrics that I found useful in my hands-on testing are custom UTM tracking, unlimited event tracking, and quick 5-minute integration. It doesn’t offer a self-hosted option.
SealMetrics offers daily, weekly, and monthly reports. It offers data retention for up to 25 months. You can connect it to other data warehouse and analytics tools, such as BigQuery and Power BI.
SealMetrics Pros
No fingerprinting or cookie usage, ensuring privacy
Excellent data security as it doesn’t save IP addresses
Rich reporting features for campaigns
SealMetrics Cons
Expensive for smaller businesses
Lacks granular level tracking
SealMetrics Pricing
SealMetrics offers traffic-based pricing plans. Its base plan starts at €29/month for up to 50k traffic. All plans come with free trials. A forever-free plan with limited features is also available.
20. Usermaven
AI-Powered Insights
Usermaven is an AI-powered, privacy-focused web analytics tool that can help you make better business decisions by leveraging AI-driven insights.
It’s hosted in the EU and fully complies with leading privacy regulations, including GDPR and CCPA. The tool supports cookieless analytics and gives you complete control over your data, allowing you to delete it anytime.

Usermaven utilizes AI to help you understand user behavior by analyzing their journeys. This lets you gather valuable insights and patterns to enhance the user experience. With its AI-powered attribution, you can track every touchpoint of your customer journey.
The solution also identifies optimization opportunities in the customer journey and provides actionable recommendations to improve conversions. I found its AI-powered Assistant particularly helpful for quickly answering analytics queries.
Gibran G. reviewed it on G2, saying,
I like that the data is presented in a simple way, it makes sense; there’s no need to drill down 5 or 10 clicks deep to find the data you want. The setup is also easy. The one or two times I’ve had to contact support they were very responsive and I thought they did a good job of actually trying to answer my question or resolve the issue I was having.
The following are key features of Usermaven web analytics:
- Complete traffic overview of your website.
- Ability to analyze traffic channels.
- Discovering top-performing pages.
- Setting and tracking conversion goals.
- Detailed audience insights.
- Search and ranking insights.
Usermaven’s auto-capture technology allows you to easily track website conversions, such as link clicks or form submissions. Its convenient dashboard lets you track all essential metrics in one place to make informed decisions. Some of its plans offer data retention for unlimited time.
Usermaven Pros
Easy to use, even for beginners
Fully compliant with CCPA and GDPR
Excellent analytics features for detailed insights
Usermaven Cons
Attribution features are only available on the higher-tier plans
Limited e-commerce capabilities
Usermaven Pricing
Usermaven pricing starts at $12/month for traffic up to 100K. Yearly plans offer a 15% discount. It also provides a 30-day free trial to explore its premium plans.
21. Pirsch
Privacy-friendly Analytics
Pirsch is a privacy-friendly web analytics tool that hosts data in Germany. It’s cookie-free analytics and doesn’t store any personal data. The tool adheres to the world’s strictest privacy regulations, including GDPR, PECR, and CCPA.
Moreover, it’s open-source, so anyone can analyze its code for quality. It offers you 100% ownership of your analytics data.

Pirsch comes with a range of features to gain insights into your users. During my trial of Pirsch, I noticed that it helps you visualize and understand the user journey with intuitive funnel analysis. Additionally, it allows you to perform A/B testing to optimize your website’s performance.
The key features of Pirsch include but are not limited to:
- Powerful filters to gain valuable insights.
- Time period comparison for trend analysis.
- In-depth session summaries to understand user journeys.
- Event and conversion goal tracking.
- Notifications for traffic spikes.
- Audience segmentation for targeted analysis.
I found its e-commerce revenue tracking feature helpful for tracking and analyzing revenue generated from e-commerce activities. Pirsch also allows you to import data from various analytics platforms, including Google Analytics, Fathom Analytics, and Plausible Analytics.
You can share your dashboards publicly for transparent data access and collaboration. It offers three deployment options—cloud, self-hosted, and custom cloud.
Pirsch Pros
Seamless integration with popular web analytics tools
Completely open-source for code analysis
Decent features for e-commerce usage
Complies with all major security regulations
Pirsch Cons
Relatively new tool and lacks a large community of users
Funnel analysis and A/B testing only available on Plus plans
Pirsch Pricing
Pirsch follows user-based pricing, which starts at $6/month for up to 10,000 views. Annual plans offer 2 months off. You can explore its 30-day free trial to experience its premium features.
22. TinyAnalytics
Hosted in the UK
TinyAnalytics is a simple and privacy-focused analytics tool that doesn’t bog you down with complexity but offers all the necessary user metrics you need to grow your business.
It offers cookieless analytics, so you don’t have to show opt-in notices to your website users. By default, it doesn’t track cookies, and it stores your data in London, UK.
TinyAnalytics is fully compliant with leading privacy regulations in the world, including GDPR, PECR, and the Data Protection Act (DPA) 2018 in the UK. The company claims not to mine, harvest, or sell your data.

In my research, I noted that it provides detailed session recordings to help you understand how users engage with your website. It records user clicks, mouse movements, scrolling, and keystrokes in session videos. If used strategically, the session recording feature can help you make your website more user-friendly.
I also liked its heat map feature, which visually represents how users interact with your website, offering you insights into what attracts your users’ attention, what users don’t like, how they behave across different devices, and more.
Its other key features are:
- Filter and audience segmentation.
- Ability to add custom attributes to users.
- Analysis of all user history and past sessions.
- Mapping the full user journey.
TinyAnalytics provides detailed insights into your website’s performance by tracking key metrics like page-level performance, visitor geo-location, and the devices, operating systems, and browsers they use. It also analyzes traffic sources through UTM parameters and referrers.
It uses a lightweight script, so using TinyAnalytics won’t slow down your website.
TinyAnalytics Pros
Lightweight software; doesn’t hog resources
Ideal for startups and small businesses in the UK
Excellent customer support
TinyAnalytics Cons
Doesn’t suit the complex needs of large enterprises
Not meant for businesses based outside UK
TinyAnalytics Pricing
TinyAnalytics pricing starts at £49 for up to 250,000 page views. A forever free plan is available for up to 50,000 monthly page views. It offers a 30-day free trial.
Google Analytics Alternatives Comparison
In the table below, I’ve compared the Google Analytics alternatives on this list based on their privacy focus, target audience, and pricing.
| Web Analytics Software | Privacy Focus | Target Audience | Pricing |
|---|---|---|---|
| Fathom | High (cookieless tracking), free from spying | Large enterprises, privacy-focused businesses | Freemium, $5/month |
| Clicky | Basic, bypasses ad blockers | Small to Medium Businesses | Freemium, $9.99/month |
| Plausible | High, with cookieless tracking and no personal data collection | Ideal for small to medium-sized businesses | Free trial, $9/month |
| Cloudflare Web Analytics | Moderate (does not store data or track IP addresses) | Cloudflare users and budget-constrained businesses | Freemium, $20/month |
| Microsoft Clarity | High (GDPR & CCPA compliance) | Businesses looking for user session recordings and heatmaps | Forever Free |
| Matomo | High (offers data-privacy controls) | Privacy-focused businesses who want 100% data ownership | Free, $19/month |
| Simple Analytics | High (no cookie banners) | Small businesses & privacy-conscious users | Freemium, $10/month |
| Mixpanel | High (GDPR & CCPA compliance) | Product centric businesses | Freemium, $28/month |
| Piwik PRO | Complete compliance with privacy policy laws, such as GDPR, LGPD, and CCPA | Enterprises and organizations with >50 employees | Freemium, Custom pricing |
| Heap | High (offers data-privacy controls) | Startups and large organizations | Freemium, Custom pricing |
| Adobe Analytics | Moderate | Large enterprises that want comprehensive analytics and data analysis | Free trial, Custom pricing |
| GoSquared | High, GDPR compliant with strong privacy controls | Large enterprises looking for a centralized customer data hub | Free trial, $9/month |
| Smartlook | Moderate | Marketing & User Experience teams | Freemium, $55/month |
| PostHog | High, free from spying | Product centric businesses | Freemium (tier based pricing) |
| Woopra | High | Enterprises and large organizations | Freemium, $999/month |
| Realtime | Cookieless tracking, data storage is limited to 24 hours | Newsrooms and content-heavy media houses | Free trial, €37/month (billed annually) |
| Gauges | Moderate | Individuals, SMEs | Free trial, $6/month |
| Cronitor (RUM) | Cookieless tracking, Open source tracking script | Developers | Free trial, $10 per 100K events |
| SealMetrics | Cookieless tracking, doesn’t fingerprint or save IP addresses | Mid to large-sized brands and organizations | Free plan, €29/month for up to 50K traffic |
| Usermaven | Cookieless tracking, user has full control over data | Small businesses, startups | Free trial, $12/month for up to 100K traffic |
| Pirsch | Cookieless tracking, open source script | Individuals, small businesses | Free trial, $6/month for up to 10K traffic |
| TinyAnalytics | Cookieless tracking, GDPR, PECR, DPA 2018-compliant | UK businesses | Free trial, £49/month for up to 250K traffic |
What is Web Analytics?
Web analytics or website analytics is the process of measuring your website performance using data analysis and visualization tools to improve the overall user experience.
Disadvantages of GA4
Google Analytics 4 (GA4) early adopters have identified some downsides to the web analytics platform:
- No Bounce Rate: GA4 replaces the bounce rate with “Engaged Sessions.” It means Google will now focus on audience engagement rate rather than checking who left your website.
- Limits on custom dimensions and metrics: GA4 levies a cap of 25 user-scoped custom dimensions, 50 event-scoped custom dimensions, and metrics for each property.
- Lacks monthly email reports: GA4 currently does not support monthly reporting emails. However, you can connect GA4 with Looker Studio using GDS connectors and build custom reports.
Reasons to Look For Google Analytics Alternatives
Users are looking for alternatives to Google Analytics, and here’s why:
- Data sampling: GA4 manages and analyzes large data volumes by creating data subsets or samples. Although this strategy is efficient for faster reporting, it misses out on granular data from your website visitors, leading to inefficient decision-making.
- Privacy threat: Google Analytics is often accused of intrusive data collection and selling to third-party services. Recently, European authorities ruled that the use of Google Analytics was a violation of GDPR rules on extra-European data transfers.
- Slow data processing: Data collected using GA4 can take 24-48 hours to appear in GA (outside of the “active user” view). While most Google Analytics alternatives offer real-time data refreshes.
- Complexity: Google Analytics is complex to understand initially. With so many features and buttons, beginners and professionals need to spend hours mastering it.
What Is the Difference Between Web Analytics and Product Analytics Software?
The key differences between web and product analytics software lie in their goals and the type of data they involve.
Web analytics software focuses on capturing visitor data from websites. Some essential web analytics metrics include total views, session rate, bounce rate, conversion rate, and more. Tools like Hotjar complement traditional web analytics by offering behavior insights such as heatmaps, session recordings, and user feedback polls, helping you understand not just what users do on your site, but why they do it.
Product analytics software captures user behavior within your web and mobile applications. It tracks user journey, behavior, and overall engagement with the product interface.
Frequently Asked Questions
No, GA4 is not GDPR-compliant by default. However, you can take specific steps to make it comply with privacy policies.
Yes, because GA4 is free to use and a great starting point for beginners new to web analytics. However, if you love data privacy, there are several privacy-friendly alternatives to Google Analytics.
No, Google has recently launched Google Analytics 4, the latest version of Universal Analytics.
-
 EditorNarendra Mohan Mittal is a senior editor & writer at Geekflare. He is an experienced content manager with extensive experience in digital branding strategies.


