LinkedIn has become a go-to platform for businesses to reach the next level and maximize their reach. Check out these AI LinkedIn tools to grow your business.
LinkedIn is a business-oriented platform with a massive user base. Around 61 million people search for jobs on this online space every week. These numbers are more than enough to justify how crucial LinkedIn is.
Additionally, LinkedIn offers the same features as other social media sites, where people can post and comment. As a result, it becomes an ideal platform for recruiters, founders, job seekers, and entrepreneurs to hire and generate leads in one place without struggling to find the target audience.
But is it that easy? No, making a profitable business on LinkedIn isn’t that easy. However, you can’t make this process negligible, but you can still make it relatively more accessible with the help of AI.
How? That’s what the blog is all about. In this blog, we’ll discuss how AI is framing and helping in the LinkedIn game and suggest some of the best AI tools you must try to boost your LinkedIn presence.
How is AI revolutionizing LinkedIn?

AI has been continuously improving and making its place in every industry. AI is extensively used in social media sites, from content writing to content creation. The same is the case in a professional networking site named LinkedIn.
The evolution of AI has impacted the LinkedIn game deeply. AI tools help LinkedIn content creators and assist freelancers, job seekers, recruiters, founders, and entrepreneurs to make their hiring and job-seeking journey easier.
AI makes the entire process of recurring and searching for a job easy. These tools help professionals in various ways. They help freelancers generate content that brings leads, recruiters to find potential candidates, and more.
Why should you opt for AI LinkedIn tools?

As previously discussed, AI has a significant impact on LinkedIn users. It has enough features and various options to assist professionals based on their needs and budget. However, if you are still confused, let me help you.
Here are the key factors why you should opt for AI LinkedIn tools.
Efficient hiring process – If you are a recruiter, AI can help you find the most suitable candidate faster through AI-driven candidate sourcing and matching tools. As a result, you can save time and resources in the hiring process.
Personalized experience – No doubt, LinkedIn shows the most relatable job recommendations. However, you can get even more personalized job and content recommendations through AI tools based on your interests and activities.
Data analysis – AI analytics tools help businesses and users to identify trends, user behavior, and market insights. This helps them make better business decisions.
Content optimization – LinkedIn doesn’t provide that deep content insights and analytics. However, AI can. LinkedIn AI tools help you optimize content to ensure it reaches the right audience and receives better engagement.
Enhance lead generation – AI tools can help busy founders and entrepreneurs to manage customer relationships, streamline the sales process, and improve conversation rate by enhancing the lead generation process.
The use of AI ultimately saves time and effort for the user regardless of their profession. In terms of LinkedIn, besides the above benefits, the LinkedIn AI tools also help you to make content strategy, automate messages, marketing, and more.
As promised, here are the best AI LinkedIn tools to enhance your LinkedIn journey. I have divided these tools into 4 different categories to simplify them for you. Let’s dive in!
Are you tired or overwhelmed by LinkedIn post creation? AI can help you with this. Here are the best AI LinkedIn post-generation tools you must check out.
Shield
Personal branding and generating leads can be pretty hectic tasks as you must make a content strategy that fulfills your needs. But Shield, a LinkedIn AI tool, can be your companion in this game.
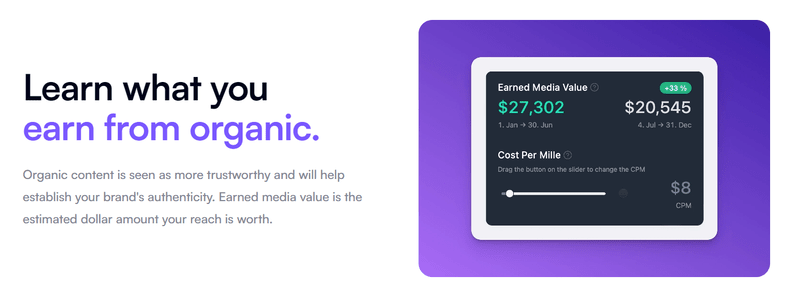
This AI tool provides deep insights into your LinkedIn presence and gives you visual graphics for better understanding. Shield is the only tool you need to grow organically on LinkedIn while generating leads by understanding what content works on LinkedIn and what needs to change.
FinalScout
The other way to connect with your prospect is through email. But finding the email of every prospect isn’t as simple as ABC. But FinalScout does it for you in mere seconds. This AI tool helps to scale your outreach and gain potential clients.
FinalScout is a paid tool. This site helps you gain potential clients and builds your email lists. Additionally, FinalScout is a safe and resourceful tool any business or freelancer must use.
Dux-Soup
Dux-Soup is one of the most secure and highly-used LinkedIn automation tools. This AI-based tool helps you to run hyper-targeted campaigns that help you to bring leads from the first day. Dux-Soup is a budget-friendly AI-based agency any business or freelancer can try.
This automation tool helps you to network with prospects, peers, and top creators. As a result, you can outreach better and drive leads without investing much time. Dux-Soup is widely used by many top businesses.
If you are a social media manager looking for an active analytical and content-generation tool, SocialPilot has you covered. This advanced AI tool offers everything one may look for.

SocialPilot is an AI tool stuffed with advanced features. Besides AI content generation and scheduling, SocialPilot lets you manage collaborative accounts. SocialPilot allows you to schedule more than 500 posts and easily manage your content calendar.
Using SocialPilot, you don’t have to worry about hashtags, post creation, analytics, etc. This tool also lets you customize the tool URL and dashboard to personalize it with your brand.
Postdrips
Postdrips is a user-friendly and powerful AI tool. Although it’s an AI tool, it assists you in growing on LinkedIn organically. From content creation to scheduling, Postdrips can do everything for you.
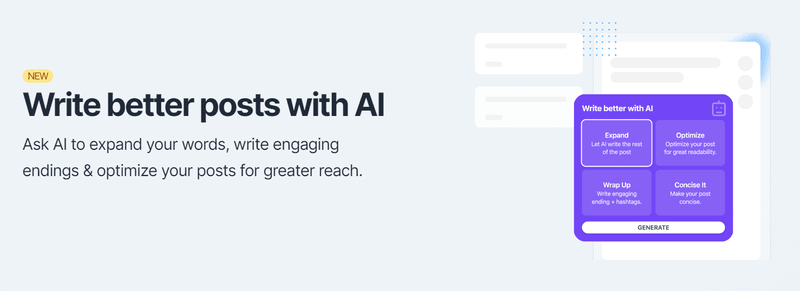
Postdrips have advanced features that help you in every step of LinkedIn growth. This AI tool helps you make scannable posts, suggest improvements, schedule posts, and also crosspost on Twitter.
Resonate
AI tools are pretty expensive for obvious reasons. However, that doesn’t mean you can’t find a free alternative. Resonate is a free LinkedIn post-generation tool. You can create your content on this tool in merely three steps.

Being a free tool, Resonate isn’t as advanced as other AI tools. Although it doesn’t offer additional features like scheduling and analytics, it’s still worth trying as it creates the content based on your inputs.
The posts generated by Resonate are not only scannable, but it also adds personality and emotions you want to convey. Resonate asks you to fill out a quick form before generating content which helps it better personalize the output.
Mention
Most LinkedIn users prefer concise and scannable posts, and generating such content isn’t easy. Mention‘s free AI LinkedIn Post Generator helps you generate engaging and concise content in seconds.

This tool asks you to give a LinkedIn post topic, choose a tone, and here you go. Your content is ready. Mention’s LinkedIn Post Generator is the fastest and most accessible AI tool you can ever find.
Taplio
If you are looking for an AI tool to help you in personal branding or skyrocket your presence on LinkedIn, Taplio is for you. Tapilo is a widely used and trusted LinkedIn AI tool.
While most AI tools offer limited features, with Tapilo, you receive a power pack of 50+ features. This AI tool covers all for you, content creation, post scheduling, LinkedIn outreach, analytics, LinkedIn marketing, chrome extension, and more.
Tapilo provides you with well-organized features which help you grow organically. It creates a list of active people from your niche to interact, generate posts in specific formats, get detailed analytics, and more.
Travisnine
The primary way to impact LinkedIn’s journey is by creating an exceptional content strategy, which isn’t easy for all. But Travisnine can help you with this. Travisnine is an advanced and expensive LinkedIn AI tool.
This AI tool not only boosts your Linkedin presence but also gives you a content strategy to brand. Travisnine is popularly known for content generation. This tool helps you generate content that conveys a lot in minimal words. Additionally, it also offers post-scheduling and integration of images to your post.
FeedBird
If you’re looking for a free content calendar and scheduler, we got you covered. FeedBird is a popular LinkedIn AI tool that assists you in content creation, scheduling, and content analytics in a few minutes.
FeedBird has several features, where content scheduling and content calendar are available for free and only in limited numbers. Additionally, the FeedBird premium version is worth trying as it lets you handle multiple accounts.
Zopto
Outreach is one of the most vital ways to connect with people and generate leads. Zopto helps you to do exactly the same but without taking much time and offering more successful results.
Zopto handles a lot of your LinkedIn game. It keeps you updated with trends, schedule posts, and run campaigns to enhance your lead generation. Zopto is a user-friendly tool mainly for businesses that are looking forward to leveling up their lead generation game.
LinkedoJet
LinkedoJet is precisely like its name; it dramatically boosts your LinkedIn outreach process. It saves your time and shows results from the first day when it comes to generating leads. LinkedoJet has the highest response rate compared to other similar tools.
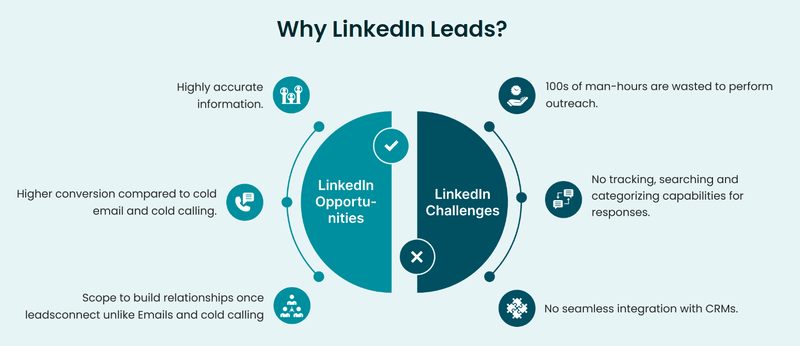
Additionally, LinkedoJet provides data-driven insights and a perfect roadmap to generate leads regardless of response. You can customize and handle campaigns from this tool with ease.
WonsultingAI
Networking can never be accessible until you use WonsultingAI. This AI tool helps you to connect with people from your niche but in a better way. How? Finding a targeted audience to network is never easy.
But WonsultingAI does it for you. Using this AI tool is simple yet powerful. You need only to give essential data like your target audience, role, and company. The AI will handle the rest. Overall, WonsultingAI is worth trying, especially for job seekers.
LinkOut
You would have heard about personalized sending cold messages. But it isn’t as easy as it seems. Additionally, sending personalized messages is time-consuming. LinkOut AI tool helps you to connect with targeted audiences with personalized messages.
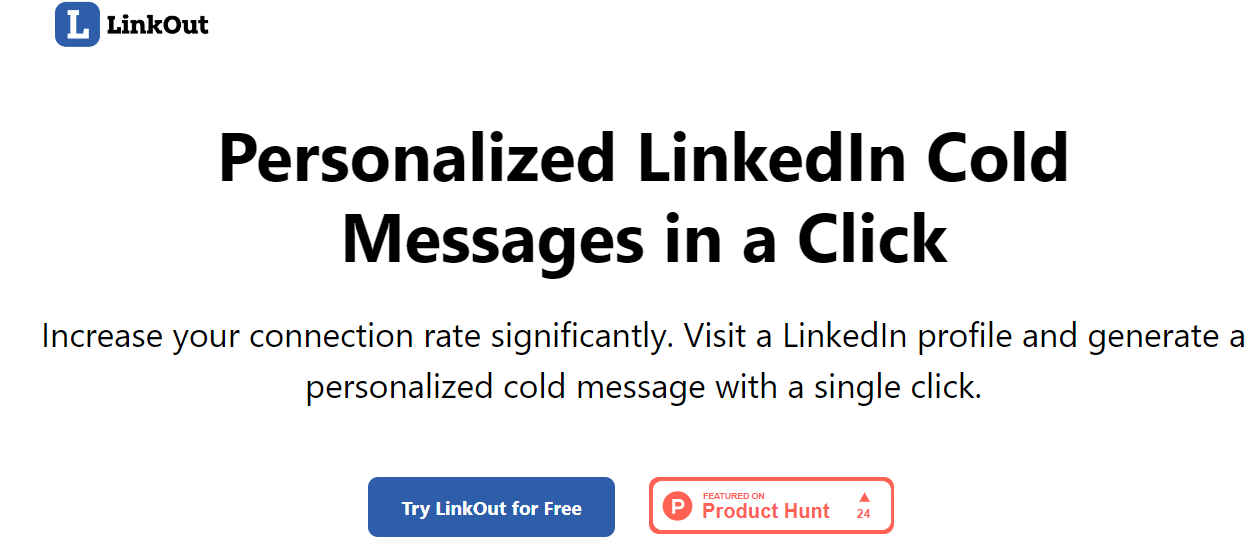
You can easily save time and effort with a high response rate by utilizing this tool.
Link Manager
Ever wondered how much your LinkedIn inspiration earns? Do you know you can target LinkedIn users based on their earnings and location? Yes, all this can be done through the use of Link Manager.
The advanced AI tools show you the estimated earning of your targeted users. It also helps you send personalized messages to connect with them. Link Manager helps you with all the tasks, from content creation to connecting with your target audience.
Commenter.ai
Commenting is the primary and most accessible way to connect with people on LinkedIn. But it’s also time-consuming and confusing sometimes. You can use Commenter.ai for LinkedIn. This AI tool comments exactly like humans and increases your brand awareness.

This tool doesn’t use any cliches like perfect, good one, etc. Instead, it writes genuine value-adding comments which sound authentic and engaging. Additionally, Commenter.ai is easy and safe to use.
Profile Optimizers
You would have heard that your first impression is your last one, and your LinkedIn profile is that first impression that can make or break your career. Although you can’t appoint a professional strategist for profile optimization, you can still use these AI tools for LinkedIn profile optimization.
Jobscan
Jobscan is a valuable tool for LinkedIn users. This AI tool quickly scans your LinkedIn profile and gives you a score based on it. This tool also helps you achieve better numbers in search results by giving you keyword suggestions.
This tool is a must-have if you are a social media manager or freelancer. You can check a certain number of profiles for free, while you may have to buy a membership for more details and features.
Resume Worded
If you are looking for a free LinkedIn optimizer, Resume Worded does it for you without any limits. This AI tool entirely handles your LinkedIn presentation, from keywords to profile writing. You can rely on this tool for everything around profile optimization.
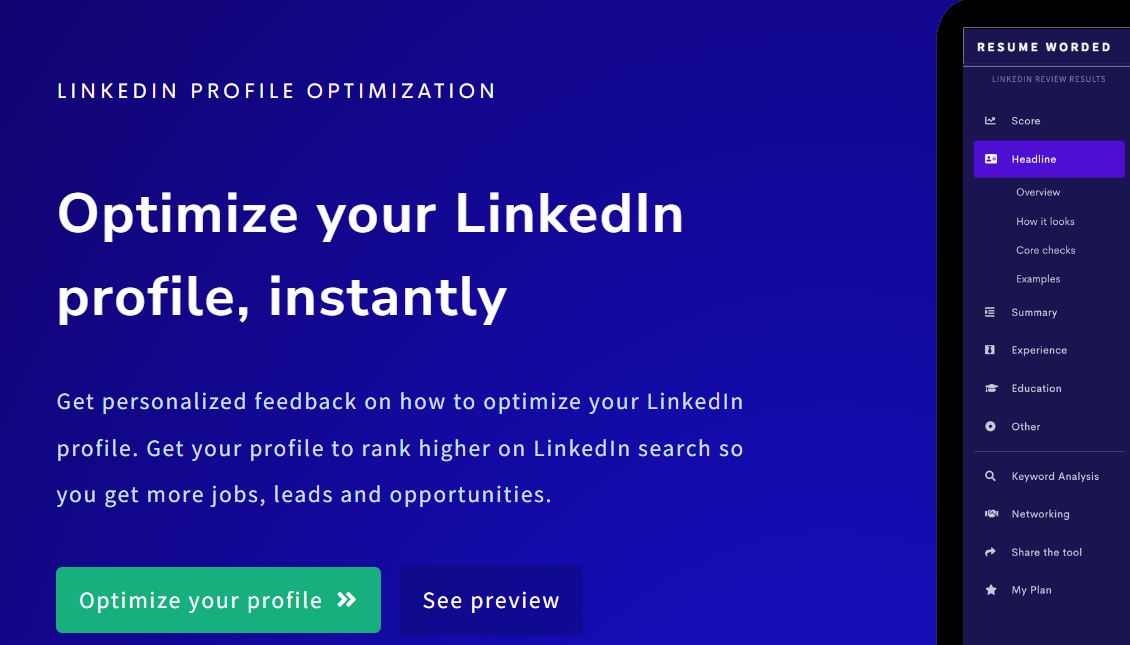
Resume Worded makes your rank high in keyword searches, as it deeply analyzes the LinkedIn algorithm and your job role to bring the best result. Overall, if you are unsure about your LinkedIn profile, check out this site.
Conclusion
LinkedIn is a professional site where one gets attention based on presentation, skill, and knowledge. So, adding pictures or irrelevant posts may get you good friends but not leads. Therefore, in this blog, we discussed some of the best AI tools to make your LinkedIn a door of opportunities. Utilizing these tools can increase your brand awareness and help you reach out to your target audience.
Check out these best tools to convert your LinkedIn profile Into a CV.


