


A stock market API, or the broader financial data API, delivers prices and company data to your application. That could be the latest quote for a ticker, years of historical prices, income statements and SEC filings, forex and crypto rates, or a live stream of trades.
Instead of scraping exchange sites or maintaining feeds yourself, you send a request and get structured JSON or CSV back. Trading apps, portfolio trackers, screeners, backtesting tools, dashboards, and research pipelines all depend on this type of data.
The choice of API platform depends on what you are building. Whether you need real-time prices or end-of-day is enough, how far back the history has to go, which markets and asset classes you cover.
I ran the same requests through eight of these APIs on free keys, then checked the answers against each other and against Apple’s SEC filing. You’ll find those results below.
Stock Market and Financial Data APIs at a Glance
| API | Data focus | Real-time equities | Free tier | Paid from | Best fit |
|---|---|---|---|---|---|
| Alpha Vantage | Stocks, forex, crypto, indicators, macro | $99.99/mo plan plus entitlement | 25 requests/day | $49.99/mo | Broad coverage and indicators on a budget |
| Financial Modeling Prep | Fundamentals, filings, transcripts, prices | Current quote on my free key | 250 calls/day | $29/mo, or $19/mo billed annually | Fundamentals-heavy apps and screeners |
| Twelve Data | Stocks, forex, crypto, ETFs, fundamentals | WebSocket from Pro | 800 requests/day | $29/mo | One API from prototype to production |
| Finnhub | Real-time US, fundamentals, estimates, alt data | Yes, on the free tier | 60 calls/min | $49.99/mo | Real-time US data without paying upfront |
| EODHD | Global EOD, intraday, fundamentals, options | All-in-One plan | 20 calls/day | $19.99/mo | Inexpensive worldwide end-of-day coverage |
| Massive (formerly Polygon.io) | Full-tick US stocks, options, indices, FX, futures | Advanced plan, $199/mo | 5 calls/min (EOD) | $29/mo | Developer-first trading and analytics apps |
| Tiingo | End-of-day prices, news, crypto, fundamentals | IEX feed, including the free plan | 500 symbols/mo | $30/mo | Low-cost end-of-day data for research |
| Alpaca | Market data plus a commission-free trading API | Free (IEX) or paid (SIP) | 200 calls/min | $99/mo | Building an actual trading or investing app |
| Databento | Full order-book history and live data, futures-strong | Live add-on or subscription | $125 in credits | Pay as you go | Quant research and microstructure work |
| Intrinio | US fundamentals, options, fair-value real-time | Fair-value feed, no exchange fees | Free trial | $150/mo | US fundamentals and options without exchange paperwork |
| FinancialData.net | Stocks, statements, options, futures, crypto, forex | Premium plan | 300 requests/day | $29/mo | Broad financial data at a low flat price |
| Financial Datasets | Fundamentals, filings, KPIs, guidance, prices | Yes, per its pricing page | $20 in paid credits | $200/mo | AI agents that need cited company data |
What I Found Testing
How I tested
On November 9, 2026, during US market hours, I called Alpha Vantage, Financial Modeling Prep, Twelve Data, Finnhub, EODHD, Massive, Tiingo, and FinancialData.net with free keys.
Apple’s October 30 daily bar, its fiscal 2026 income statement, a live Apple quote, EUR/USD, Bitcoin, SAP on Xetra, and Apple news. I checked Apple’s revenue and net income against its 10-K on SEC EDGAR.
| API | Apple close, Oct 30 | FY2026 revenue | Live quote | EUR/USD close, Oct 30 | SAP on Xetra | Apple news |
|---|---|---|---|---|---|---|
| Alpha Vantage | $344.63 | Matched EDGAR | Previous session | 1.1158 | €211.25 | Paid plan |
| Financial Modeling Prep | $344.63 | Matched EDGAR | Current | 1.11584 | Paid plan | Paid plan |
| Twelve Data | $344.63 | Ended at FY2025 | Under 1 minute old | 1.11674 | Paid plan | No endpoint listed |
| Finnhub | Paid plan | Matched EDGAR | 14 seconds old | Paid plan | Paid plan | Yes |
| EODHD | $344.63 | Paid plan | About 15 minutes old | 1.12015 | €211.25 | Yes |
| Massive | $344.63 | Paid plan | Paid plan | 1.1158 | US listings only | Yes |
| Tiingo | $344.63 | Matched EDGAR (Dow 30 only) | Current IEX quote | 1.115865 | US and China only | Paid plan |
| FinancialData.net | $344.63 | Paid plan | Paid plan | Paid plan | Paid plan | Paid plan |
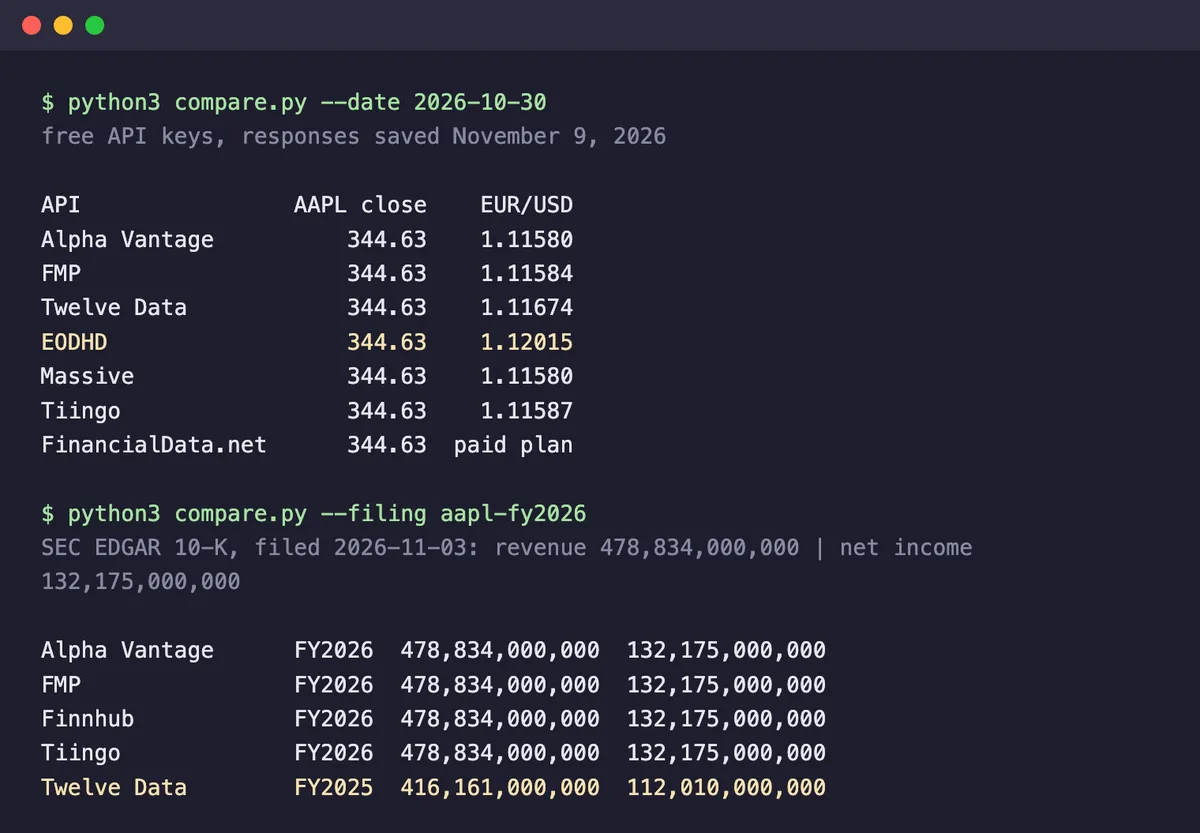
Apple’s closing price was the easy part. All seven APIs that returned a daily bar said $344.63, and their volume figures were within about 1,250 shares of each other.
Forex was messier, because EUR/USD has no central tape. Five sources landed between 1.1158 and 1.11674, and EODHD was at 1.12015.
Filings showed the biggest gap in freshness. Apple filed its fiscal 2026 10-K on November 3, reporting revenue of $478.834 billion and net income of $132.175 billion. Six days later, Alpha Vantage, FMP, Finnhub, and Tiingo matched those figures to the dollar. Twelve Data’s free response still ended at fiscal 2025.
Be careful with old prices data. For March 16, 2020, FMP, Twelve Data, and FinancialData.net returned about $60.55, while Tiingo’s close field said $242.21 and its adjusted close said $58.43. All three are correct, because Apple split 4-for-1 later that year and Tiingo’s adjusted series also accounts for dividends.
What Financial Data Each API Covers
Stock market API usually means price data and Financial data API covers more, including statements, filings, forex, crypto, economic series, and news. This table shows what each provider lists on any plan, so check the free and paid limits above before you commit.
| API | Stock prices | Fundamentals | SEC filings | Forex | Crypto | Macro | News |
|---|---|---|---|---|---|---|---|
| Alpha Vantage | Yes | Yes | Partial | Yes | Yes | Yes | Yes |
| Financial Modeling Prep | Yes | Yes | Yes | Yes | Yes | Yes | Yes |
| Twelve Data | Yes | Yes | Yes | Yes | Yes | – | – |
| Finnhub | Yes | Yes | Yes | Yes | Yes | Yes | Yes |
| EODHD | Yes | Yes | Beta | Yes | Yes | Yes | Yes |
| Massive | Yes | Add-on | Yes | Yes | Yes | Yes | Yes |
| Tiingo | Yes | Add-on | – | Yes | Yes | – | Yes |
| Alpaca | Yes | – | – | – | Yes | – | Yes |
| Databento | Yes | – | – | – | – | – | – |
| Intrinio | Yes | Yes | Yes | – | – | – | Yes |
| FinancialData.net | Yes | Yes | Partial | Yes | Yes | Yes | Yes |
| Financial Datasets | Yes | Yes | Yes | – | – | Yes | Yes |
If you only need one type of data, our guides to cryptocurrency APIs, currency exchange APIs, and open banking APIs go deeper.
Let’s discuss the above APIs in detail.
Alpha Vantage
Alpha Vantage provides REST APIs for stock time series (intraday, daily, weekly, monthly), plus forex, crypto, commodities, economic indicators, and more than 50 technical indicators calculated server-side. Responses come as JSON or CSV, and a demo key lets you try most endpoints before signing up.
The open-source community has published over 1,000 client libraries across 20-plus languages, and there is an official MCP server as well.
My free key returned Apple’s daily prices, its fiscal 2026 income statement six days after the 10-K landed, EUR/USD, Bitcoin, the CPI series, and SAP’s Xetra price. While the US market was open on November 9, the quote endpoint still showed November 6’s close, and the daily series stopped at the latest 100 rows because full history is a premium option. News sentiment came back as premium too.
Key Features
- 20-plus years of historical intraday and daily OHLCV, including pre-market and after-hours
- Technical indicators such as SMA, EMA, RSI and MACD returned ready to plot
- Fundamental endpoints for company overviews, earnings, and cash flow
- Official Google Sheets and Excel add-ons for spreadsheet users
Pros & Cons
PROS
CONS
Pricing
Free: 25 requests per day.
Paid, personal use: starts from $49.99/mo.
Real-time US market data requires a paid plan plus a one-time entitlement step, and commercial use is quoted separately.
Financial Modeling Prep
Financial Modeling Prep offers company fundamentals, standardized and as-reported income statements, balance sheets, cash flow, ratios, DCF valuations, analyst estimates, earnings-call transcripts, and SEC filings, alongside real-time and historical prices.
Data comes back as JSON or CSV, with an interactive API viewer, an MCP server, and an Excel and Google Sheets add-on. Starter covers the US, Premium adds the UK and Canada, and Ultimate is the global plan. It is SOC 2 Type 1 audited and a member of the Financial Information Services Association.
With 250 calls a day, the free plan went further than I expected. Apple’s 10-K numbers matched EDGAR, the SEC filings list included that November 3 filing, and the US quote was current. SAP’s German listing and company news were the two requests it refused.
Key Features
- Full financial statements going back roughly 30 years on the higher tiers
- Earnings-call transcripts and 13F institutional-holdings data
- Bulk and batch endpoints for downloading whole datasets at once
- DCF and owner-earnings calculations exposed as their own endpoints
- Congressional and Senate trading disclosure feeds
Pros & Cons
PROS
CONS
Pricing
Personal plans start at the Basic plan which is free, 250 calls per day, end-of-day data only.
Paid plans start at $22/mo and increase with features.
Commercial use is priced separately and requires a sales call.
Twelve Data
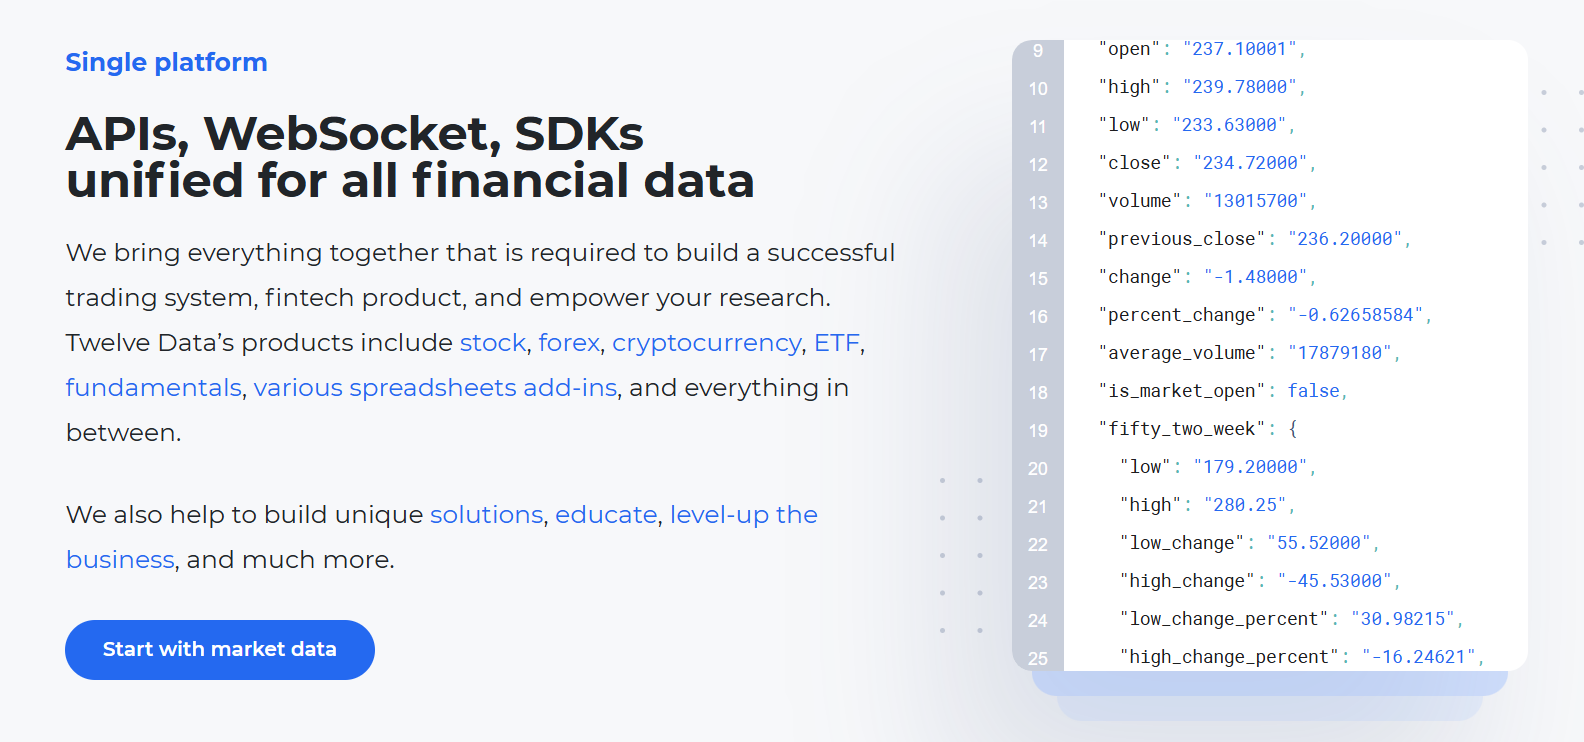
Twelve Data is a single REST and WebSocket API for stocks, forex, crypto, ETFs, indices, and commodities, with company fundamentals layered on top. It uses a credit system.
Google Sheets and Excel add-ons, official SDKs, and a no-code request builder make it approachable for smaller teams.
Apple, EUR/USD, and Bitcoin all came back on the free key, and the Apple quote was less than a minute old.
Six days after Apple filed its fiscal 2026 report, the income statement still ended at fiscal 2025. SAP on Xetra needed a Grow or Venture plan.
Key Features
- More than 100 technical indicators available directly from the API
- Batch requests to pull many symbols in one call
- Coverage that scales by tier, from US-only up to more than 80 global markets
- WebSocket streaming for real-time quotes on higher plans
Pros & Cons
PROS
CONS
Pricing
Basic: free, 8 credits per minute, and 800 requests per day.
Paid individual plans start at $29/mo (Grow).
Any company use requires a Business plan, which starts at $149/mo.
Finnhub
Finnhub offers real-time US stock data over REST and WebSocket. It also provides global fundamentals, analyst estimates, earnings-call transcripts, and a large set of alternative datasets covering insider transactions, lobbying, patents, and supply-chain links.
The free tier provides real-time US trade updates over WebSocket and a meaningful API quota from the moment you sign up. Paid coverage is split into per-dataset plans starting at $49.99 a month, and the All-in-One plan is $3,500 a month.
The live Apple quote on my free key was 14 seconds old. Company news, the SEC filings feed, and the as-reported fiscal 2026 financials all worked as well. Daily candles, forex, non-US quotes, and economic data all returned 403, so the free plan suits live US apps more than research.
Key Features
- Real-time trade and quote streaming over WebSocket
- 30-plus years of standardized financial statements on paid tiers
- Pattern-recognition and support and resistance endpoints for technical setups
- Alternative data including ESG scores, Senate lobbying, and USPTO patents
- International fundamentals and estimates beyond the US market
Pros & Cons
PROS
CONS
Pricing
Free: 60 API calls per minute, US coverage, live US trades over WebSocket for up to 50 symbols, one year of company news.
Market-data plans starts from $49.99/mo.
The all-in-one bundle with global fundamentals is $3,500/mo.
All standard plans are personal-use; commercial use requires a sales call and custom quotes.
EODHD
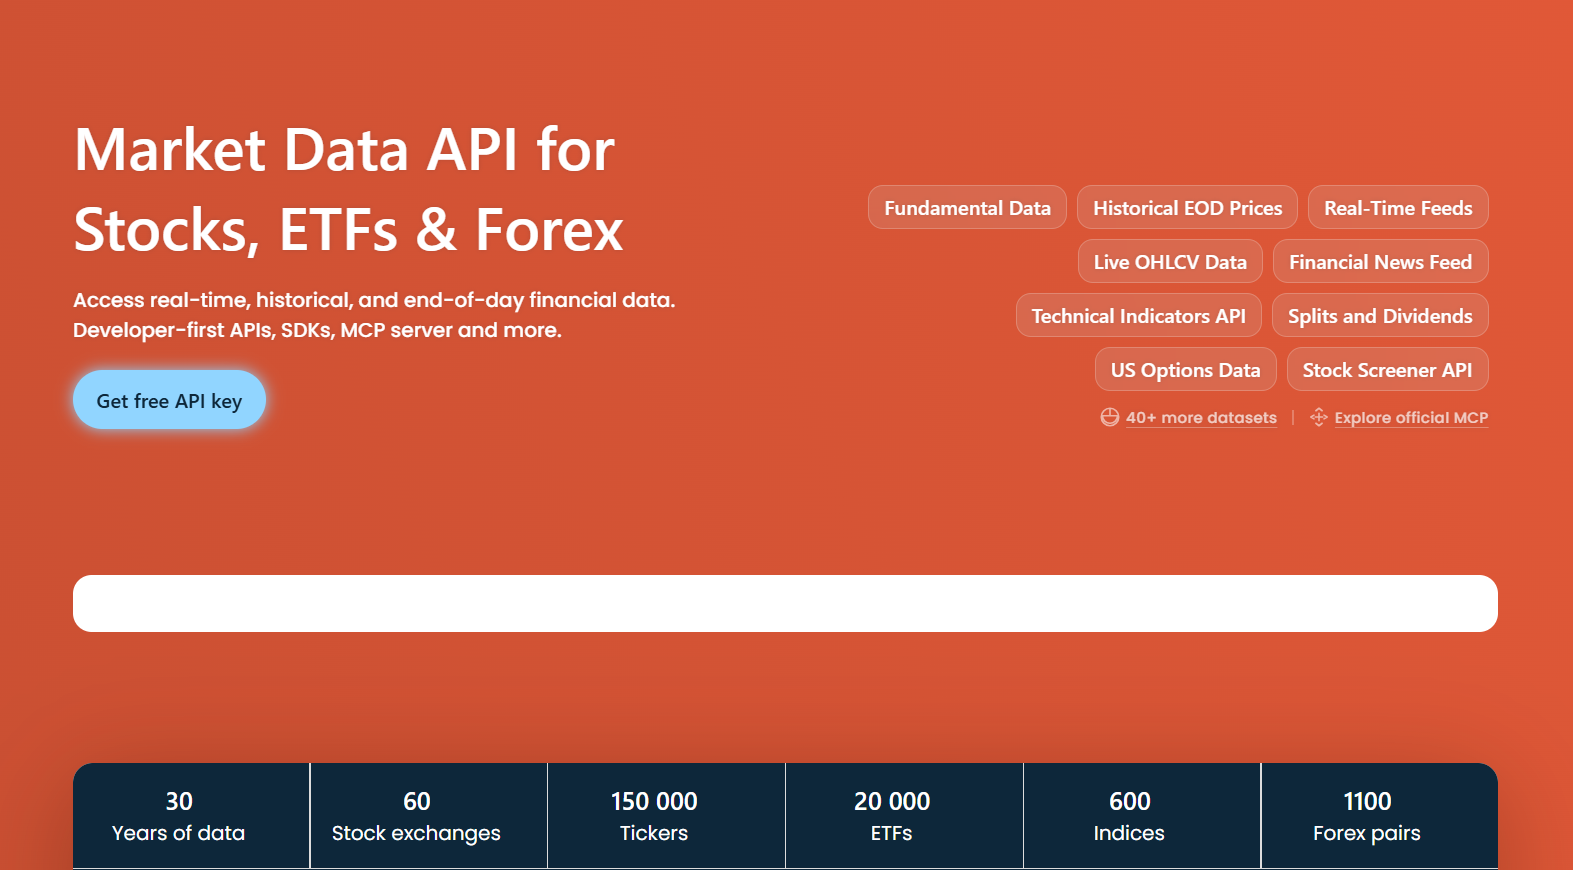
EODHD, previously EOD Historical Data, focuses on worldwide end-of-day prices for more than 150,000 tickers across 60-plus exchanges, plus intraday history, fundamentals, options, and a real-time WebSocket feed.
It offers an OpenAPI spec, an official MCP server, and Google Sheets and Excel add-ons. EODHD does not use exchange feeds. It aggregates prices from over-the-counter, peer-to-peer, and trading-platform sources, so its quotes are indicative, not official exchange prints.
The free plan is a small sample, with 20 calls a day and one year of history. Apple and SAP closes came back correctly, and company news worked, but the live quote was about 15 minutes old.
Fundamentals and macro data returned “Only EOD data allowed for free users.” EODHD’s EUR/USD close for October 30 was 1.12015, about 0.4 cents above the other five sources I checked, so compare it against a second source if forex accuracy matters.
Key Features
- US fundamentals back to 1985, with 20-plus years for most non-US markets
- One-minute intraday history for US stocks from 2004
- Splits, dividends, and both adjusted and unadjusted price series
- A marketplace of add-on APIs for options, tick data, and index constituents
Pros & Cons
PROS
CONS
Pricing
- Free: 20 API calls per day.
- EOD All-World: $19.99/mo, 100,000 calls per day.
- EOD plus Intraday: $29.99/mo.
- Fundamentals feed: $59.99/mo.
- All-in-One: $99.99/mo, bundling real-time WebSocket, intraday, and fundamentals.
- Standard plans are personal-use only.
- Students get 50% off for 12 months. Commercial licensing requires a sales call.
Massive
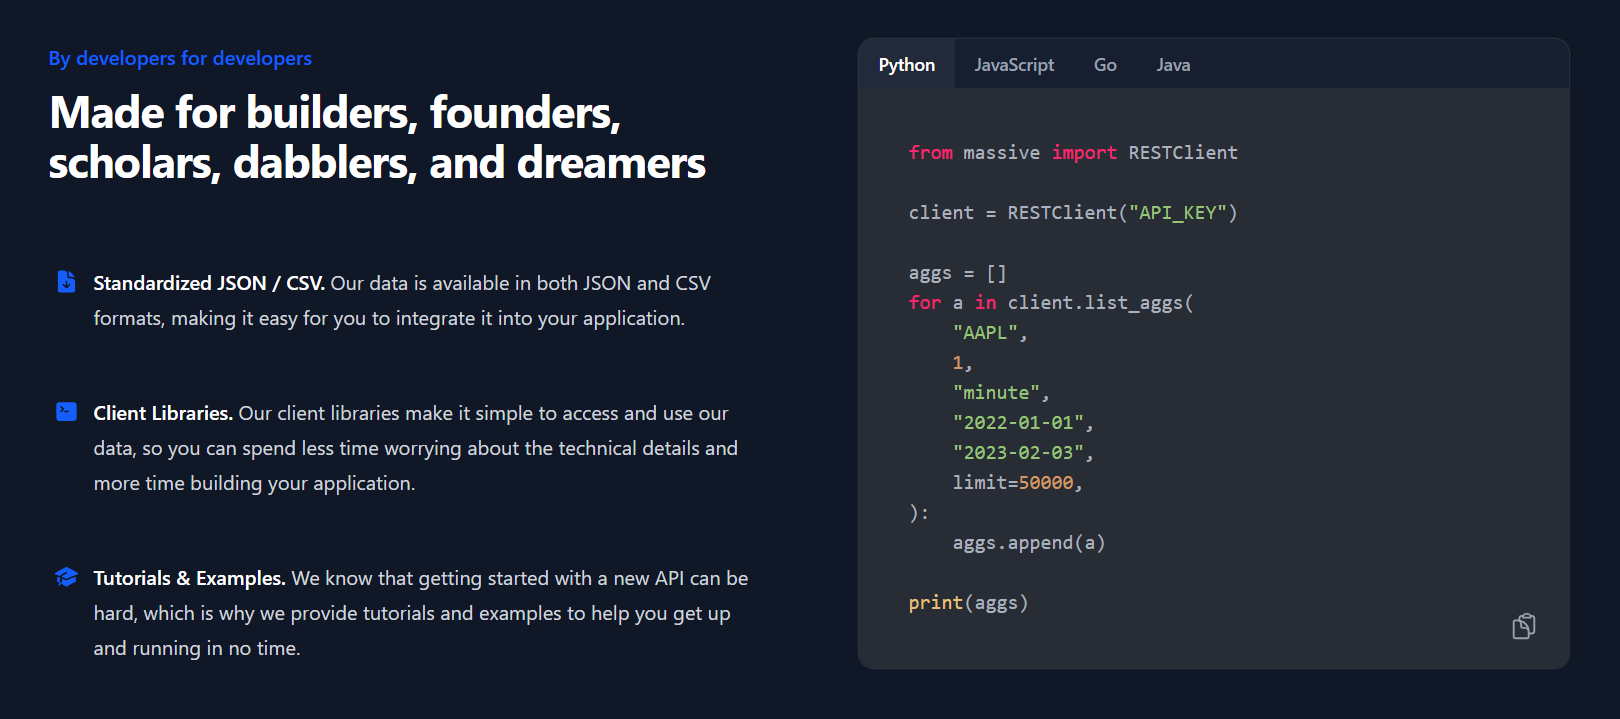
Massive, previously called Polygon.io, renamed to Massive.com in October 2025 while keeping the same endpoints, keys, and data. It is a developer-first market-data platform covering US stocks, options, indices, currencies, and futures, with full tick-level trades and quotes, aggregate bars, corporate actions, and company financials.
You can access through REST, WebSocket streaming, or download flat files.
Massive’s free plan is end-of-day and US-focused, and it behaved exactly that way. Daily bars for Apple, EUR/USD, and Bitcoin worked, and so did company news. A date from December 2024 came through, while one from March 2020 was rejected by the two-year history limit.
Live snapshots and financials need a paid plan. Financials are $29 a month on their own, or included in the $199 Advanced plan.
Key Features
- Full tick-level trade and quote history down to individual prints and raw NBBO quotes
- Downloadable flat files for bulk historical backfills
- 20-plus years of history on the top stock tier
- Unlimited API calls on every paid plan
- Second-level aggregates and full market snapshots
Pros & Cons
PROS
CONS
Pricing
- Stocks Basic: free, 5 calls per minute, end-of-day, two years of history.
- Stocks Starter: $29/mo, unlimited calls, 15-minute-delayed data, WebSockets and flat files.
- Stocks Developer: $79/mo, 10 years of history, adds trade data.
- Stocks Advanced: $199/mo, real-time data, 20-plus years of history, quotes and company financials.
Tiingo
Tiingo offers flat pricing for end-of-day data which includes roughly 110,000 global securities, 30-plus years of history, a curated financial news feed, and crypto and forex included.
An IEX real-time feed works on the free plan, which allows 50 requests an hour and 500 unique symbols a month. Prices use a proprietary error-checking process to catch missing corporate actions and bad prints.
The free key gave me a current IEX quote for Apple, forex, crypto, and 2020 prices in both raw and adjusted form. Apple’s fiscal 2026 numbers matched the 10-K, but Etsy failed with a message that Free and Power plans are limited to the Dow 30 for fundamentals. News also needs a paid plan.
Key Features
- End-of-day composite prices assembled and cleaned from multiple sources
- Real-time and historical crypto and forex data in the base plan
- WebSocket streaming for IEX and crypto top-of-book updates
Pros & Cons
PROS
CONS
Pricing
- Starter: free, 500 symbols per month, 1,000 requests per day.
- Power: $30/mo for individuals..
Alpaca
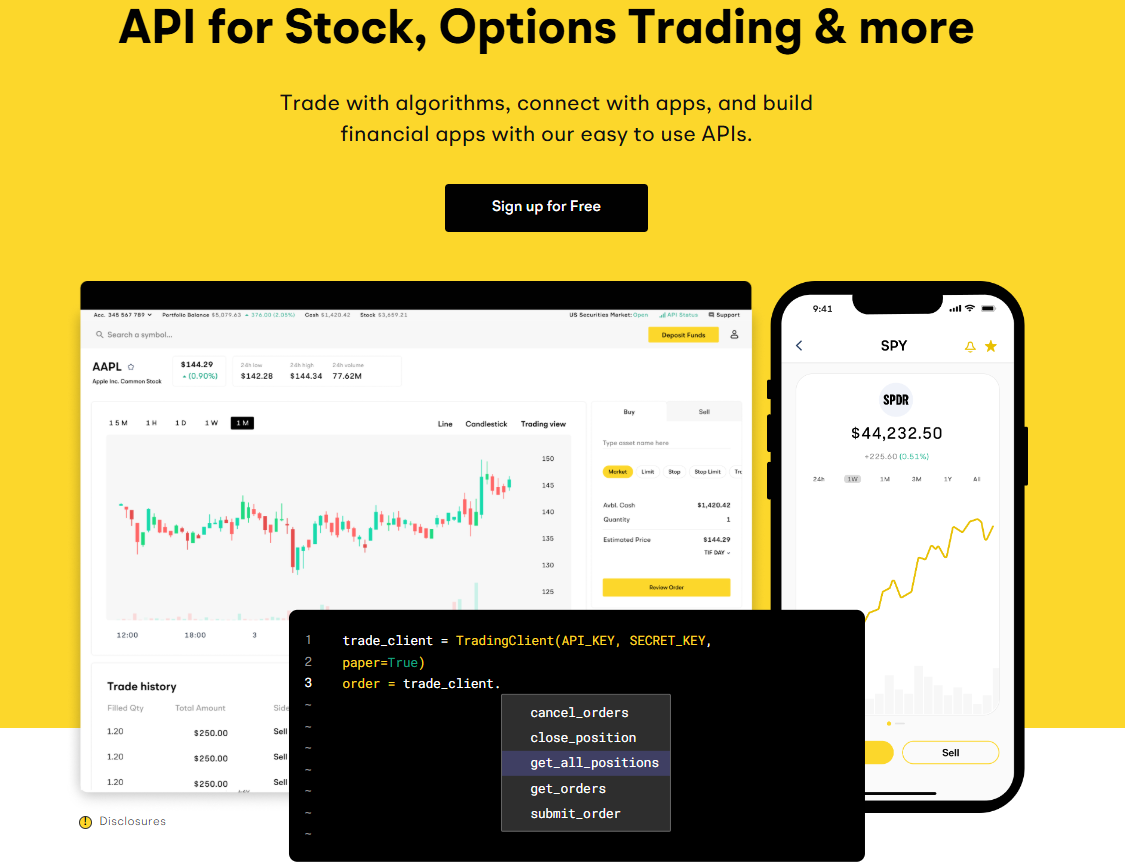
Alpaca pairs a market-data API with a commission-free trading API, so the same integration can pull quotes and place live orders. The data side gives real-time US stock, options, and crypto data over REST and WebSocket, with more than seven years of history and full market coverage.
The free data tier streams from the IEX exchange feed; the paid tier switches to the full US consolidated feed, known as the SIP. Alpaca is a registered broker-dealer, and a free paper-trading environment mirrors the live API for testing.
Key Features
- One API surface for market data, order execution, positions, and account data
- Paper-trading endpoint that behaves like the live account for testing strategies
- Advanced order types including bracket, OCO, IOC, MOO, and MOC
- A separate Broker API for teams building their own brokerage or robo-advisor
Pros & Cons
PROS
CONS
Pricing
Market Data Free: $0, 200 calls per minute, real-time over WebSocket on the IEX feed, 15-minute-delayed over REST, WebSocket capped at 30 symbols.
Databento
Databento is best for quant developers who need raw and normalized feeds direct from more than 45 venues, strongest on futures and options but covering US equities too.
It exposes full order-book depth (level 1 through level 3), trades, and OHLCV bars through Python, C++, and Rust libraries, raw TCP, and REST. Billing works like a cloud bill: pay per gigabyte for historical data, or take a subscription for live data. New accounts get $125 in credits to try it on real data.
Key Features
- Full order-book data down to market-by-order (level 3)
- Direct-from-venue distribution, not a re-aggregated feed
- 16-plus years of history on the deepest schemas
- Self-service licensing that executes exchange agreements in minutes
- Binary, CSV, or JSON encodings at the same price
Pros & Cons
PROS
CONS
Pricing
Usage-based is pay per gigabyte for historical data with $125 in free credits at signup.
Standard is $199/mo, which adds live data and removes per-dataset license fees, with 16-plus years of top-of-book history included.
Plus is $1,750/mo which add external distribution and full-depth history on annual contracts.
Intrinio
Intrinio sells US fundamentals, options data, and stock prices through per-feed data products that you can now buy on a self-serve plan, with no sales call required. Its fair-market-value real-time feeds for equities and options are priced without exchange fees or exchange paperwork, trading some precision for a much simpler license.
The history goes deep: 50-plus years of end-of-day prices and 20-plus years of analyst estimates.
Key Features
- Standardized and as-reported financial statements sourced straight from SEC filings
- Options data with Greeks and implied volatility, including a no-OPRA-license option
- Real-time equity prices with no exchange fees via the EquitiesEdge feed
- Delivery by REST, WebSocket, CSV, S3, or Snowflake, plus an MCP server for AI tools
Pros & Cons
PROS
CONS
Pricing
- Individual: $150/mo, personal use, one seat, no redistribution.
- Startup: $333/mo billed quarterly for the first six months, then $666/mo, then $999/mo, with commercial and display rights.
- Enterprise: from $1,250/mo with custom feeds and an SLA.
FinancialData.net
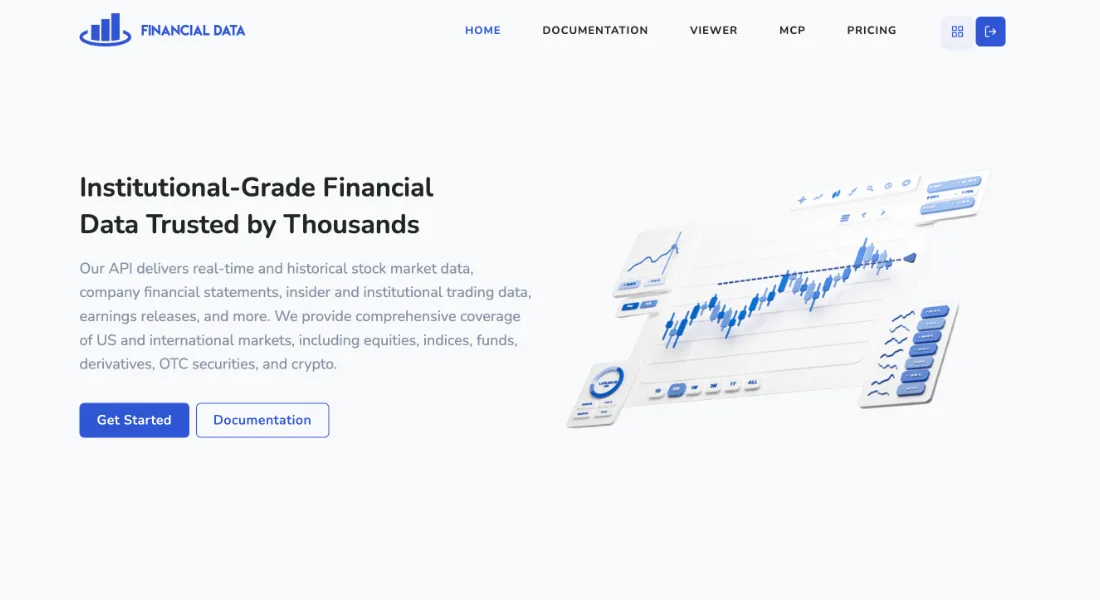
FinancialData.net is a REST API for US and international stocks, funds, options, futures, commodities, forex, and crypto. It adds financial statements, insider and institutional trading data, earnings releases, and economic data.
Responses come as JSON or CSV, and you also get a Python SDK, an Excel add-in, a browser-based viewer, and an MCP server.
For personal use, the free plan allows 300 requests a day for symbol lists and market data. Standard at $29 a month adds intraday prices, international stocks, crypto, and financial statements. Real-time data, forex, news, and economic series start with Premium at $69 a month.
On the free plan, Apple’s October 30 close came back as $344.63, in line with every other API I tried, and a smaller stock like Etsy worked too. Paging back through the daily series reached March 2020 with split-adjusted prices. Quotes and forex returned a Premium-only message, while statements, crypto, and international prices need at least Standard.
Key Features
- More than 20 years of history across stocks, ETFs, funds, and commodities, according to the company
- Option chains, option Greeks, and futures prices from the same key
- Insider and institutional trading data on Premium
- Flat subscriptions with no overage or bandwidth charges
Pros & Cons
PROS
CONS
Financial Datasets
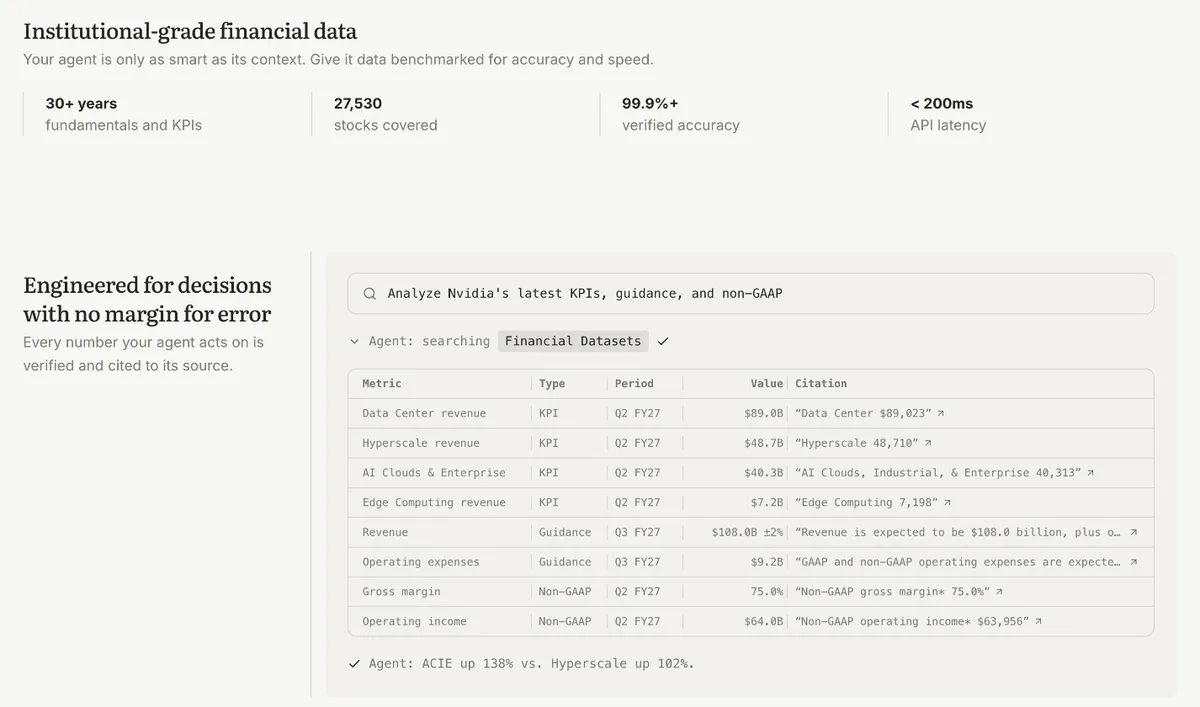
Financial Datasets is built for AI agents that read company numbers. The company says it covers more than 27,000 stocks with 30-plus years of fundamentals, and its demo shows each KPI or guidance figure next to the line of the filing it came from.
Stock prices, news, earnings, SEC filings, segmented financials, and insider and institutional ownership are part of the core data, along with interest rates and Treasury yields.
It’s expensive for a hobby project. Credits start at $20, the Personal plan is $200 a month for 100,000 requests, and the commercial Professional plan is $2,000 a month.
Key Features
- Operating KPIs, forward guidance, and non-GAAP metrics as structured data
- Source citations attached to reported values
- Segmented financials and institutional ownership
- Webhooks and uptime SLAs on higher plans
Pros & Cons
PROS
CONS
Other APIs Worth Knowing
These are sold differently from the list above, but one may fit a specific job better.
A simple REST API for end-of-day and intraday prices across 70 exchanges, now with SEC EDGAR endpoints. The free plan allows 100 requests a month, and paid plans start at $9.99 a month.
A catalog of economic, fundamental, and alternative datasets rather than a live quote feed. Many free datasets need only a key, and premium ones are sold individually.
Enterprise data across equities, options, futures, and commodities, with custom quotes and no free tier. Its agriculture and commodities coverage is the main reason to call them.
A marketplace where you subscribe to individual datasets, such as US equities, crypto, or SEC filings.
Focused on SEC EDGAR, with filing search, XBRL-to-JSON conversion, and insider and 13F data. You get 100 free calls, then $49 a month for individuals and small startups.
Stocks, forex, crypto, CFDs, and news from one provider. US real-time stock data starts at $999 a month, with no free tier.
How to Choose a Stock Market or Financial Data API
For a prototype or a side project, start with something free. Twelve Data’s free tier handles 800 requests a day across every asset class. Finnhub gives you live US trade updates over WebSocket without paying, and Alpha Vantage covers equities, FX, and macro data if you can work within 25 calls a day.
Once the product is live and needs current prices, the cost driver is real-time exchange data. Massive’s top stock plan and Alpaca’s paid tier both give you the full US consolidated feed. If you can accept modeled fair-value pricing instead of the official tape, Intrinio and EODHD avoid exchange fees.
For backtesting and research, depth and granularity matter more than latency. Databento carries full order-book history and sells it by the gigabyte, so a single study can cost a few dollars, and Massive’s flat files are the practical way to backfill years of tick data.
If you want a single financial data API for prices, statements, filings, forex, crypto, macro, and news, FMP and Finnhub cover the most in the table above, and Massive matches them if you add its financials plan. AI projects that read filings and KPIs are a better fit for Financial Datasets.
For end-of-day history across global markets, EODHD and Tiingo are the low-cost options, and Financial Modeling Prep is the one to reach for when the research is fundamentals-heavy.
If what you need is macro series, factor data, or alternative datasets rather than stock quotes, Nasdaq Data Link is the right fit, and Finnhub’s alternative-data feeds cover things like lobbying, patents, and supply-chain links.
Yahoo Finance comes up in every discussion like this. There is no supported public Yahoo Finance API, and libraries such as yfinance work by scraping the site, which breaks without warning, and falls outside Yahoo’s terms of service.
FAQ
What is a financial data API?
A financial data API gives your application structured market and company data. Beyond stock prices, it can include financial statements, SEC filings, forex and crypto rates, economic indicators, and news.
Which free stock market API is best?
In my test, Financial Modeling Prep was the best all-round free option, with 250 calls a day, current data, statements, and filings. Finnhub suits live US quotes and company news. Alpha Vantage reached furthest into non-US stocks and macro data.
Why do two APIs show different prices for the same day?
Usually because one returns the raw close and another adjusts for splits or dividends. Apple’s March 16, 2020 close appeared as $242.21 raw, about $60.55 split-adjusted, and $58.43 adjusted for dividends too. Forex and crypto also vary because those markets have no single official closing price.
What is the difference between real-time, delayed, and end-of-day stock data?
Real-time data reflects trades and quotes as they happen and usually carries exchange licensing fees, which is why it costs the most. Delayed data is the same feed held back by 15 minutes, which removes most of those fees.
End-of-day data is a single daily summary of open, high, low, close, and volume, and is the cheapest option, enough for research, charts, and portfolio tracking that does not need live prices.
Can I use a free stock market API tier in a commercial product?
Usually not. The free tiers from Marketstack, EODHD, Tiingo, and Finnhub are licensed for personal use, and commercial use requires a paid or quoted plan even at low volume.
Twelve Data goes further and requires a Business plan for any company use.