Looker Studio is a data exploration and visualization tool that helps SEO professionals analyze and optimize their strategies with pre-built dashboards. It offers real-time analytics and customizable reports to monitor and strategize effectively.
SEO professionals have built various Looker Studio SEO dashboards to visualize keyword performance, backlink analysis, competitor tracking, organic traffic, technical health, content analysis, and mobile SEO. These dashboards provide actionable insights that businesses can use to improve their search rankings, decision-making, and overall SEO strategy.
Geekflare team has compiled the free Looker Studio templates for SEO dashboards based on factors like visualizations, customizability, and accessibility to help you understand and share analytics data in real-time.
- 1. GSC Dashboard – Best for SEO Query Analysis
- 2. Piped Out’s GA4 SEO Dashboard – Best for SEO Overview
- 3. Andy Simpson’s Query Dashboard – Best for What, Why, How SEO queries
- 4. Semrush’s Site Audit – Best for Technical SEO and Backlinks
- 5. JDM’s SEO Dashboard Template – Best for SEO Traffic Overview
- 6. Porter’s Keyword Ranking Tracker – Best for Keyword Ranking
- 7. Data Bloo’s Search Console Template – Best All-in-one GSC Template
- 8. Windsor.ai’s SEO Reporting Dashboard – Best for Quick SEO Analysis
- 9. Competitor Analysis Dashboard – Best for ML-enabled SERP Analysis
- 10. SE Ranking’s Added Competitors – Best for Competitor Analysis
- 11. CRO:NYX Digital’s GA4 Organic Search – Best for GA4 integration
- 12. Olga Zarr’s SEO Template – Best for all-in-one GA4 and GSC Analysis
- 13. Radyant’s GSC Rankings – Best for Content Performance Analysis
- Show less
1. GSC Dashboard
Best for SEO Query Analysis
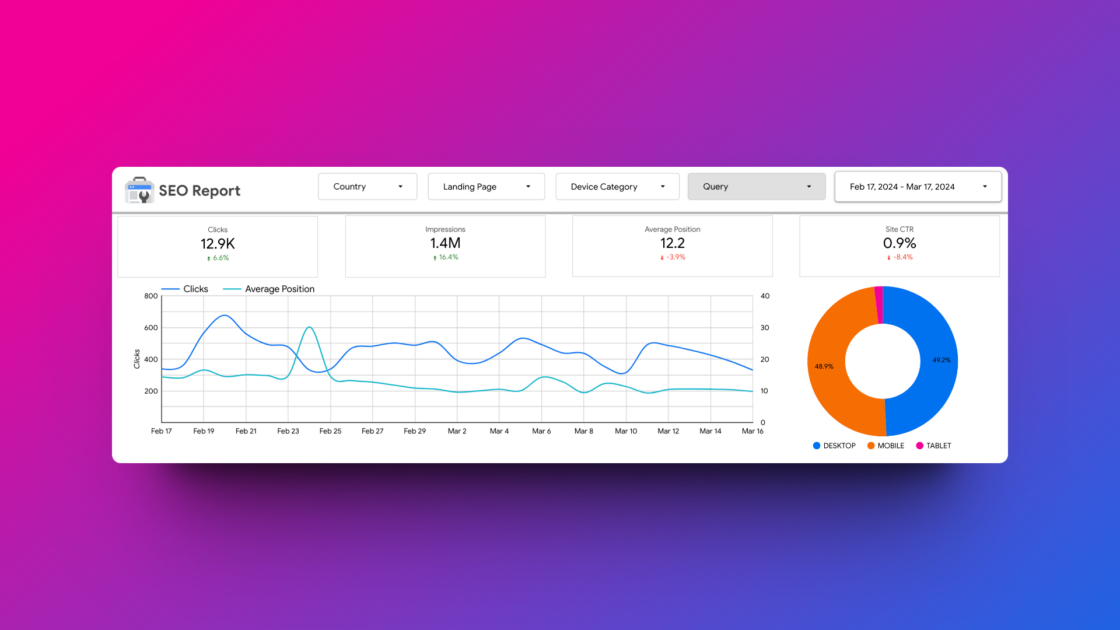
GSC Dashboard is designed to monitor important website KPIs related to SEO, including impressions, average keyword position, and clicks. It allows for detailed analysis of SEO queries, tracking landing pages, and selecting device categories for a comprehensive view. It provides a quick overview for marketers without advanced features, which is suitable for getting a surface-level view of analytics.

GSC Dashboard Key Features
- Display important metrics at the top using data and filter controls
- Clear visualization of data
- Identify best-performing pages with a table of top landing pages
- Collaborate with team members in real-time
GSC Dashboard allows for customization by ordering queries by clicks, impressions, and position to easily identify issues with queries that have decreased in positions, impressions, and clicks due to changes in search behavior.
2. Piped Out’s GA4 SEO Dashboard
Best for SEO Overview
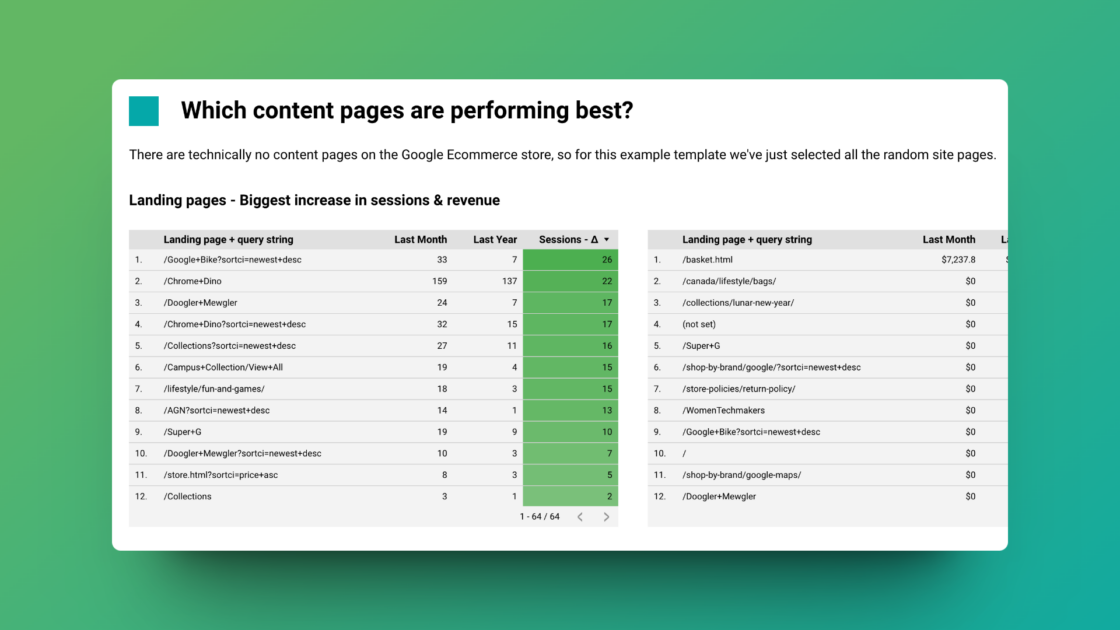
Piped Out’s GA4 SEO Dashboard is the best Looker Studio template for SEO Overview that measures SEO performance, focusing on organic sessions, goals, and revenue conversions. It provides valuable insights into changes in organic traffic, traffic sources, impacted pages, and areas that need enhancement.
Piped Out’s GA4 SEO Dashboard Key Features
- Prioritize important metrics at the top using non-date filters
- Create a table showcasing top landing pages based on sessions and revenue
- Develop a table highlighting top-performing content pieces
- Provide a summary of data for a quick overview of overall performance
Piped Out’s GA4 SEO Dashboard provides detailed Google Analytics data in easily understandable filters, making it convenient for marketers to analyze and share information. It allows you to adjust the content filter and page categories to align with your site’s URL structure and content types.
3. Andy Simpson’s Query Dashboard
Best for What, Where, Why, How SEO queries
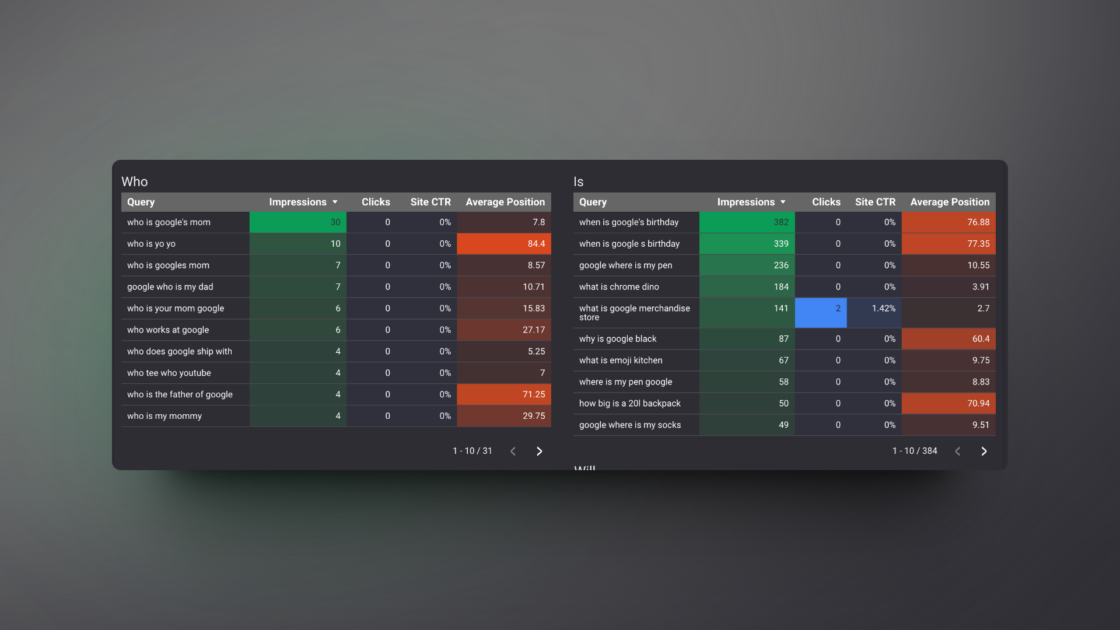
Andy Simpson’s Query Dashboard categorizes data into different sections, such as what, where, why, when, how, can, are, and near me, to make it easier to analyze and identify specific queries. It offers a straightforward user interface and allows for a simple language analysis of data.
Andy Simpson’s Query Dashboard Key Features
- Organize data easily with simple categorization
- Use metrics such as clicks, CTR, and average position to analyze effectiveness
- Utilize color-coded results for efficient browsing through the data.
Andy Simpson’s Query Dashboard template simplifies data for marketers who prefer plain language and easy-to-understand information. It doesn’t offer many customization options but allows for viewing data for specific dates.
4. Semrush’s Site Audit Overview
Best for Technical SEO and Backlinks
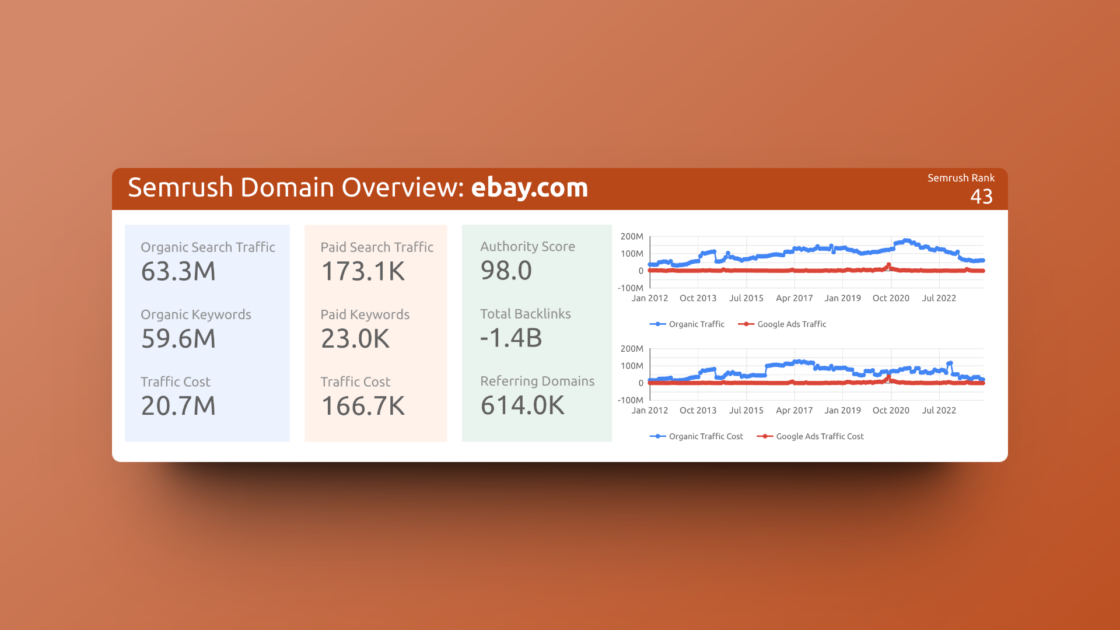
Semrush’s Site Audit offers valuable information on site health, HTTPS issues, internal links, and page speed, making them the best for technical SEO and backlink analysis.
Semrush’s Site Audit Overview Key Features
- Break down data with color coding to easily identify top results.
- Generate a thematic report to measure performance percentages of key metrics.
- Review crawled pages to pinpoint pages indexed by search engines.
- Identify and address issues, warnings, and notices to improve optimization.
- Analyze backlink profiles to assess the quantity and quality of links.
- Utilize top keywords to determine high-performing terms.
Semrush’s Site Audit Overview dashboards are a simplified version of their full capabilities, designed for marketers who want easy-to-understand data. Users can customize the data by setting preferred dates and sorting results by various filters.
5. JDM’s SEO Dashboard Template
Best for SEO Traffic Overview
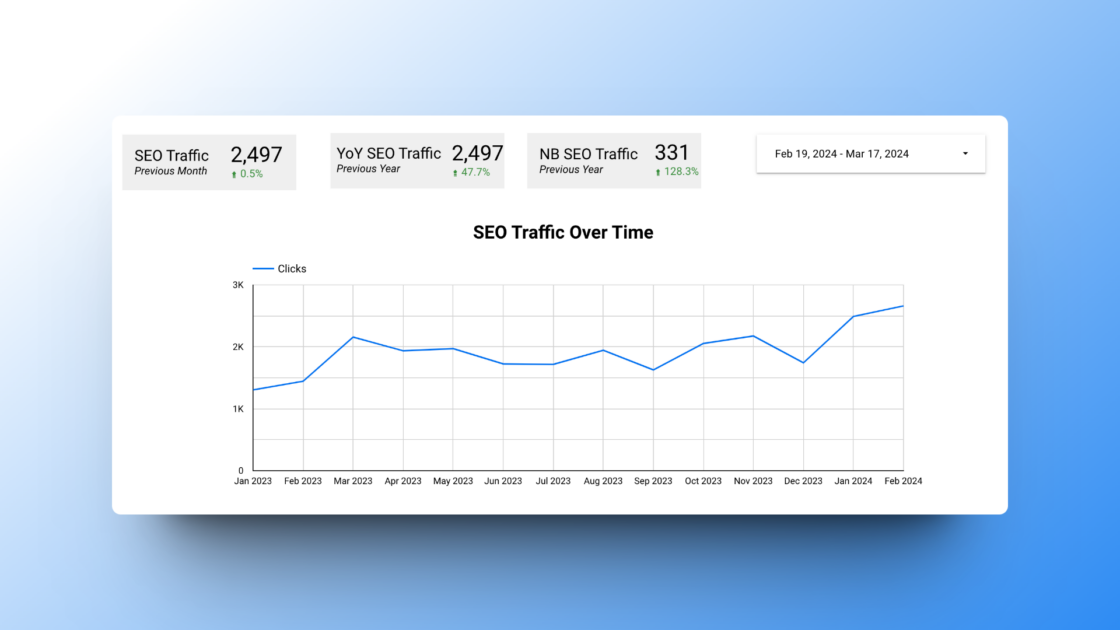
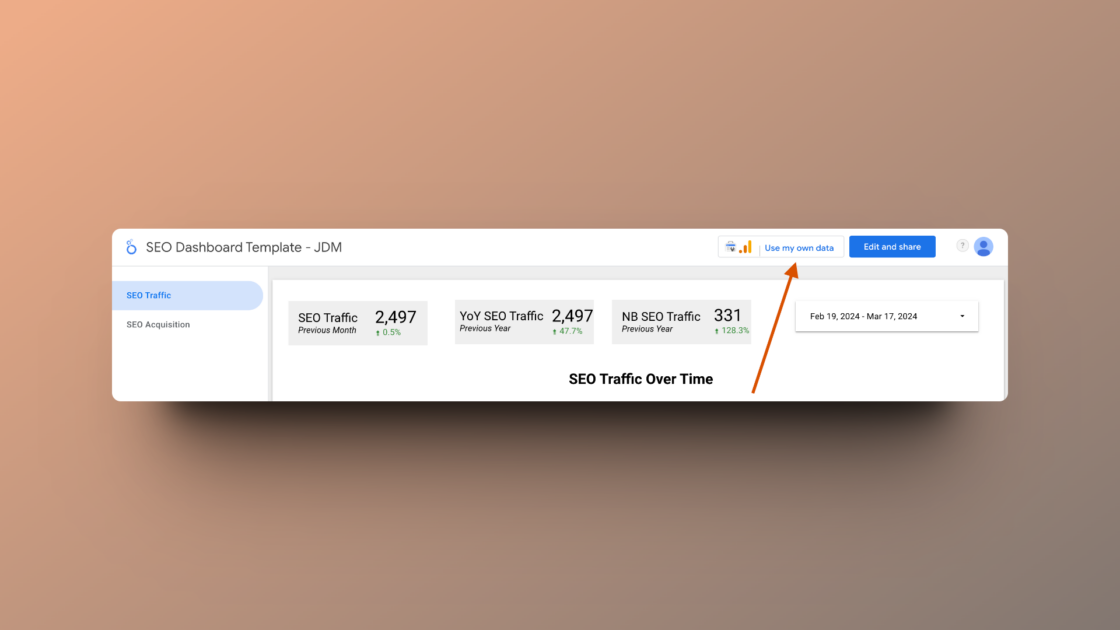
JDM’s SEO Dashboard Template is ideal for tracking SEO traffic performance, measuring website progress, and monitoring non-brand keywords, sign-ups, and user growth over time.
JDM’s SEO Dashboard Template Key Features
- Compare data from different years and months to analyze performance trends.
- Track sign-ups through various channels to determine the most effective sources.
- Monitor traffic from different channels to identify the top sources of traffic.
JDM’s SEO Dashboard Template is designed for marketers who prefer visual representations to track progress and trends over time. Users have the option to customize the dashboard by selecting specific dates and grouping metrics for a thorough analysis.
6. Porter’s Keyword Ranking Tracker
Best for Keyword Ranking
Porter’s Keyword Ranking Tracker offers a comprehensive overview of website performance, including acquisition, engagement, and audience insights. It provides detailed information on top keywords, trends over time, and metrics such as URL CTR, clicks, and impressions, making it a valuable tool for keyword rank tracking.
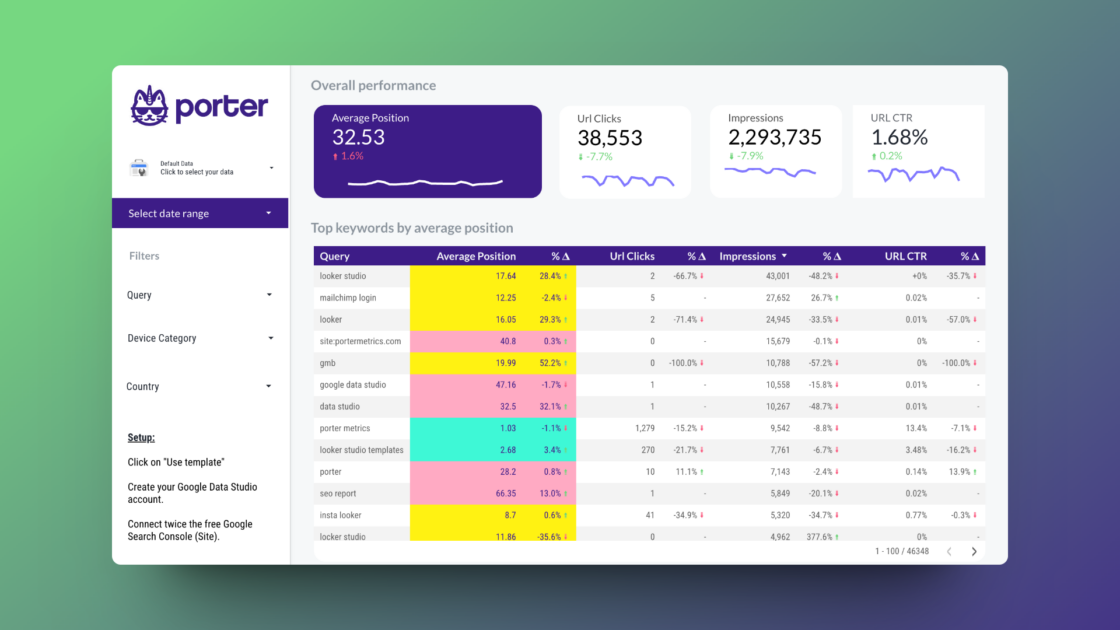
Porter’s Keyword Ranking Tracker Key Features
- Identify gaps and loopholes in your strategy using trend graphs
- Easily divide data by country, query, and device with filters
- Narrow down results with date range selection for focused analysis
Porter’s Keyword Ranking Tracker template is designed for marketers who want to analyze their data in-depth and find areas for improvement in their strategy. It offers customizable features such as date range selection and metrics values that can be easily adjusted with a click.
7. Data Bloo’s Search Console Template
Best All-in-one GSC Template
Data Bloo’s Search Console Template is an all-in-one GSC template that provides a comprehensive overview of SEO metrics, including keyword analysis, brand vs. generic performance, time, and page rankings. It allows tracking of indexed pages, queries, device categories, and organic search KPIs such as clicks, impressions, CTR, and average position.

Data Bloo’s Search Console Template Key Features
- Identify profitable search terms through keyword analysis and trends
- Gain insights into search engine traffic through organic performance
- Identify keyword positions with keyword rankings
- Determine keyword distribution on the website
- Pinpoint best performing times for optimal results
Data Bloo’s Search Console Template is ideal for marketers who are interested in analyzing keyword ranking and performance. It offers multiple dashboards specifically designed for keyword analysis. Users have the flexibility to customize the dashboard by adjusting metrics to display only the KPIs they are interested in, such as CTR, impressions, and clicks.
8. Windsor.ai’s SEO Reporting Dashboard
Best for Quick SEO Analysis
Windsor.ai’s SEO Reporting Dashboard provides a visually appealing and user-friendly way to analyze top landing page performance, view important metrics, and track changes in CTR, impressions, and average positions over time and across devices.
Windsor.ai’s SEO Reporting Dashboard Key Features
- Utilize charts and graphs for data visualization to enhance readability.
- Prioritize important data by using essential filter options.
- Improve reading and analysis efficiency by color-coding data.
Windsor.ai’s SEO Reporting Dashboard offers a simple and easy SEO dashboard for marketers that can be customized to match specific requirements by changing date ranges and filters such as country, landing page, and device category.
9. Competitor Analysis Dashboard
Best for ML-enabled SERP Analysis
Competitor Analysis Dashboard is designed to monitor competitor SEO metrics for tracked keywords. It allows for bulk competitor analysis based on top-ranking domains and URLs to provide a comprehensive view of their key performance indicators.

Competitor Analysis Dashboard Key Features
- Identify top content mentioning public figures, landmarks, and more through entity analysis.
- Identify top content with emotions and opinions using sentiment analysis.
- Study a chunk of competition at once by conducting bulk competitor analysis.
- Estimate a website’s market share and the number of organic searches with a share of search.
- Analyze top keywords on a website using in-depth keyword data.
Competitor Analysis Dashboard is suitable for marketers who constantly want to analyze competitors and carve a better strategy to outrank them. It can be customized by sorting metrics to showcase important data on top of the dashboard.
10. SE Ranking’s Added Competitors
Best for Competitor Analysis
SE Ranking’s Added Competitors template provides valuable SEO data for competitor analysis, traffic forecast, and average position tracking to help you improve your strategy and compete effectively.

SE Ranking’s Added Competitors Key Features
- Analyze organic and paid ranking data to determine which is more effective
- Utilize charts and graphs to visually represent data
- Provide a clear overview of accurate results
- Customize date ranges for specific time period results
SE Ranking’s Added Competitors Templates are great for marketers who focus on competitor analysis and tracking performance over time. It can be customized by adjusting date ranges and adding multiple competitor sites for comparison.
11. CRO:NYX Digital’s GA4 Organic Search
Best for GA4 integration
CRO:NYX Digital’s GA4 Organic Search template helps you monitor important SEO metrics such as impressions, clicks, users, site CTR, position, sessions, engagement rate, and average engagement time. It’s best for GA4 integration and allows for easy migration of metrics to a Looker Studio dashboard. it offers clear and concise graphic charts that display various metrics such as clicks, impressions, engagement rate, and sessions.
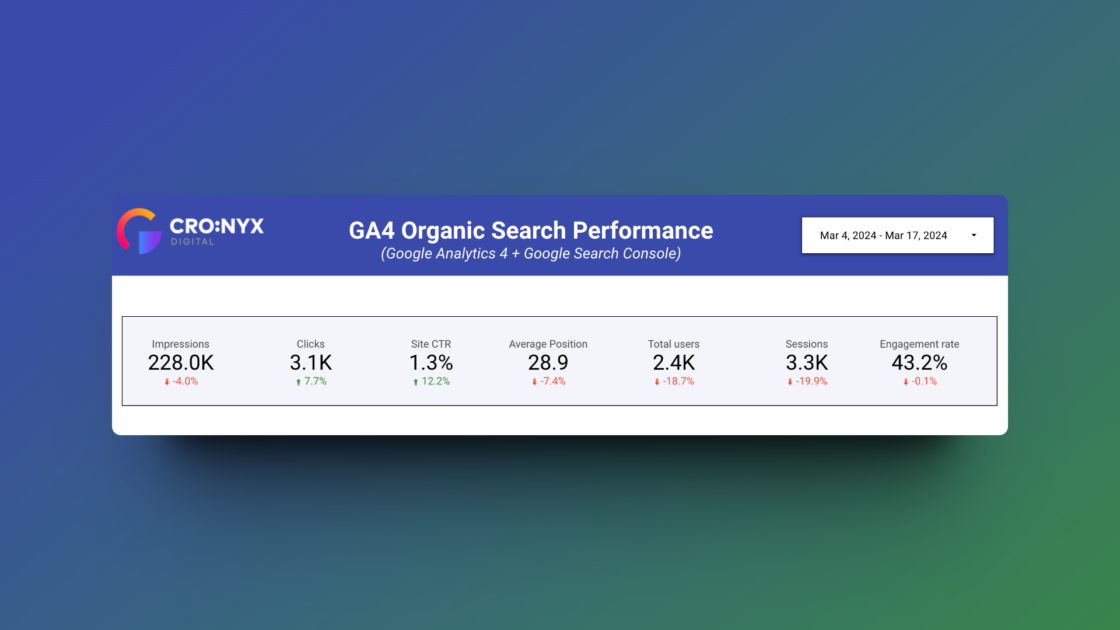
CRO:NYX Digital’s GA4 Organic Search Key Features
- Monitor organic keywords to track ranking changes.
- Visualize data with trends, graphics, and charts.
- Integrate Google Analytics 4 and Google Search Console for seamless data migration.
CRO:NYX Digital’s GA4 Organic Search template is suitable for marketers who want to bring their Google Analytics 4 data to Looker Studio and read the metrics efficiently. Its SEO template can be customized by sorting metrics to showcase important data on top of the dashboard.
12. Olga Zarr’s SEO Template
Best for all-in-one GA4 and GSC Analysis
Olga Zarr’s SEO Template combines data from Google Analytics 4, Google Search Console, and SE Ranking for comprehensive analysis. It includes blog post analysis, keyword analysis, ranking analysis, conversions, and events, with detailed data presented through graphs, charts, and tables.

Olga Zarr’s SEO Template Key Features
- Generate detailed reports for GA4, GSC, and SE Ranking.
- Export data easily for quick sharing.
- Analyze generic and question keywords to identify the ones driving the most traffic.
Olga Zarr’s SEO Template combines the features of Google Analytics 4, Google Search Console, and SE Ranking in one dashboard, allowing marketers to easily access and analyze essential data. It allows for the customization of date ranges and sorting metrics to highlight important data.
13. Radyant’s GSC Rankings
Best for Content Performance Analysis
Radyant’s GSC Rankings template simplifies Search Engine Console rankings data into a dashboard for easy content performance analysis, providing information on types of queries, numbers of queries, top pages, and rankings.

Radyant’s GSC Rankings Key Features
- Divide data into tables, graphs, and charts for easier reading.
- Provide adjustable filters to display specific results.
- Utilize color coding in results to streamline data review and save time.
Radyant’s GSC Rankings template is designed for marketers seeking a simple dashboard to display key metrics in one location. It offers customization options for changing search types, including web, image, video, news, discover, and Google News.
What is Looker Studio, and Why is it Preferable for Marketers?
Looker Studio, formerly known as Google Data Studio, is a freemium business intelligence tool that turns your data into customizable reports and dashboards, making it easy to visualize and share. Its community has built a library of marketing and SEO report templates for tracking SEO and marketing goals. Customers can upgrade to Looker Studio Pro, a paid subscription to the service, for additional enterprise management and collaboration features.
Marketers prefer Looker Studio for its ability to integrate with various data sources, customization options for reports and dashboards, collaborative features for team projects, and real-time data insights. It is a valuable tool for data-driven decision-making in marketing efforts.
How to Use Looker Studio Templates on GSC/GA4?
To use Looker Studio templates with Google Search Console (GSC) or Google Analytics 4 (GA4), follow these simple steps:
Step 1: Go to Looker Studio and sign in with your Google account.
Step 2: Access the desired template by clicking on the provided link. This will open the template directly in Looker Studio, and you will be automatically logged in.
Step 3: At the top right or left (depending on the template), you should see an option to use your own data. Go ahead and authorize it to sync with your GSC or GA4 account.
You should now be able to see your data on the template dashboard. The process remains the same for each template, with slight variations.
Criteria for Selecting SEO Dashboards
The criteria for selecting SEO dashboards should be the following.
- Integration Capabilities: Ensure the dashboard is easily integrated with SEO tools and platforms to retrieve data seamlessly.
- Customization: The dashboard should offer various customization options to help you visualize the most critical data.
- User-Friendly Interface: Opt for an intuitive and easy-to-navigate dashboard, especially if you’re not a technical expert.
- Reporting Features: Choose a dashboard that provides detailed reports on key SEO metrics such as organic traffic, keyword rankings, backlink profiles, and competitor analysis.
- Support and Documentation: Select a dashboard with responsive customer support and thorough documentation to help you make the most of its features and address any issues promptly.
Considering the above criteria, you can select an SEO dashboard for Looker Studio that meets your exact needs, helping you effectively monitor and enhance your SEO performance. By leveraging SEO dashboard examples and templates, businesses can gain a deeper understanding of the effectiveness of their SEO efforts and identify areas for improvement.
Metrics of a Good SEO Dashboard
A good SEO dashboard should include metrics such as organic traffic, click-through rate, keyword rankings, backlink profile, and average position to gauge the success of SEO efforts. By monitoring these metrics regularly, you can identify areas for improvement and make data-driven decisions to optimize your website for better search engine visibility and user experience.