In the emerging cloud-native landscape, Kubernetes is undoubtedly everywhere. It has become the standard for orchestrating containers. But managing multiple Kubernetes clusters, which must run everywhere in a consistent and secure way, presents a new set of challenges. Therefore, the need of Kubernetes management tools arises.
Let’s explore some of the popular solutions to manage Kubernetes efficiently.
K9s
k9s is a terminal-based resource dashboard. It has only a command-line interface. Whatever you do on Kubernetes dashboard web UI, you can do the same using this terminal k9s dashboard utility also.
It keeps an eye on the Kubernetes cluster continuously and offers commands to work with defined resources on the cluster.

Below are K9s features:
- Real-time tracking of the cluster
- Customize view using K9s skins
- Easy traversal through Kubernetes resources
- Drill down options to check cluster resource issues
- Provides extended plugins to create your own commands
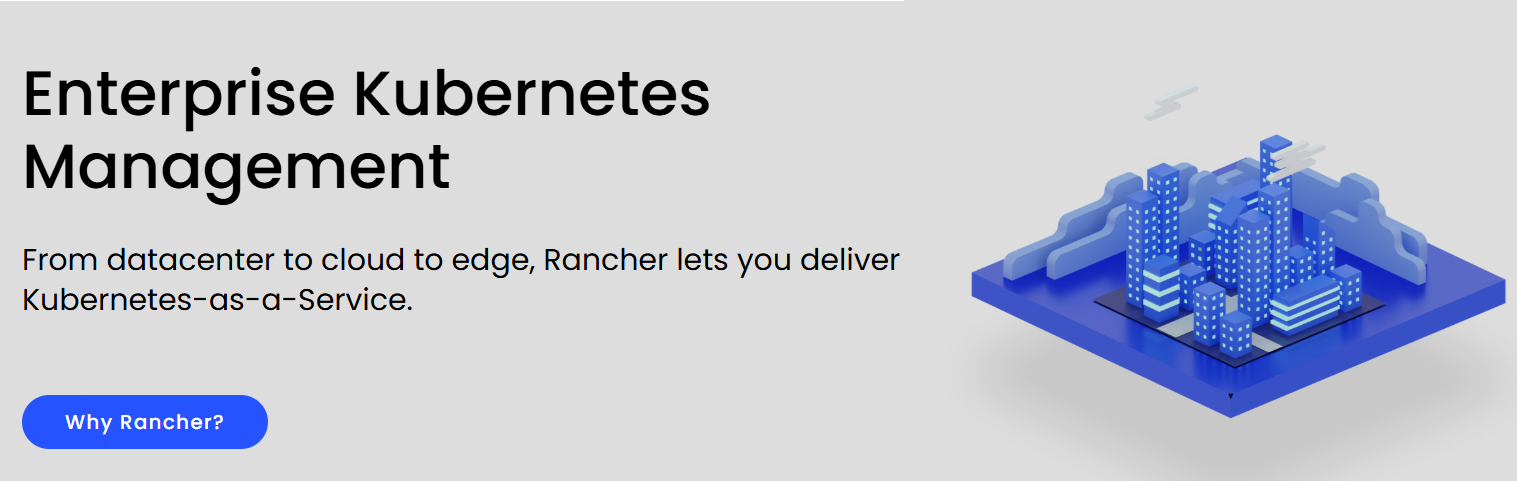
Rancher
Rancher is an open-source container management platform that makes it easy for any enterprise to adopt Kubernetes. You can deploy and manage cloud-hosted Kubernetes clusters running in GKE (GCP), EKS (AWS), AKS (Azure), or you can just deploy Kubernetes on your choice of VMs or bare metal infrastructure.
Rancher simplifies all the operational responsibilities of the administrator, including:
- Monitoring the health of your clusters
- Setting up alerts and notifications
- Enabling Centralized Logging
- Defining and applying global security policies
- Establishing authentication and enforcing our back policies
- Managing and scaling your infrastructure
As Kubernetes adoption accelerates across your company, rancher encourages the rapid adoption of giving users access directly to Kubernetes API and CLI. Rancher’s new intelligent interface simplifies application management; teams can easily deploy and manage workloads, defined Secrets and manage private registries, configure persistent volume claims, configure load balancing and service discovery, manage CI pipelines.
Dashboard + Kubectl + Kubeadm
The Kubernetes dashboard is a web-based interface to deploy containerized applications. It troubleshoots your applications and manages the cluster itself along with the resources.
You can use the dashboard to get an overview of the applications running on your cluster as well as creating or modifying individual Kubernetes resources such as deployments jobs, replica sets, and many more.

You can scale deployment, or you can initiate a rolling update, or you can even restart the pod or deploy new applications using a deploy wizard on the dashboard.
Kubectl is a command-line tool to communicate with the API service and send commands to the master node. Its covert commands to API calls to the Kubernetes cluster API server. Get familiar with Kubectl command examples.
Kubeadm is a tool with built-in commands to start a minimal Kubernetes cluster. It is used for bootstrapping a cluster and not provisioning machines. Using kubeadm, you can run some basic commands to bootstrap a cluster, create a token to join a cluster, revert changes made to a Kubernetes cluster, etc.
Helm
Helm is the package manager for Kubernetes. It allows developers and operators to package, configure, and deploy applications and services on the Kubernetes cluster. It gives greater control over the Kubernetes clusters to the operators which:
- Makes application deployment easy, standardized and reusable
- Describes complex apps easily through helm charts
- Improves developer productivity
- Reduces deployment complexity
- Enhances operational readiness
- Speeds up adoption of cloud-native apps
- Eases the rollback to the previous release
Helm uses Charts that contain all the resource definitions to run applications or services on a Kubernetes cluster. You can find multiple helm charts available to be used here.

KubeSpray
KubeSpray is a cluster lifecycle manager that helps you deploy a production-ready Kubernetes cluster. It uses ansible-playbook to automate the Kubernetes cluster provisioning.
Some of the features include:
- Ansible-based
- Highly available
- Cross-platform
- Production level
- Popular cloud provider integrations or even bare metal
- Variety of configuration options
- Multi-platform CI/CD
- Secure by default
By default, Kubespray allows you to connect to the Kubernetes cluster remotely through the kube-master IP address and port 6443. Kubespray is best suited if you need flexibility in deployment; it gives a lot of custom configuration options.
Also, if you are familiar with Ansible, then Kubespray is very easy to use.
Kontena Lens
Kontena Lens is a smart dashboard for Kubernetes.
It’s the only management system you’ll ever need to take control of your Kubernetes. It’s available for Mac OS, Windows, and Linux operating systems free of charge. Once the lens application is started, you’ll see a list of all associated clusters in the interface.
It is the most powerful IDE for people who really need to deal with Kubernetes daily. You can ensure your clusters are properly set up and configured, and you can work with your clusters more easily and fast and radically improving your productivity and at the speed of your business.
Kontena Lens IDE features are:
- Can manage multiple clusters at a time
- Visualize the cluster state in real-time
- Provides built-in terminal
- Very simple installation as it is a standalone application
- Amazing UI and user experience
- Kubernetes RBAC is supported.
- Tested to handle almost 25K pods in a cluster
Kubernetes is a complex tool, and Lens IDE helps even the beginners to get started with Kubernetes easily. It is one of the best tools out there for managing and visualizing Kubernetes clusters.
WKSctl
WKSctl stands for Weave Kubernetes System control. It is a part of the Weave Kubernetes Platform.
WKSctl is a tool that uses GitOps for Kubernetes configuration management. GitOps is nothing but a set of practices that uses git requests to manage applications and infrastructure in a traditional way.
Using WKSctl, you can manage Kubernetes clusters via Git commits. You can upgrade the cluster or add/remove nodes from the cluster.
You can run this tool in 2 modes: Standalone mode and GitOps mode. In Standalone mode, it creates a static cluster. In GitOps mode, it configures the cluster according to cluster.yml and machines.yml information present on git.
WKSctl features:
- One quick step launch of a cluster with git
- Easy rollback in case of a failed deployment
- Records the changes for review and audit
- Only IP address and ssh keys required for cluster creation
- Verifies and corrects the cluster state continuously
Conclusion
So that was all about popular Kubernetes management tools/software out there to manage Kubernetes clusters with ease. Choose any one of the tools mentioned above and try it out on your Kubernetes cluster!