I present you top cybersecurity companies which offer security solutions to protect you, your business and the world!
PaloAlto
PaloAlto Networks is among the prominent companies providing cybersecurity solutions in its next-generation firewalls and other forward-looking solutions. It prides itself in a Palo Alto Networks Next-Generation Firewall (NGFW) that gives industry-leading prevention coverage of all threats, including URL filtering, application visibility, and control capabilities.

Palo Alto Network is headquartered in Santa Clara, California, and its model or dimension is based on Zero Trust, which enables it to offer visibility as well as integrated machine learning and threat intelligence for protection from advanced threats.
Their services span from cloud security to endpoint protection, protecting companies’ networks globally with their in-depth analytics.
Palo Alto Networks protects company networks against dynamic cyber threats with elements of proactive detection and response mechanisms.
The company is known worldwide as one of the leading ones in this particular branch due to its innovative approach to cybersecurity.
Graylog
Graylog offers advanced cybersecurity solutions with AI/ML, security analytics, intelligent alerting, incident investigation, asset enrichment, and anomaly detection capabilities for simplified threat detection and incident response.
Graylog makes advanced cybersecurity affordable and accessible, enabling organizations to defend against evolving cyber threats, including API vulnerabilities. Graylog Security, a scalable SIEM solution, helps mid-sized enterprises detect and respond to threats across cloud, hybrid, and on-premise environments. ESG predicts 20% smaller team requirements compared to alternative SIEM solutions, with an annual ROI up to 263%.

With Graylog Security, practitioners can:
- Rapidly search through vast amounts of data with lightning-fast capabilities.
- Effortlessly track assets and quickly identify the source of issues or logs.
- Direct security efforts towards relevant matters by filtering out alert noise.
- Increase productivity with trustworthy automation for repetitive and security-intensive tasks.
- Improve their overall security posture
Fortinet
Fortinet is a trusted leader for organizations seeking to protect their businesses and data from cyber threats. Fortinet is a market leader in offering high-performance security solutions that scale with evolving organizations, covering network security, cloud protection, secure SD-WAN, and endpoint defense.

It is backed by an innovative commitment to protect networks globally for enterprises, service providers, and government entities alike, supporting around 680,000+ customers.
Fortinet has a global presence, providing integrated security solutions and services based on its flagship FortiGate next-generation firewall. Their Security Fabric architecture combines efficient protection against advanced threats with comprehensive network security for a cohesive approach to keeping businesses safe.
Based out of Sunnyvale, California, Fortinet remains dedicated to helping companies stay secure online.
Zscaler
Zscaler is among the best cybersecurity companies that have rendered many days of widespread services in the field of cloud security. Zscaler provides secure access to the internet and applications within an organization that has set up its Zero Trust Network, web gateways, and firewall.
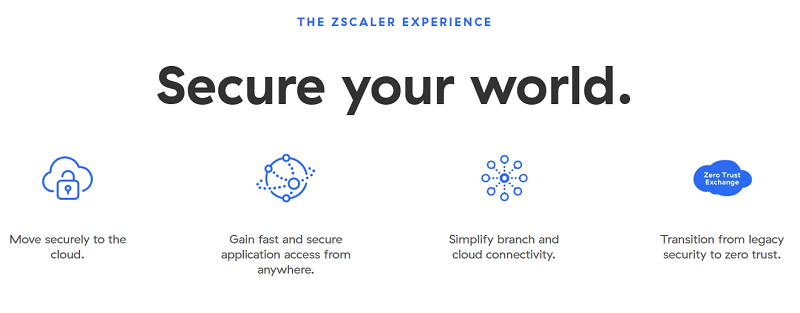
All these are available on the Zscaler platform, allowing users to securely connect without giving regard to the location or type of electronic device they want to use.
The company’s headquarters is in San Jose, California. 30% of the Forbes Global 2000 companies already use Zscaler, making it Zero Trust Security’s most trusted name.
Its customers relish flexible, secure access to more than 320 billion transactions daily and earn a satisfaction score of 80+ Net Promoter Score.
Zero Trust Exchange of Zscaler completely protects the cybersecurity and data security of all companies through users, workloads, and devices of an enterprise.
Okta
The company, Okta, is into Identity and Access Management (IAM), dealing with the delivery of cloud-based secure authentication, authorization, and identity management solution provision. It serves amidst the extensible, simple-to-use platforms working with your existing solutions.
That said, with over 18,000 customers and proof of its success in 7,000 integrations, it has won awards like Gartner Peer Insights Customers’ Choice in Access Management and Forrester WaveTM, recognizing Okta’s strong performance in Customer Identity and Access Management.
The platform brings solutions that dwell on identity authentication, authorization, and secure access management of applications, devices, and users across industries while covering each part of the identity life cycle, ranging from governance through privileges control with Workforce Identity Cloud.
Okta is located in San Francisco, California, USA.
OneTrust
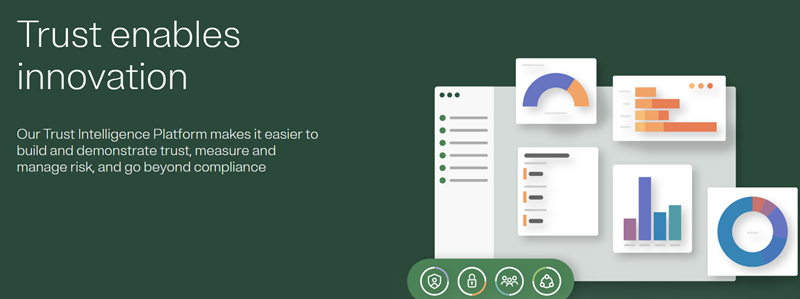
OneTrust is a privacy technology company that provides companies with the most robust automation of their data privacy and security resources and tools worldwide. The solutions include consent management, data governance, and privacy management products.
Products and services of OneTrust are used globally by over 14,000+ organizations, including some of the biggest brands like Samsung, Fable Deloitte, Pfizer, Protiviti, etc.
Its products offer comprehensive capabilities towards GDPR or CCPA compliance alongside improved security measures against malicious attacks targeting consumer or employee data. OneTrust Headquarters is based in Atlanta, Georgia.
With the recognition of several industry awards, membership in the Cloud Security Alliance (CSA), and the International Association of Privacy Professionals (IAPP), OneTrust has imposed itself as an authority on protecting personal information around the globe.
Crowdstrike
CrowdStrike is one of the modern and advanced cybersecurity companies tracing its base back to Sunnyvale, California. Founded in 2011, the company has been running as a modern technology service provider for cloud-native security and solutions, including, among others, endpoint protections as well as threat intelligence on a national and international basis.
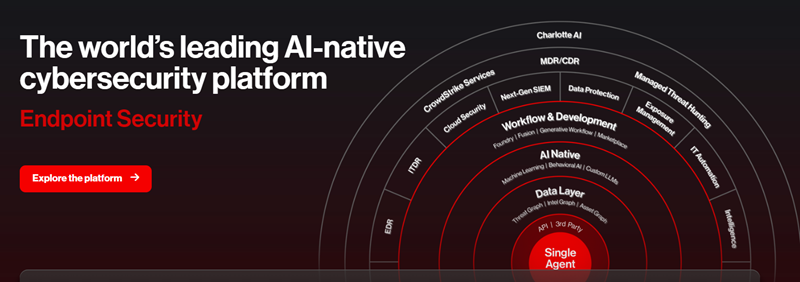
Using cutting-edge cloud-native platforms with revolutionary artificial intelligence and machine learning, the company is determined to detect cyber threats promptly and in a more efficient manner.
The platform is designed to allow easy deployment, management, and automation of work with advanced models trained on daily trillions of data points.
Its Falcon product is designed specifically with the intention of securing endpoints across varied environments. It uses real-time threat intelligence across the enterprise in its improved telemetry, hence guaranteeing ultra-precise detections that are, in both protection and remediation, automated effectively.
Cloudflare
Cloudflare is the worldwide leader in web security, content delivery, and distributed domain name server (DNS) solutions. They have a platform that allows business owners to protect, improve, and secure websites and applications through DDoS protection, secure socket layer (SSL) encryption, and Content Delivery Network (CDN).

Its Security Access Service Edge (SASE) and Software-Defined Solutions (SDS) services secure your employees, contractors, devices, networks, applications, and data wherever they may be – ensuring top-notch digital security for your customers every time.
Further, with compute storage and networking capabilities incorporated, it is easy for developers to build full-stack applications across multiple platforms quickly and securely. With data centers located virtually all over the world, Cloudflare ensures swift response times, guaranteeing reliable service provision from their headquarters in San Francisco, California, USA.
F5
F5 Networks offers a comprehensive package of solutions to secure, deliver, and optimize every app and API so businesses can continue to move forward. Their advanced web application protection reduces risk complexity while protecting against fraud abuse with zero trust security.

Additionally, they provide superior performance for applications and networks and modernized delivery systems designed for optimal customer experience.
With headquarters in Seattle, Washington (USA), F5 delivers extraordinary digital experiences through automation, security, performance, and insight technology to reduce costs, improve operations and protect users.
Over the years, F5 has established itself as one of the leading providers in this space.
Invicti
Invicti is a global leader in application security, enabling many of the world’s largest enterprises to deliver secure applications and APIs throughout all phases of software development.
With Invicti’s automated security testing tools stitched into your SDLC at every stage, you’ll be able to keep pace with a fast-evolving cybersecurity landscape while maintaining an integrated view of app vulnerabilities and remediation across the deployment environment.
Invicti identifies consistently more than other scanning tools, all the while returning fewer ‘false positives’ – helping teams reduce their vulnerabilities at a scale.
It empowers over 35 hundred organizations to protect against cyber threats and continuously enhance their application through every stage of development. Its impressive clientele includes NASA, Samsung, IBM, and Verizon, amongst others. Invicti is founded in San Francisco, USA.
Juniper
Juniper is an industry leader when it comes to security solutions, providing customers with powerful visibility, intelligence, and enforcement capabilities. Its innovative and AI-powered solutions allow organizations to monitor activity on their networks in real time and respond quickly to emerging threats before they cause damage.

Juniper Security Solutions Next-Generation Firewalls provide more than just static security; they identify and control applications and user access to prevent threats at the edge.
Its SD-WAN solutions, Zero Trust Data Center solution, and SASE ensure optimized client experience and unmatched threat detection, prevention, and mitigation levels and automatically address attacks.
The company is headquartered in Sunnyvale, California.
Broadcom
Symantec Enterprise Cloud by Broadcom is a resilient hybrid security solution on a data-centric platform, providing better anti-malware protection against cybersecurity threats.
These offer defense to protect organizational critical systems and devices for their clients using their robust features crafted for operations at scale in complexity.

Broadcom has unveiled its complete suite of cybersecurity portfolios aimed at protecting organizations from cyber-attacks.
The suite covers endpoint security, network security, email security, and information protection, seemingly to guarantee data for any employee regardless of their location or the type of device they use attached to their work.
Together with a partner, the company offers Symantec Enterprise Cloud that continuously can control corporate assets to make actions in case of necessity.
Having many years on the market, Broadcom is a reliable partner for any type of organization, with the purpose of protecting its networks from threats. The headquarters of cybersecurity of Broadcom is located in San Jose, California, USA.
Check Point
Check Point is an Israeli provider of IT security solutions Headquartered in Tel Aviv, Israel. Recognized for its role in pioneering cybersecurity, including hardware and software products, Check Point offers a solution known as Check Point Infinity to protect networks, cloud, and mobile environments from Gen V cyber threats and zero-day attacks.

With decades of experience developing, marketing, and supporting reliable security options that safeguard organizations of all sizes against network security threats, it’s no wonder this company continues to lead the industry forward in protecting valuable data from harm.
Check Point’s commitment to excellence has made them one of the most trusted names in cybersecurity today.
Mcafee

Using state-of-the-art AI technology, its protection scans for text scams and blocks dangerous links from emails, social media platforms, and other internet destinations – providing tailored identity protection to each member of your family.
Its coverage also includes VPNs and Protection Score for complete peace of mind while browsing the web.
Based in San Jose, California – USA, McAfee combines exceptional technology and years of experience in delivering the industry’s leading antivirus protection and cloud security solutions that help empower users to stay safe from malware attacks, phishing attempts, and data breaches, among others.
Trend Micro
Trend Micro provides a comprehensive cybersecurity platform that enables businesses to quickly leverage advanced XDR capabilities for improved SOC efficiency and increased business value. This platform grants security teams powerful tools across attack surface management, detection, investigation, and response activities.
The platform safeguards over 500k organizations and 250 million users across networks, clouds, devices, and endpoints.
Its cloud enterprise cybersecurity offers complete visibility with rapid detection and response capabilities, plus multiple layers of advanced defense tailored for popular cloud environments.
This security solution helps businesses detect and respond to today’s threats faster while mitigating risk, securing their borderless workforces, hybrid multi-cloud worlds, and cloud-native apps while eliminating network blind spots.
Located in Tokyo, Japan, since its founding over three decades ago, Trend Micro continues to provide businesses worldwide peace of mind when it comes to cybersecurity protection.
Trellix
Trellix is the trusted choice of leading global organizations, providing revolutionary threat detection and response capabilities. Their AI-powered XDR platform reduces the time to detect and respond to cyber-attacks while helping reduce alert noise from traditional cybersecurity solutions.

Furthermore, Trellix helps inform and implement Zero Trust Strategies quickly with comprehensive telemetry data and automates safeguarding processes for hybrid/multi-cloud infrastructure protection to increase operational efficiency and create a more effective SOC.
Its XDR platform strengthens your security posture and protects your organization through Endpoint Security, Data Protection, Network Security, Threat Intelligence, Cloud Security, SecOps and Analytics, etc.
Trellix’s headquarters is located in Milpitas, California.
Kaspersky

In its portfolio, it has award-winning antivirus and security products, such as endpoint protection, threat intelligence, and internet security suites, and all these solutions provide superior protection across multiple platforms to detect cybercriminals’ malicious activities like malware or ransomware.
The corporate headquarters is based in Moscow, Russia, since 1997. Kaspersky uses the latest AI technology to detect and stop threats before they attack your surface.
Its solutions are useful in protecting personal digital devices through antivirus, Small office security, Endpoint security cloud, Secure VPN connection, Threat management and defense, Hybrid Cloud security, and other cybersecurity solutions.
CyberArk
CyberArk is a privileged access management (PAM) company that offers solutions to securely manage and protect access to sensitive systems and information. Headquartered in Newton, Massachusetts, USA, the company strives for excellence by providing cutting-edge PAM protection services globally.
The CyberArk identity security platform provides unprecedented visibility and control to seamlessly secure identities from onboarding to offboarding across any resource on any infrastructure.
Leveraging robust Secure Single Sign-On (SSO), Adaptive Multi-Factor Authentication (MFA), User Behavior Analytics, Lifecycle Management, and Directory Services, you can quickly give users safe access to cloud, hybrid, or on-premises resources.
Its intelligent privilege controls secure enterprise workforce user accounts/data and third-party vendors, along with endpoints and machine identities, so sensitive data remains protected against malicious actors.
Sophos
With over 30 years of experience,
As one of the world’s leading cybersecurity companies, they are headquartered in Abingdon – United Kingdom.
Sophos provides proactive threat hunting, investigation, and incident response services to organizations of all sizes. Its elite team of experienced hunters offers a fully-managed MDR service or self-managed security operations platform for superior outcomes in cybersecurity with integrations into existing IT stacks such as SOAR, SIEM, ITSM, etc.
Stop being overwhelmed by alerts – shift resources towards the most strategic issues and get more value from investments with Sophos’ 3rd party integration tools that include RMM/PSA, too.
Qualys
Qualys is a cybersecurity provider of cloud-based security and compliance solutions specializing in its niche and headquarters located in Foster City, California. It provides unequaled visibility, speed, and scale to automatically detect vulnerabilities and critical misconfigurations across any hybrid environment of any size.
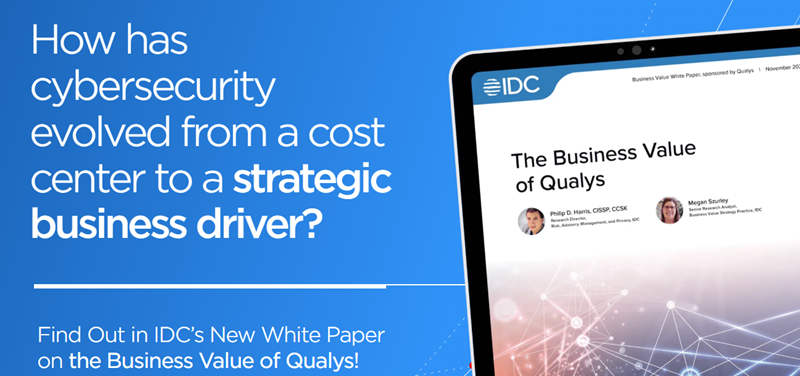
Using advanced correlation machine learning technologies, the platform identifies hundreds or even thousands of potential threats in mere seconds and prioritizes risks on your most important assets for fast remediation.
Stay alert with Six Sigma accuracy on zero-day vulnerabilities or suspicious activity on a real-time basis and data sharing between apps supported through native integration for rapid analysis and correlation – keep overall control of cyber security in a dynamic and evolving threat landscape.
Rapid7
Rapid7 provides an end-to-end, comprehensive cybersecurity platform for cloud and on-premises environments, from risk and threat response to digital forensics and incident response.

With a practitioner–first approach, the company offers solutions such as XDR and SIEM, Cloud Security alongside dedicated tools in Vulnerability Management, Threat Intelligence Penetration Testing, Dynamic Application Security along with Orchestration Automation (SOAR), offering effective power no matter your organization size.
Their user-friendly approach to security features analytics is designed to enable businesses to proactively manage potential threats. With headquarters in Boston, Massachusetts, USA., Rapid7 has been the go-to provider of top-quality cyber risk mitigation services for many years.
Proofpoint
Proofpoint provides the world’s largest companies with email and identity-based cybersecurity solutions that help to protect their employees from advanced threats, data theft, and insider risks.

With its NexusAI machine learning technology, organizations can break the attack chain by effectively defending against malicious emails while improving visibility into who is being attacked and how.
The company provides comprehensive detection of more threats accurately using ML and behavioral analytics and reduces your team’s workload for increased efficiency.
As one of the most trusted threat protection solution providers in Fortune 100, Fortune 1000, and Global 2000 companies utilizing Microsoft 365, you can trust Proofpoint to keep your people secure. The company is based out of sunny Sunnyvale, California, USA.
Tanium
Tanium is a trusted cybersecurity and systems management provider headquartered in Emeryville, California.
Tanium delivers superior value to leading organizations, helping them protect their most business-critical assets with the Tanium XEM platform. Its endpoint management solutions provide speed and scale, enabling IT lifecycles while our risk and compliance services ensure secure exposures when needed.
The platform offers real-time visibility of endpoints that help organizations manage and secure their digital environment while offering unmatched scalability, speed, and flexibility for addressing security concerns within large or complex networks. Tanium’s headquarters is located in Washington, United States.
Through expediting security teams’ incident response capabilities as well as delivering delightful digital employee experiences, the company is central in protecting modern enterprises.
SentinelOne
SentinelOne is a security solution to protect businesses from threats across their entire attack surface. With AI-powered endpoint protection, cloud workloads and identities secured in real time, 24/7 threat-hunting operations, and managed services available around the clock, SentinelOne ensures complete defense against malicious activity with the Power of AI.

Built on a sophisticated artificial intelligence and machine learning engine, SentinelOne’s Singularity Platform supercharges your teams’ ability to rapidly turn mountains of information into actionable insights and respond in real-time.
The company headquarters is based in Mountain View, California, USA. SentinelOne delivers next-gen protection, endpoint detection and response (EDR), and automated threat-hunting services for businesses looking to stay safe from data breaches or malicious activities.
Bitdefender
Bitdefender is an award-winning cybersecurity leader providing the highest level of security products and threat intelligence to people, homes, businesses, devices, networks, and cloud services.
Their products use the latest technologies like machine learning and behavioral analytics to detect malware, viruses, ransomware attacks, or sophisticated hacks, enabling customers, from individuals up to enterprises, a multi-layer defense system.

Headquartered in Bucharest, Romania, Bitdefender provides security products, such as antivirus software, internet protection tools, and endpoint defense coverage for businesses worldwide.
Bitdefender has earned a reputation as one of the most trusted providers in its field from independent testing organizations, industry analyst firms, and media outlets worldwide.
Imperva
Imperva delivers security and performance services that protect applications, networks, and data from malicious attacks. Its robust platform provides automated protection for API-based systems against Distributed Denial of Service (DDoS), bot activity, supply chain risk management, and secure sensitive data across on-premises and cloud environments while simplifying compliance reporting & audit processes.

Moreover, it ensures DNS resolution at the edge for seamless operations as well as enhances application performances by providing cost-effective solutions to support DevOps initiatives without compromising on safety standards.
With their headquarters located in Redwood City, California – USA – Imperva provides comprehensive protection for businesses of all sizes across the world.
Mimecast
A company, Mimecast, specializes in cloud-based email security, archiving, and risk management services. Its range of products arm businesses with advanced threat protection, URL filtering, and data loss prevention to ward off phishing attacks, malware threats, and other malicious activity.

Additionally, Mimecast’s archived emails are securely stored for compliance and e-discovery needs. Moreover, cyber resilience solutions assist organizations in managing their cyber risks by providing continuity during outages or possible breaches, thus ensuring quick bounceback from downtime damage.
Originating in London, United Kingdom, this multinational provides elusive answers to existing problems posed by the modern digital environment, giving its customers a secure connection they can rely on.
Barracuda
Barracuda Networks is a well-known company that provides cybersecurity and data protection solutions designed to protect businesses from the broad spectrum of cyber threats.

Its range of solutions includes email security, network and application defense, backup and recovery, and cloud security, all boasting user-friendly interfaces and scalability no matter your organization’s size – Barracuda has you covered.
Experience peace of mind with Barracuda as they work to secure organizations against phishing attacks, emails, or malware threats while ensuring business continuity in case any issues arise related to data loss or system failure.
The company is based out of Campbell, California, USA.
1Password

The platform integrates major web browsers and mobile devices, whereby zero-knowledge security initiatives are embedded to guarantee the privacy of client data from access by parties not authorized by owners to access encrypted data.
It also provides enterprise solutions, and businesses ensure high-priority solutions for the improvement of collaboration between employees in sharing sensitive information such as passwords or credit card details over a network.
The Company is situated in Toronto (Canada).
Auth0
Auth0 is one of the leading identity management and authentication platforms that provide secured login experiences for APIs and applications to users, developers, and enterprises.

The services include single sign-on (SSO), multifactor authentication (MFA), user management, and enterprise credentials or custom connections enabling access with any device – from web to mobile to Internet of Things.
Powered by its scalability and flexibility features, Auth0 empowers businesses with solutions meant for both business-to-consumer (B2C)-based as well as for the various requirements of business-to-business.
The company has gained global recognition with its headquarters in Bellevue, Washington, USA.
Illumio
Illumio’s Zero Trust Segmentation Platform is the ideal solution for breach containment, providing intuitive visualization of all communication between workloads and devices.

Illumio offers Adaptive Security Platforms that improve the security and visibility of data and applications through its granular segmentation policies to control communications. You can easily isolate highly-valued assets to stop future breaches or ransomware attacks from spreading.
Through real-time monitoring and dynamic policy implementation, their platform prevents threats from moving laterally within networks while providing a complete understanding of workload communication across on-premises environments as well as cloud infrastructures or hybrid ones. The company has headquarters in Sunnyvale, California.
Malwarebytes
With their flagship anti-malware and anti-spyware solutions, they provide broad protection against the latest cyber threats such as viruses, Trojans, worms, ransomware, and spyware by offering key features like real-time threat detection and removal of malware or potentially unwanted programs for both consumers and businesses alike.

Malwarebytes provides advanced cybersecurity solutions by adopting heuristic scanning and behavioral analysis to detect emerging threats, catering to individual users and businesses alike.
Its straightforward approach offers protection for Windows, Mac, Android, and iOS devices, focusing on keeping security simple yet highly effective – making it well-known within the industry as one of the top contenders in malware prevention.
Varonis
Varonis specializes in data security and analytics, headquartered in New York, USA. Varonis products and services help organizations protect their data from cyberattacks, insider threats, and human error.

Varonis’ core product is the Varonis Data Security Platform, which provides a unified view of all of an organization’s data, regardless of storage, implementation, and enforcement of governance policies.
The Varonis Data Security Platform uses AI and ML to identify and classify sensitive data, detect suspicious activity, and prevent unauthorized access.
Its other features include auditing capabilities to investigate potential security incidents, automated real-time monitoring and prevention, etc.
Webroot
Webroot is a trusted leader providing award-winning antivirus solutions. Its cloud platform offers robust real-time threat intelligence and intelligent endpoint protection to defend against ever-evolving cyber threats.

The company prides itself on its advanced behavioral analysis using ML algorithms to detect unknown malware infections and malicious activities across devices such as computers, laptops, or mobile phones.
With multi-vector protection, a wide range of products and services designed for both business and personal environments, and an industry-leading threat intelligence network that keeps it ahead of emerging threats, Webroot is the go-to platform for comprehensive online security.
With the assurance that you are protected by one of the industry’s leading cybersecurity companies headquartered in Broomfield, Colorado, USA – Webroot ensures your business remains secure at all times.
Sucuri
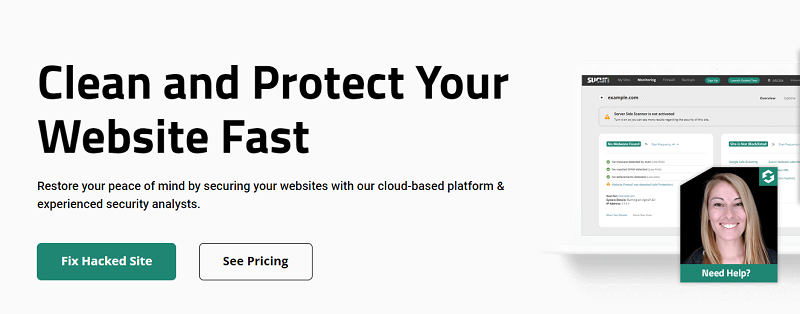
It offers a range of security solutions such as website firewalls, malware detection and removal services, continuous monitoring for potential threats, content delivery networks to enhance performance and security, and incident response assistance.
With widespread experience and being in this field for decades, it protects businesses worldwide from cyber threats and ensures safe digital operations with reliable protection.
Astra
Astra Security is a cybersecurity company headquartered in San Francisco, California, focusing on website security solutions. The platform protects websites from various malicious cyber threats such as SQL injection, cross-site scripting, Malware, etc.

The One-of-a-kind Pentest platform is used by 650+ modern engineering teams, offering manual pen tests as well as hacker-style offensive pentesting adhering to OWASP, SANS, and CREST standards.
Its tests cover 8000+ vulnerabilities, including OWASP & SANS industry standards, helping you shift from DevOps into a secure DevSecOps model while attaining compliance for ISO/SOC2/GDPR/HIPAA regulations by scanning your critical APIs through both automated and manual testing processes.
Its efficient security suite includes a firewall for preventing illegal access attempts, a malware scanner that regularly checks and removes any malicious code discovered on your website or application, and DDoS protection services that guarantee the availability and uptime of your web pages.
Indusface
Indusface is an application security company headquartered in Bengaluru, India, specializing in cloud-based solutions to protect web applications, APIs, and mobile apps from cyberattacks.
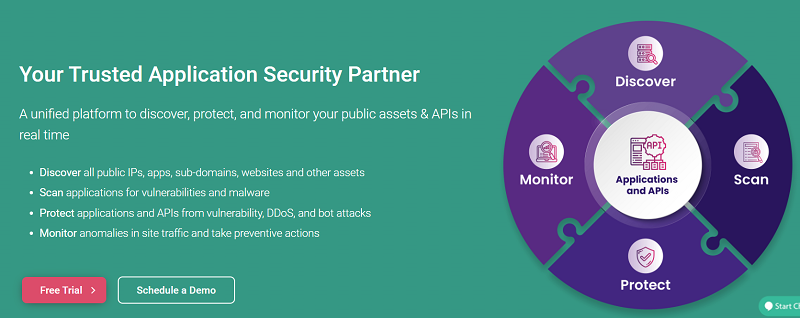
Its advanced suite of products helps organizations identify vulnerabilities, mitigate DDoS attacks, and ensure compliance with industry regulations.
Their WAF solution provides the highest level of defense against SQL injection and various other malicious attacks while also providing DDoS protection to guard websites from crippling downtime as well as robust vulnerability scanning.
Furthermore, their suite includes API security to protect resources connected with any type of service interface, such as JSON and SOAP, from OWASP’s top 10 vulnerabilities.
Advanced malware detection on mobile devices alongside reverse engineering prevention makes it an all-inclusive cybersecurity platform, filling every gap caused by increased attack surface area.
Perimeter81

Multi-cloud environments are also supported by us, offering strong security to ensure peace of mind.
Perimeter 81 is SOC 2 Type 2, GDPR, CCPA, and ISO 27001 compliant to ensure secure data storage with the highest standards of software security.
Perimeter 81 offers advanced security protocols like encryption and two-factor authentication with a user-friendly interface designed to replace traditional VPNs. Organizations can manage and monitor user access securely whilst effortlessly adapting to the demands of remote/distributed workforces.
NordLayer

NordLayer offers flexible, secure, and affordable Zero Trust Network Access (ZTNA) solutions for businesses. With dedicated IP address options available upon request, this VPN service is optimal for businesses needing robust online protection.
Its centralized management console makes administration of user access and network settings simple, while its global server network provides reliable high-speed connections for distributed teams worldwide. NordLayer’s secure operations are designed to enhance overall organizational security and flexibility without sacrificing usability or speed.
NordLayer is a VPN service provider headquartered in Panama, offering robust solutions to protect data privacy and communications over the internet.
Avast
All products are designed to provide real-time protection against malware, ransomware, and phishing attacks for users worldwide.

Avast provides reliable digital protection with its range of software solutions, such as cybersecurity solutions for both PC and mobile users, emphasizing free antivirus and VPN services.
Its Mobile Security app (over 435 million downloads) ensures safety on Android devices; users can feel secure with their digital security needs taken care of by a world leader in cyber-protection.
From firewall capabilities to advanced threat detection technology via artificial intelligence and machine learning, Avast is dedicated to keeping users safe from malicious threats on their web browsers, Wi-Fi networks, or any other online activity.
A10 Networks
A10 Networks is a specialized advanced application networking and security solutions provider. Its Thunder platform offers distributed denial-of-service (DDoS) protection and secure application access with its cutting-edge Application Delivery Controller (ADC).
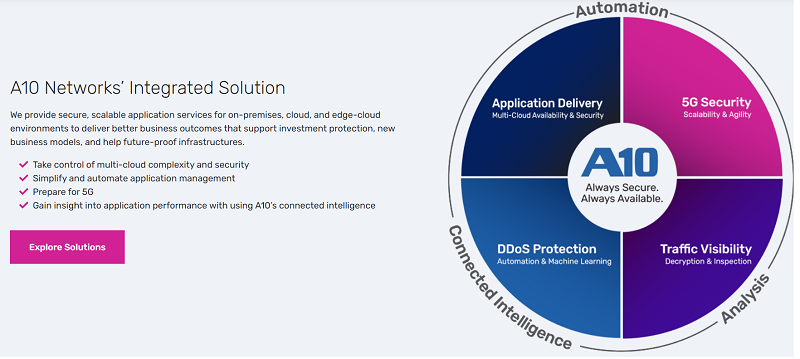
This global technology company is based out of San Jose, California. With state-of-the-art load balancing functions to effectively increase the performance levels of applications, A10 helps customers stay ahead in an ever-changing digital world.
It provides an integrated solution to help customers secure, scale, and simplify application services for on-premises, cloud, or edge-cloud environments.
Its intelligence-driven platform helps unlock business advantages and prepare infrastructure deployments for 5G while providing insight into performance analytics, allowing businesses insights that drive better outcomes.
Forcepoint
Forcepoint is the leading global cybersecurity company that, through the Security Service Edge (SSE) platform, based in the cloud and located in Austin, Texas, applies unparalleled systems that enable broad coverage across devices, networks, and applications.
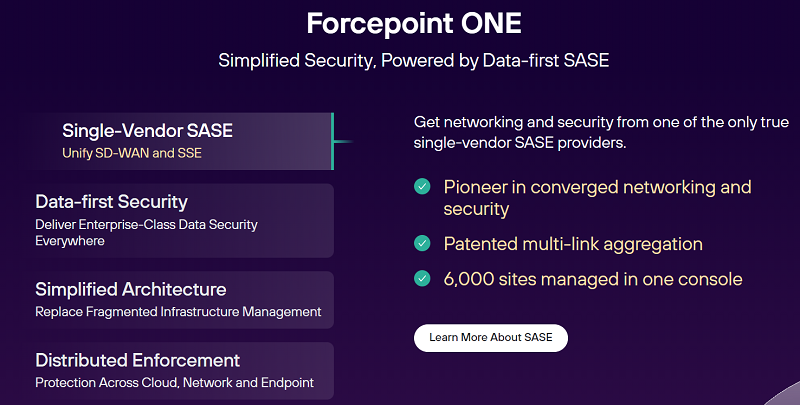
Forcepoint’s security product portfolio includes web security, data loss prevention (DLP), cloud security, and insider threat protection that leverage technological prowess in areas such as behavioral analytics and ML to identify threats before they can materialize with alacrity.
Forcepoint Dynamic Data Protection is an adaptive security platform that lets users gain visibility across deployments, protecting data and network on-premise in the cloud or anywhere in between. Organizational risk posture changes constantly, and Dynamic Data Protection shifts security controls based on current risk.
Tenable

By combining visibility of the attack surface, business context, and predictive technology, Tenable enables organizations to accurately assess their cyber risks while prioritizing strategies for prevention before attackers can exploit vulnerabilities.
Its external attack surface management (EASM) feature further provides full mapping capabilities across the organization’s internet domains, helping identify and secure unknown assets.
Tenable headquarters is based in Columbia, Maryland. Powered by Tenable Research to predict what matters, organizations can stay ahead of attackers and address security risks before they have the chance to exploit them.
Detectify
Detectify is an experienced External Attack Surface Management (EASM) solutions provider, offering an all-inclusive suite of solutions for organizations to identify, evaluate, and mitigate their external attack surface.
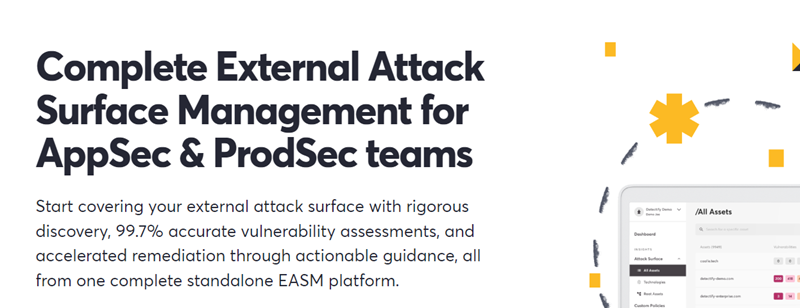
Its solutions include monitoring threat exposure on the internet via its proprietary engine, application vulnerability scanning that finds security flaws in web applications before attackers do, and security protection for digital assets against malicious actors.
Its testing discovers vulnerabilities such as OWASP Top Ten, SSL/TLS misconfigurations, and more to help organizations secure their applications quickly and effectively.
Detectify acts as a web application security tool that leverages global ethical hackers and research knowledge to continuously upgrade its scanning capabilities. It can be easily integrated into DevOps workflows and features an intuitive interface with actionable reports on vulnerability severity. The company is based in Stockholm, Sweden.
Probely
Probely is a modern web application and API vulnerability scanner capable of scanning traditional web applications, APIs, microservices, and standalone APIs.
Based in the Portuguese city of Porto, Probely offers flexible scanning features that grant users elaborate reporting on detected vulnerabilities, with elaboration on the severity of the issues and even a step-by-step explanation of how users can replicate and fix the corresponding vulnerability.
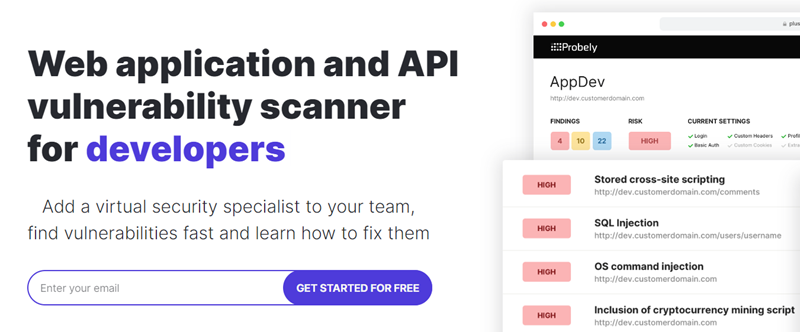
The tool also integrates easily into CI/CD pipelines, enabling automated scans, ensuring this is a dependable solution to all your security requirements.
Its dynamic scanning replicates the activities of real-world attacks for vulnerability detection and static analysis of source code for in-depth scrutiny.
It also provides actionable insights through its focus on automation and, hence, is an invaluable tool for organizations that seek to uplift their posture regarding the security of web applications.
Intruder
Intruder is a cloud-based vulnerability management platform that delivers high levels of protection to identify and remediate security risks in IT infrastructure.
Intruder is headquartered in England, but it has customers worldwide. It helps organizations secure their attack surface by providing automated vulnerability scanning, continuous network monitoring, and proactive threat response, and it is widely recognized for its excellence.

Its Smart Recon feature increases security while reducing costs through intelligent asset grouping and scanning only when changes occur – providing up to 40% savings on scan run time.
Its advanced scanning technology enables you to identify vulnerabilities in your IT infrastructure and prioritize them according to their severity level so you can focus on the most critical first and then provide fast remediation with our integrated ticketing systems or SOAR platforms.
Arnica
Arnica is a software supply chain security company that offers a pipeline-less security platform to scan applications for potential threats. Located in Mountain View, California, Arnica prides itself on its unique feature of being able to detect and mitigate hardcoded secrets quickly and accurately.

Arnica’s pipeline-less security platform helps businesses protect their applications during every software development lifecycle (SDLC) step. It provides real-time scanning capabilities, including secret detection, a Software Bill Of Materials generator, automated developer access control, and anomalous behavior detection within popular workflow tools.
Simplifying integration into existing systems while delivering critical solutions to secure code from external risks like license compliance issues and more – Arnica safeguards against all angles for maximum protection assurance without slowing down peak velocity processes throughout the SDLC journey.
Yubico
Yubico is specialized in hardware authentication devices like the YubiKey. This award-winning YubiKey provides robust two-factor and multi-factor authentication (2FA & MFA), allowing companies to securely protect their identities online.

Headquartered in Palo Alto, California, with additional offices in Sweden and the UK, Yubico’s solutions are trusted by millions of people around the world for their enhanced protection features, which help reduce support costs as well as provide peace of mind when it comes to modern digital security protocols.
Yubico’s reliable YubiKey authentication systems give users the flexibility to securely authenticate across multiple services and platforms. Experience stronger account security through YubiKeys’ support of U2F, FIDO 2, and OTP protocols for improved convenience while maintaining maximum safety standards.
Commvault
Commvault is a data protection and management multinational firm based in Tinton Falls, New Jersey, USA. The firm attempts to provide services to its customers by providing complete backup, recovery, and management of data solutions over on-premises and cloud environments.
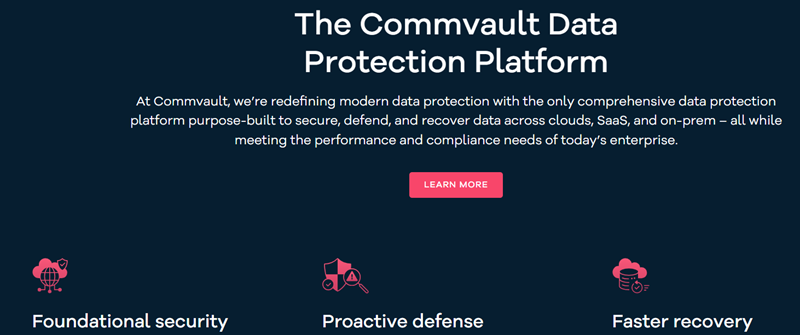
Commvault’s solutions help to manage the data effectively in organizations, mitigate risks, and ensure a state of availability for the data.
Its cloud-native solution ensures that organizations can safely access both SaaS applications and their on-premises infrastructure with storage security, allowing them to satisfy their performance needs.
Its all-inclusive solution simplifies the modern complexities of data management by streamlining operations while offering support for wide-ranging diverse workloads and cloud-based infrastructures. Commvault’s focus on innovation guarantees that organizations stay ahead of their dynamic IT environments so they can be well-informed about their valuable data resources.
eset
eset provides antivirus and internet security solutions for individuals and businesses. Based in Bratislava, Slovakia, the company features offices worldwide, including the United States. With their advanced products, ESET safeguards customers from viruses, malware, ransomware, and phishing attacks to keep them safe online.

eset is renowned for its advanced heuristic technology, offering proactive protection from emerging threats. This behavioral analysis-based approach provides an extra layer of defense alongside eset’s lightweight yet powerful suite of antivirus and internet security solutions and endpoint protection tailored to businesses.
Its global presence makes eset a reliable choice for individuals and businesses seeking protection from ever-changing cyberspace dangers.
Heimdal
Heimdal is the only cybersecurity suite to secure your organization from advanced threat detection and response to defending your endpoints, network, identity, and email ease against all cyber threats.

It has added solutions for vulnerability management, privileged access management, endpoint security, email security, and fraud prevention. It adds an extra layer of defense to lock your system down away from unexpected damage like evasive malware and targeted attacks from the advanced threat landscape.
Heimdal Security’s Thor Vigilance is a multi-layered endpoint security product with proprietary artificial intelligence and machine learning technologies to prevent, detect, and block even the newest and most dangerous cyber threats in real-time.
The Denmark-based Heimdal Security is an awarded firm for offering developed attention to creating a proactive cyber security solution.
Bark
Bark is a technological company oriented to online safety solutions for families and schools. Stationed in Atlanta, Georgia, the company uses a monitoring platform featuring an advanced, sophisticated algorithm capable of detecting all sorts of digital communications through different platforms like social media channels, messaging apps, or mail accounts.
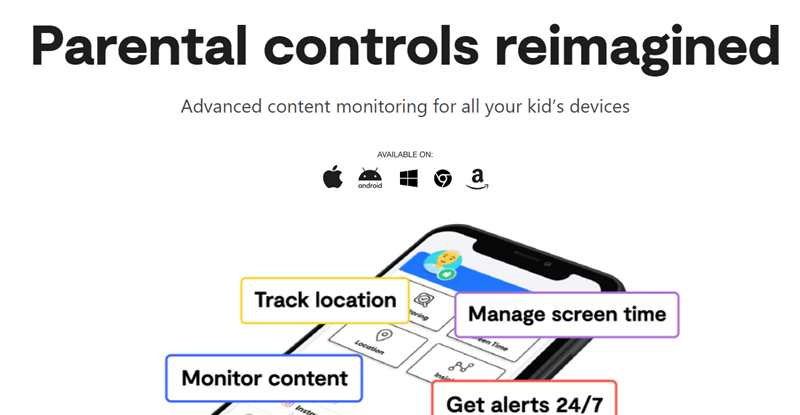
Bark’s monitoring service is unlike any other as it revives the largest number of platforms, scanning 30+ for potential risks and/or issues. You can either block certain apps at a specific time scale or simply allow access to blocked apps and websites and manage screen time, plus track your children’s location quickly and effortlessly.
The advanced technology sends notifications to parents if any issues pertaining to their kids arise, like cyberbullying or contact with possible online predators, notifying them about its relevance so that they can take measures to protect their children on the internet.
SafeDNS
SafeDNS is one of the many cloud-based DNS filtering services in an attempt to raise online security for the likes of businesses, corporations, educational places, and many more.
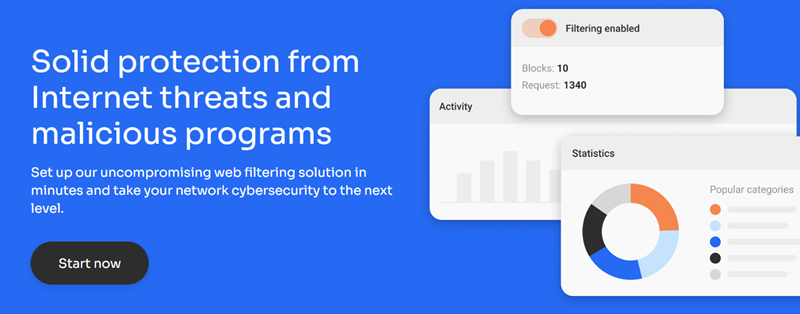
With its offices located in Prague and having a worldwide spread cyber protection footprint, SafeDNS was founded in 2015 to deliver trustworthy AI and ML-based solutions to recognize and forbid access to such harmful content as phishing attacks, malware scams, or any other unacceptable material online ensuring cybersecurity presence around user activities in the virtual space.
They provide a huge list of DNS protective features, including content filtering, instant deployment, detailed reporting, and much more – ensuring users are safe when online against malware, phishing attempts, or being exposed to inappropriate content.
It is reliable and efficient for customers of all sorts, from individual home users to large business organizations, from educational establishments to incorporated companies and non-profit organizations.
TitanHq
TitanHQ provides cloud-based cybersecurity solutions based in Galway, Ireland. TitanHQ provides layered security solutions, including anti-spam email protection, DNS content filtering, proactive phishing prevention strategies, secure archiving for Microsoft 365 applications, training courses on security awareness, and much more – all designed to keep companies safe online.

The company provides businesses with robust web filtering and threat protection for secure, productive internet usage. Their cloud-based platform ensures easy deployment of their solutions across distributed networks, which are especially useful to MSPs who can deliver scalable security services to clients.
With a clientele that extends across education, healthcare, and finance industries, they guarantee top security standards for companies of any size.
NextDNS
NextDNS gives an opportunity for better security and privacy to people in their internet browsing. It was developed with a view of providing better protection from all types of threats related to security as well as against undesired ads online.
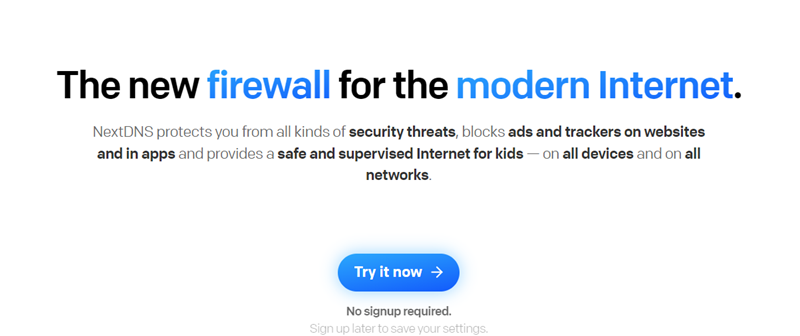
Their headquarters are based in Paris. Their analytics give real-time device activity insight while protecting the users from attacks such as malware, phishing attempts, cryptojacking, or any other problem emanating from the internet. Their encrypted DNS queries promise to enhance user confidentiality by supporting DoH and DoT, thus guaranteeing secure communication between the client’s device and the server with no risk of eavesdropping on queries.
The intuitive interface offers an easy way to configure, customize, and monitor the DNS filtering settings, like blocking specific types of content and setting up white/black lists across all devices with absolute privacy.
Cisco
Cisco is a long-established, market-leading multinational technology conglomerate headquartered in San Jose, California. Having pioneered networking hardware, software, and telecommunications equipment over the years, they have become renowned for their innovative solutions to IT problems worldwide – from cybersecurity to cloud infrastructure and collaboration tools.

Cisco’s intent-based networking leverages machine learning and automation for enhanced network performance, protection, and intelligence. This cutting-edge technology allows networks to learn from their environment in order to adapt proactively for improved security solutions while optimizing operations along the way.
Cisco is a leading global provider of reliable and innovative networking solutions, with operations in business, government service providers, and small and medium enterprises.
Link11
Link11 is an internationally based company for cybersecurity with headquarters located in Frankfurt am Main, Germany. Since 2011, the commitment of the company has been to protect companies of all sizes and from any industry as a leading authority regarding DDoS protection, using multiple technologies ahead of current threats.

The Link11 services portfolio includes Infrastructure DDoS Protection, Web DDoS Protection, Secure CDN, Bot Management, Secure DNS, and industry-specific Zero Touch WAF services.
Its advanced Al and machine learning techniques analyze incoming traffic patterns, delivering immediate detection of malicious activity while protecting legitimate data. With Link11’s adaptive approach to security, companies can be sure of dependable defense against evolving threats in an ever-changing landscape.
Sitelock
For over a decade, SiteLock has provided comprehensive website security solutions to businesses of all sizes. The company offers an array of features designed to protect websites from various cyber threats, including malware, DDoS attacks, and other vulnerabilities while improving the overall performance of the website.
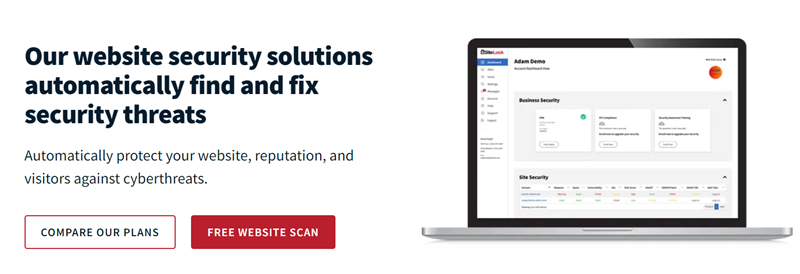
The company offers automated scanning and malware removal, intuitive user interfaces, web application firewall protection, as well as vulnerability detection and acceleration services. Business owners can trust that their online presence is secure with SiteLock’s comprehensive suite of cybersecurity tools.
Based in Scottsdale, Arizona, USA, SiteLock offers a comprehensive range of website security solutions, which include scanning, backup provisions, content delivery networks, and vulnerability assessment – all designed to ensure protection and resilience for online assets.
Veriff
Veriff is an AI-driven company that provides secure identity verification tools in real time using a myriad of different secure methods. Services include those tailored to industries such as finance, e-commerce, and various other industries for unified proofing experiences.

With powerful facial recognition technology backed by unmatched document verification technology, the company ensures the highest accuracy in its identity verification solution, ensuring absolute regulatory compliance.
Veriff helps businesses build a safe online experience, with compliance to CCPA/CPRA, GDPR, SOC2 type II, ISO 27001, and WCAG Accessibility Guidelines, as it gives insights into the patterns of fraud.
The company is based in Tallinn, Estonia. With advanced technology providing a secure yet efficient solution to verify identities, Veriff has devised one of the best-growing secure identification solutions.
IdentityGuard
IdentityGuard is one of the most known market providers offering identity protection services and dark web monitoring with the backup of industry-leading insurance for fraud resolution. The company assists people in making sure their personalities are not stolen or misused.

Identity Guard ensures safety in a digital world for people and comes with necessary features such as real-time alerts, dark web monitoring, and even credit score tracking services.
It is designed to keep your data safe 24/7, focusing on monitoring the dark web for indicators of compromises of personal information. They supply proactive notifications in case they find our data appeared in cybercriminal places, and also $1M identity theft insurance to give additional financial protection against incidents.
Based in Chantilly, Virginia (USA), the company specializes in rendering advanced tools providing personal information protection and financial well-being.
Google Transparency
Google Transparency comes as a mechanism developed by Google to release the intentions of government requests for user data and content removal. It contains a desktop that introduces dashboards and makes available bountiful reports on an extensive series of transparency issues.

It allows for exploring detailed information about the number and types of requests received from governments or copyright owners worldwide.
This report’s guidelines will help the user to better understand government requests for user data along with the enforcement of YouTube Community Guidelines and Safe Browsing Site Status.
The report allows the public to access vital information that will evolve over time. Visitors are advised to log into its website to check back often to get the latest update through its commitment to being transparent.
But this will be an unparalleled initiative to reflect Google’s commitment toward both the right of privacy and freedom of expression, although headquartered in Mountain View, California, USA.
RedSift
RedSift is a leading global vendor of cloud-native cybersecurity products whose platforms have ranked the highest for innovation in email security and threat intelligence. The platform is cloud-native and exploits machine learning as well as data analytics in enhancing protection against threats, detection capability, and insights through analytics.

Expanding its offering for specific use cases, developers will be able to exploit the open-source nature of Red Sift in developing personalized apps.
OnDMARC (Domain-based Message Authentication, Reporting, and Conformance) by RedSift has set out to help organizations pride new layers into their DMARC capability to fight against email phishing and spoofing.
It allows businesses to proactively monitor and enforce authentication policies that have a central role in lifting their brand protection without hurting the well-functioning of genuine email service by reducing false positives and negatives.
The company is located in London, UK, and they have established themselves globally regardless of geography or timezone.
Final Words
In today’s connected world, cybersecurity is one of the burning concerns for people, businesses, and even governments. As the dependence on digital technologies increases, the risk of cyberattacks becomes larger and might bring impossible financial, reputational, and sometimes physical harm to anyone.
While no cybersecurity solution or product can actually guarantee absolute protection, they help a great deal to considerably reduce the risk of cyberattacks and the degree of impact that security breaches can inflict once they occur. A business that has invested money into cybersecurity will be protected better in its information, assets, and reputation.
The above-discussed cyber security solutions, apart from saving individuals and organizations from getting harmed by the continuously changing threat landscape, will help them improve to a great deal in their cybersecurity postures.
Next, check out the most important basics of personal cyber security you must know.

