Observability is analyzing the data generated by your applications and your infrastructure to find faults, predict outages, and ensure your end customers are not affected.
Observability platforms are the tools that let you efficiently monitor your systems with the power of observability. They consume, transform, and monitor all system data generated by your applications and help you ensure everything is running in a healthy state.
The success of your modern business is highly impacted by data-driven decisions. From reducing operational costs to ensuring customer satisfaction, you must stay on top of your data game to stay ahead of your competitors.
Having a proper observability platform enables you to understand performance bottlenecks, improve processes, and solve problems faster. Additionally, analyzing the data generated by your infrastructure and applications helps you with your financial management, improve security, and reduce risks.
Now let’s take a look at the best observability platforms below.
- 1. BrowserStack
- 2. Datadog
- 3. Elastic Observability
- 4. Integrate.io
- 5. New Relic
- 6. Edge Delta
- 7. Bigeye
- 8. Acceldata
- 9. Dynatrace
- 10. Splunk
- 11. Decube
- 12. StackState
- 13. Honeycomb
- Show less
1. BrowserStack
BrowserStack’s Test Observability has emerged as a strong solution for enhancing testing processes through advanced monitoring and analytics. Their global platform unifies data from the entire tool stack to drive root cause analysis and derive actionable insights rooted in historical context.

Quality engineers and managers can monitor & optimize all end-to-end UI, API, and unit tests executed on any platform, even those outside BrowserStack.
Key Benefits of BrowserStack Test Observability and Reporting:
- Smart tagging automatically classifies failures as new or recurring, streamlining the triage process.
- AI-driven failure bucketing categorizes issues into product, environment, or automation bugs for faster diagnosis.
- Timeline debugging aggregates test run logs chronologically, ensuring context-switch-free debugging.
- Automatically detect and highlight flaky tests that produce inconsistent results.
- Implement automated build verification with customizable rules based on stability, new failures, and flakiness.
- Integrate with frameworks like Playwright, Jest, Pytest, Cypress, TestNG, Robot, Mocha, and WebdriverIO.
BrowserStack Test Observability offers a Free Plan, a Pro plan starting at $199/month, and a custom plan for Enterprises.
2. Datadog
Datadog provides you with a unified observability platform designed for the cloud age. Collect and correlate data from more than 600 vendor-backed technologies. Powered by AI, you get cutting-edge automated anomaly detection.

With end-to-end visibility across your entire system, you can track incidents, visualize server status across components, and optimize across your stack. Additionally, machine learning helps you detect performance issues.
Here are the top benefits of incorporating Datadog as your observability platform of choice:
- Ingest system data from multiple sources
- Create dashboards and customize them according to your visualization needs
- Get the support of AI and machine learning
- Identify the correct response by investigating down to the code
- Promote collaboration across teams on a single unified view
You can try a 14-day free trial with no credit card required.
3. Elastic Observability
Built on top of the industry-proven ELK stack (Elastic-Logstash-Kibana), Elastic Observability offers an open and extensible solution. Using this observability platform, you can tackle your workloads across multiple cloud environments, such as Amazon Web Solutions, Microsoft Azure, and Google Cloud.

Owing to its cloud-first approach, Elastic Observability lets you break your data silos across application logs, infrastructure information, and user metrics. With this, you get the following monitoring tools as a part of your observability platform:
- Centralized Application Log Monitoring that quickly searches through petabytes of data
- Code quality improvements using Application Performance Monitoring (APM)
- Simplified Infrastructure Monitoring that keeps your systems running at scale
- Track actual user interactions using Real User Monitoring
- Proactively monitor critical journeys using Synthetic Monitoring
You can start your free trial to check out the offerings. If you want to integrate via Elastic Cloud, you can get it for as low as $95 per month.
4. Integrate.io
Integrate.io provides a fully automated, flexible, and real-time data observability platform. With this, you can focus on your business rather than worrying about your data. All you need to give is the minimum access required to understand and observe your data systems.

If you have a data warehouse, then you only need to provide read-only access. Otherwise, for databases, you’ll need to provide the minimum access required by CDC (Change Data Capture) systems.
So, let’s take a look at the type of data alerts that you can set with the data observability platform:
- Count of null values and the total number of records in your columns
- Distinct, highest, and lowest values in each column
- The median and variance of any column
- Column skewness to calculate how evenly values are spread
- The geometric mean
- Difference between the current time and max value for freshness
This data observability platform comes with 3 pricing models – Starter for $15,000/year, Professional for $25,000/year, and Enterprise with custom pricing. You can try it out for free before making your choice.
5. New Relic
With 30+ capabilities built into one, New Relic provides you with an all-round observability platform – whether it’s for your front end, back end, or infrastructure. It offers you 600+ integrations for instant observability so that you can monitor everything on your stack.

What separates this observability platform from the rest is having your own observability assistant using the power of generative AI or GenAI. Known as New Relic Grok, this is the first-of-its-kind assistant to give you insights from all the data collected.
In brief, here’s what you get with the New Relic observability platform:
- An easy-to-install guided installer
- A single platform for full-stack monitoring
- Unified cross-platform experience to break data silos
- The power of AI assistance to help you understand your data
- Pay only for what you use
- Security compliance for all your data
You get three pricing options – Standard, Pro, and Enterprise. You can check out the Standard version and all its offerings for free. All you need to do is sign up to get started, with no credit card required.
6. Edge Delta
Are you looking for a modern observability platform that lets you maintain visibility on 100% of your data? Then, the Edge Delta platform can come to your aid. With this, you can monitor your systems at scale without the need to index all your raw data or store it in an observability platform.

Firstly, you get a simple point-and-click interface that lets you build your observability pipelines and test and iterate on them. You get transparency, control, and simplicity. Additionally, you can also monitor the pipeline health to ensure every component is working as expected.
Next, let’s take a quick look at the various features that the Edge Delta observability platform has to offer:
- Enrich and transform your data with 15+ pre-built data processors
- Cluster similar data into patterns and avoid indexing
- Track KPIs for your team by extracting metrics
- Stay on top of production issues by detecting anomalies
- Use a point-and-click interface to create your pipeline
- Manage your entire fleet from a centralized window
Get unlimited users and ingest for $0.12/GB. You can also try it for free for up to 10GB/day.
7. Bigeye
What sets Bigeye apart is its developer-focused tools and API-first approach. You get the power of deep customization that lets you integrate data observability on any stack.

With Bigeye-CLI, you can easily integrate Bigeye into your CI/CD process and configure metrics. Besides this, Bigeye also exposes REST API endpoints that you can leverage to extend the capabilities of your observability platform.
With Bigeye observability platform, you get the following benefits:
- Instant-on metadata monitoring
- Column-level profiling
- 70+ pre-built data quality metrics
- Best-in-class anomaly detection
- Automated alerts, which are adaptive
- Chat-based alert management
- Root cause and the root cause paths
- Dynamically generated debug queries
Additionally, Bigeye is strong on security with SOC2 Type II certification, anonymization, and strong SLAs. You can request a demo for a 30-minute briefing where you can see it in action.
8. Acceldata
Acceldata is an enterprise data observability solution that looks after your entire stack. With ML-driven automation, Acceldata helps you make the most out of your data while reducing your data costs. You can use spend intelligence to proactively manage your costs while maximizing business value.

Whether your data lies in Hadoop, Snowflake, Databricks, or other data systems, Acceldata can easily integrate and help you maximize your investment. Let’s take a look at what you get with Acceldata:
- End-to-end visibility to ensure data delivery
- Multi-layer data identification and monitoring
- Data debugging at the root
- Shift-left problem isolation for early detection
- Automated data reconciliation to ensure data in-sync
- ML-driven configurations to prevent outages
- Always-on monitoring and performance analysis
- Pattern detection to scale data systems up or down
- Eliminate redundant costs with anomaly detection
You can request a personalized demo covering the benefits of Acceldata and the key features for your use cases.
9. Dynatrace
Built for modern cloud computing and with AI at its core, the Dynatrace platform helps you monitor your multi-cloud systems with unified observability and security.
Powered by hypermodal AI at its core, this observability platform efficiently breaks down your data silos. Additionally, you get proactive prevention of issues before they affect your systems.

Dynatrace can help you increase your conversions by up to 32% by delivering enhanced customer experiences and reducing your support tickets by 99%. Additionally, with the help of data observability, your software development processes can be 4x faster. You can also reduce time spent on security vulnerabilities by 95%.
Here’s what you get with Dynatrace:
- Instant infrastructure analysis
- All-in-one approach with a unified view
- Automated incident management
- Automatic monitoring of cloud-native systems
- Visualization of application dependencies
- Deep analysis with code-level tracing
- AI-powered answers with Grail
- Security analytics with runtime application protection
You can try out Dynatrace with a 15-day free trial. Post that, you get hourly pricing with infrastructure monitoring for $0.04/hour for any size host. The full-stack monitoring comes for $0.08/hour for 8 GiB hosts.
10. Splunk
Splunk is the only observability platform that supports full-stack, is powered by analytics, and has native support for OpenTelemetry. With the power of Splunk, you get guided root cause analysis and can fix 80-90% of problems faster. Reduce major IT incidents by over 50% and gain a complete understanding of your infrastructure and applications.

You get AIOps as a part of the solution, making it easy to detect changes instantly. Moreover, there’s AI-assisted troubleshooting that provides guidance on where to look for issues.
Splunk has two main observability products – Splunk Application Performance Monitoring and Splunk Infrastructure Monitoring. Let’s look at what you get:
- Immediate issue detection from any change
- Issue source isolation and confident troubleshooting
- Complete understanding of how your services, APIs, and dependencies interact
- Code-level analysis and data tracing with AlwaysOn
- Smart, dynamic alerting based on historical anomalies
- Centralized enterprise controls for infrastructure
- Instant visualization with 250+ cloud service integrations
- Log Observer Connect to combine real-time metrics with logs
There’s also a free trial option to try Splunk Cloud Platform for up to 5GB/day for 14 days. Or you can try out Splunk Enterprise and index up to 500MB/day for 60 days.
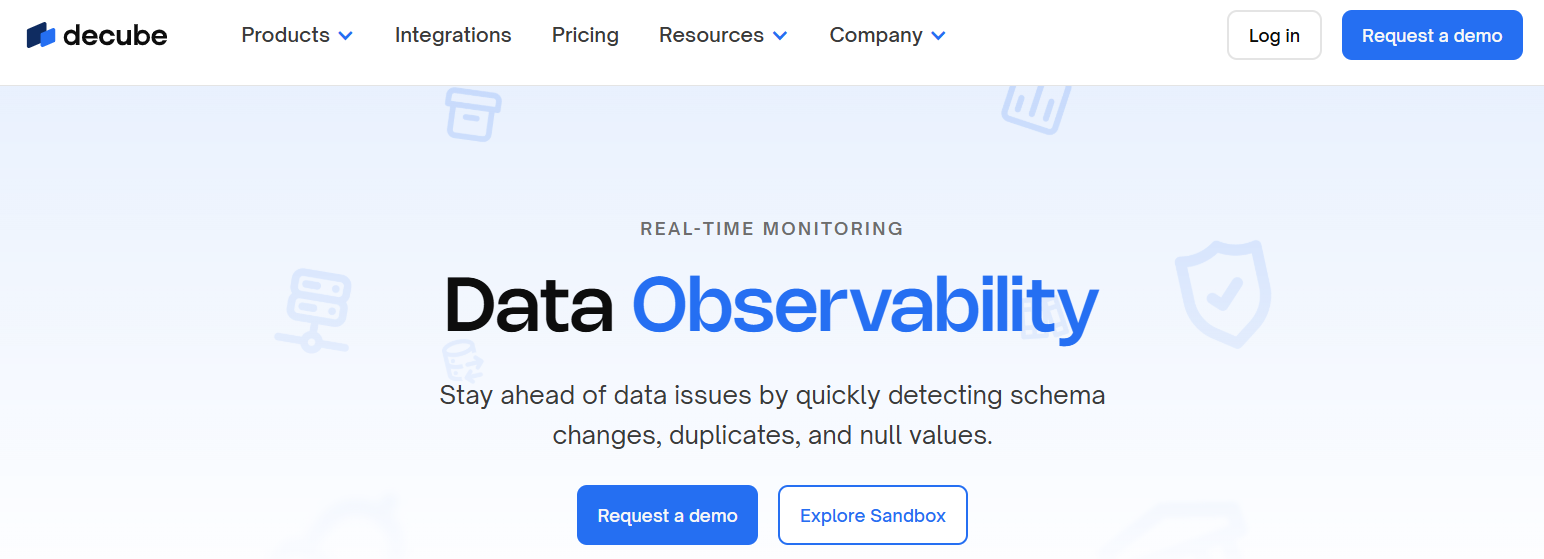
11. Decube
With an all-in-one package solution for data observability, along with data governance, Decube provides you with a feature-rich solution that unifies your data stack. It easily connects with popular data warehouses like Snowflake, Redshift, Google Big Query, Databricks, and Azure Synapse.

You get out-of-the-box data monitoring and tests that are readily available, such as schema change detection, null data checks, volume monitoring, and count of distinct records. The ML-powered incident model helps you quickly get to the root cause.
Here’s what you get with Decube data observability:
- Reliable data with less time have to debug issues
- Complete visibility of data
- AI/ML models to analyze real business impact
- Data catalog and table profiler
- Support for data transformation tools like Fivetran and Airflow
- Secure access via VPC and SSH tunneling
Explore the free Community version that lets you monitor 25 tables and connect up to 2 connectors. Thereafter, you have a Starter plan, which you can try with their 30-day free trial. In case you’re looking for enterprise pricing, then their Enterprise plan can get you a custom quote.
12. StackState
If most of your workload is on Kubernetes, then StackState can be your best solution. You get pre-configured Kubernetes troubleshooting best practices, which can be easily applied to help spot issues immediately. Additionally, you can visualize all your Kubernetes dependencies so that you can keep track of any change.

Let’s take a look at what StackState has to offer:
- Ingestion of all data via eBPF-based K8s agents
- OpenMetrics, OpenTelemetry, and direct collection from cloud resources
- Change tracking and topology intelligence to understand complex dependencies
- Scalable store for all metrics, events, logs, and traces
- Automatic discovery and visualization using discovery maps
- Step-by-step guide for resolving any issue
- Zero-config easy-to-use dynamic dashboards
- Alerting and deep integration with popular communication channels
StackState comes with three pricing models – Troubleshooting Edition for $15 per node per month, Observability Edition for $25 per node per month, and Enterprise Edition with custom pricing. You can sign up for a 14-day free trial.
13. Honeycomb
Honeycomb observability platform is purpose-built to find answers in billions of rows of your data and get you answers in less than 3 seconds. Step away from the traditional way of looking through multiple tracing and constant context-switching and get everything in one place quickly.

Here’s what you get with Honeycomb:
- Fast fault localization, irrespective of application complexity
- Fast feedback on service reliability with SLOs
- Automatically highlight anomalies using BubbleUp
- Integrated distributed tracing for end-to-end deep diving
- Single data set to analyze metrics and logs
- Full support for OpenTelemetry
- Intelligent data sampling with Refinery
You can get started for free with 20M event volume per month and 2 triggers. If you’re looking for more features, then the Pro version starts at $130 per month. Then, there’s also an Enterprise version with custom pricing for company-wide large-scale applications.
What Are the Pillars of Observability?
Metrics
Metrics are the numeric values generated by your system. This includes things like CPU utilization and API response times. Metrics are a great indicator to quickly find if everything is running fine. They are very good for looking up historical data and tracking trends.
Logs
When you need granular details of your application and its logic, logs come into play. Think of logs as records of events to discover unpredictable behaviors. So, you’ll get comprehensive system details like what the error has happened and when it took place.
Traces
Metrics and logs can be useful in uncovering individual system behavior, but traces can help understand the entire lifecycle of a request in a distributed system. That’s to say, you get to see the entire journey or trajectory of the system or action in the distributed system. This gives you context and is crucial in measuring the overall system or running optimizations for high-priority areas and resolving issues faster.
How to Choose the Right Platform
Catching bad data before it impacts your system is crucial. Hence, you need an all-rounder data observability platform that meets your specific business needs. While evaluating which one works best for you, focus on a platform that’s easy to deploy, has the potential for scalability without a huge overload, and supports easy integration with the tools and applications already in use.
Moreover, there should be real-time visibility into monitored applications and actionable insights that support critical business decisions. Cloud access, a centralized dashboard, and step-by-step resolution guides can also become important parameters for deciding which observability platform is right for you.

