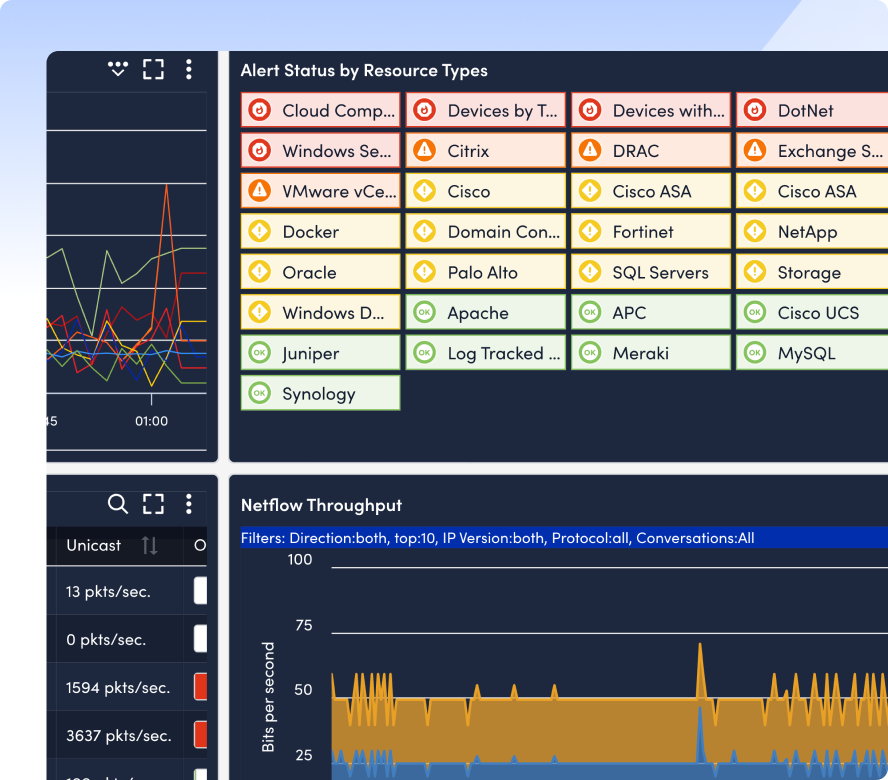
Network monitoring software is essential for analyzing performance and alerting teams to the health of their infrastructure. While monitoring servers and applications is standard practice for keeping services running smoothly, it is equally important to include your underlying network infrastructure under that same monitoring umbrella. This is the only way to proactively avoid unforeseen outages or security breaches.
Modern IT environments have evolved exponentially. With the rise of cloud computing and remote work, even small businesses now manage hundreds of connected machines. These devices rely on network equipment for reliable communication.
As infrastructure become more complex, reliable monitoring becomes critical to prevent application downtime. To make your search easier, Geekflare has researched and compiled the top network monitoring solutions across various categories including SaaS-based, enterprise-grade, and open-source.
3 Types of Network Monitoring Tools
If I have to categorize them, I will put them into the following 3 main types.
1. Enterprise Network Monitoring Suites
Best for large enterprises with legacy infrastructure and complex environments.
Unlike SaaS tools that prioritize modern stacks, these suites handle mainframes and on-premise data centers. They offer advanced event correlation, granular access control, and integration with SIEM and ticketing systems to support NOC teams.
Choose Enterprise Suite
If your organization requires data to stay on-premises and have a in-house network team to manage network infrastructure.
2. SaaS Network Monitoring Tools
Best for remote accessibility and low maintenance.
These cloud-managed services eliminate the need for on-premises physical servers. They scale easily and relatively cheaper to get started. With native integrations for AWS, Azure, and GCP, they provide unified visibility across hybrid environments.
Choose SaaS
if you want to start monitoring in minutes and avoid the overhead of buying and maintaining your own hardware.
3. Open Source Network Monitoring Tools
Best for startups and tech-savvy teams on a budget.
These tools provide a core framework that is free to use and customizable. They avoid vendor lock-in and support standard protocols like SNMP and NetFlow. However, they typically require more technical skill to deploy, maintain, and customize via community plugins.
Choose Open Source
if you have technical skills to install and manage with limited budget.
Best Enterprise Network Monitoring Suites
And, now the time is to go through the following top network monitoring tools suited for large enterprises with hybrid or multi-cloud environments.
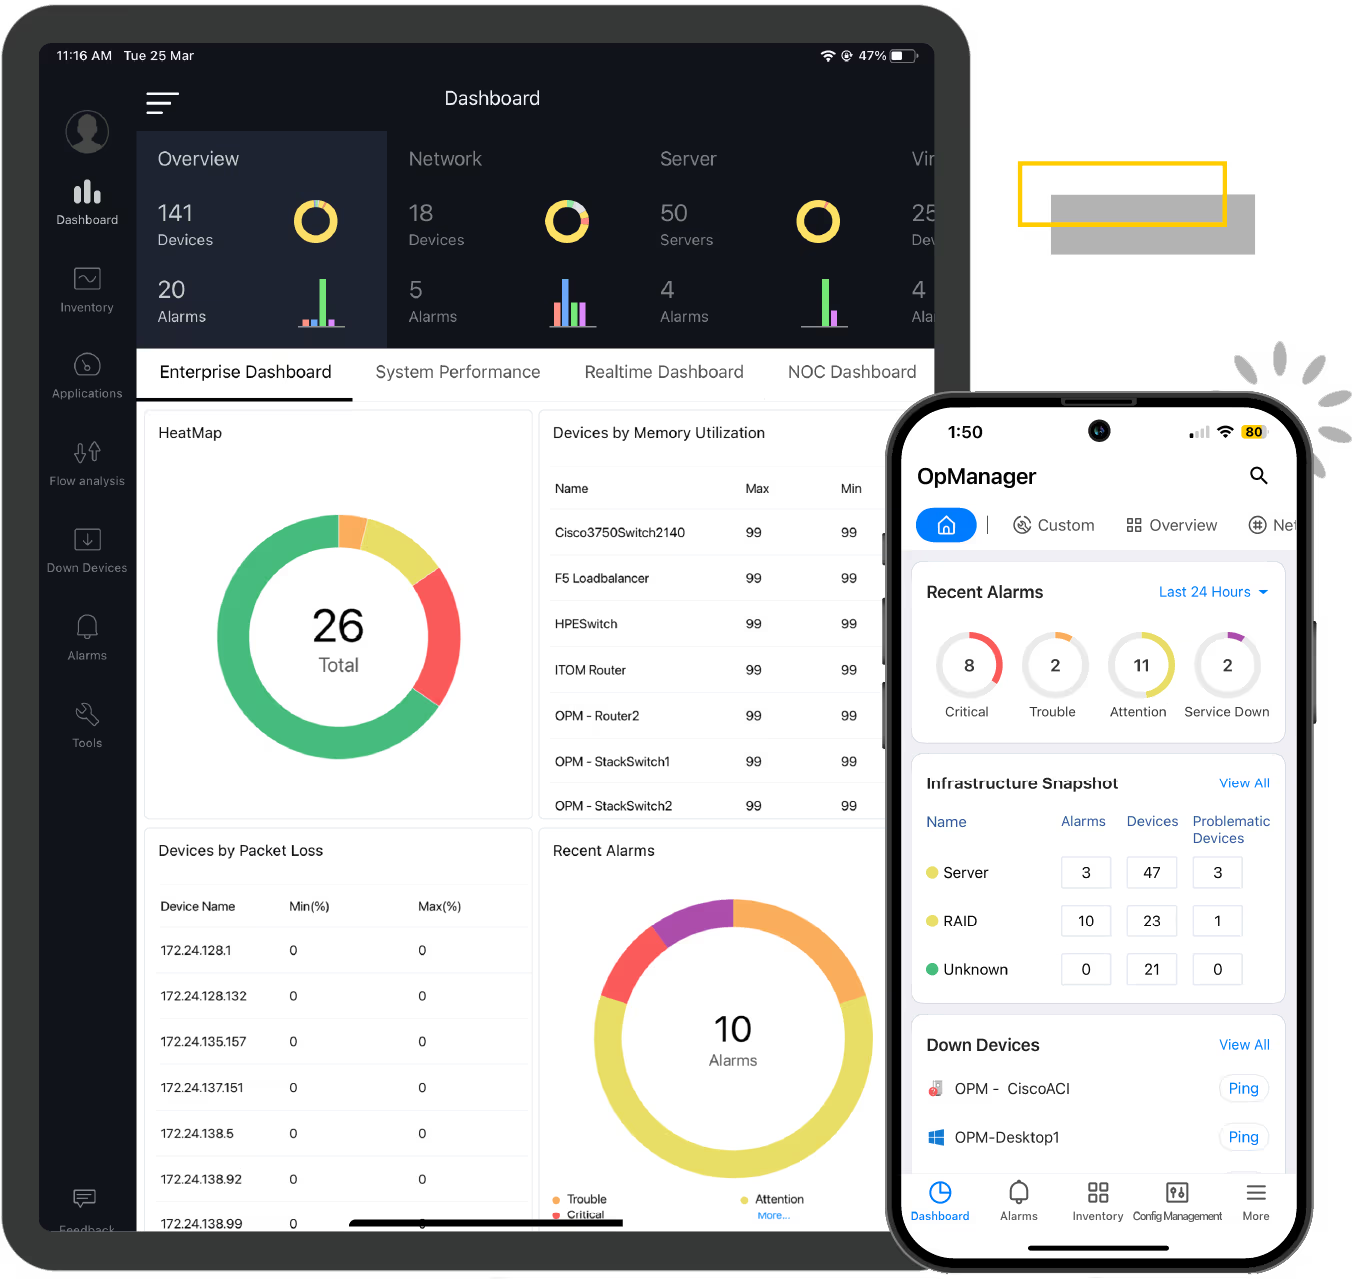
OpManager
ManageEngine OpManager is an on-premise network monitoring solution to get complete visibility into routers, switches, firewalls, and servers. Known for its affordability, it is suitable for SMBs and enterprises that prefer keeping their monitoring data within their own physical network.
Unlike some enterprise tools that require weeks of onboarding calls to set up, OpManager is quick to onboard and install. Its ability to visualize Layer 2 maps automatically helps IT teams pinpoint exactly which switch port is causing a bottleneck.
Key Features
- Monitors over 2,000 performance metrics across devices via SNMP, WMI, and CLI.
- Automatically generates L2 network topology maps to visualize dependencies.
- Leverages Cisco IP SLA technology to monitor WAN availability and performance.
What can you monitor with OpManager?
Pretty much everything!
- Router
- Switch
- VoIP
- VMware, Hyper-V, Citrix Hypervisor
- Syslog
- Network traffic
- Storage
Pros & Cons
PROS
CONS
OpManager Pricing
Free Edition: Monitors up to 3 devices.
Standard Edition: Starts at $245 for 25 devices.
Use ManageEngine OpManager if you are an SME looking for a pocket-friendly, on-premise solution to monitor physical networks without the recurring cost of a SaaS platform.
OpManager SaaS Alternative
Zoho has another product called Site24x7 which is a SaaS network monitoring tool. The Professional plan stars at $42/mo which includes 10 network components monitoring. Great for SMBs!
Paessler PRTG
Paessler PRTG is all-in-one monitoring software to monitor entire infrastructure. Unlike modular suites where you buy separate add-ons for traffic analysis or application monitoring, PRTG includes everything in a single license. It uses a sensor-based architecture to monitor everything from bandwidth usage and uptime to routers, switches, and even IoT devices.
While the interface may feels a bit more traditional compared to modern SaaS like New Relic or Datadog, its reporting view is excellent for visualizing network hierarchies at a glance.
Key Features
- Native support for SNMP, WMI, SSH, NetFlow, jFlow, and packet sniffing.
- Scans network segments to automatically identify devices and create a set of initial sensors to start monitoring.
- Includes Remote Probes to monitor disparate locations or segregated networks from one central place.
Two things I didn’t like about PRTG is:
- Sensor pricing confusion – the pricing model can be tricky. One device like a switch might require 5+ sensors to monitor every port, eating into your license limit quickly.
- Windows dependency – the PRTG software must be installed on a Windows server.
PRTG Network Monitor Pricing
PRTG pricing starts at $179/mo which covers around 50 devices.
I would suggest PRTG if you want on-premise solution where you pay for capacity rather than features, and you need to monitor a diverse mix of IT and OT (Operational Technology) devices.
SolarWinds Observability
SolarWinds is a popular name in the network monitoring industry, recently evolving its classic tools into a unified platform known as SolarWinds Observability. It is unique because it offers the same deep level of visibility whether you choose to run it as a fully managed SaaS or host it yourself on-premise.
SolarWinds is the power user’s choice. Their NetPath feature acts like a visual traceroute, showing you every single hop your data takes from the user’s laptop, through the internet, to the destination server. If there is a lag spike, NetPath shows you exactly which node caused it.
Another feature I like is PerfStack which lets you drag and drop different metrics like CPU load and Network Bandwidth onto a single timeline to spot correlations.
Key Features
- Visualizes end-to-end network paths to pinpoint latency issues across the internet or hybrid clouds.
- A cross-stack correlation engine that allows you to compare network, system, and virtualization metrics side-by-side to find the root cause of issues.
- Available as a SaaS solution or a self-hosted software.
- Uses AI to reduce alert noise and provide predictive insights into health and performance trends.
- Automatically maps wired and wireless infrastructure.
SolarWinds is recommended to large enterprise due to its cost and setup complexity.
Other Enterprise Tools
WhatsUp Gold
Kentik
ITRS Opsview
Checkmk
Best SaaS Network Monitoring Tools
Let me start with giving you the best cloud-based network monitoring tools you can deploy today.
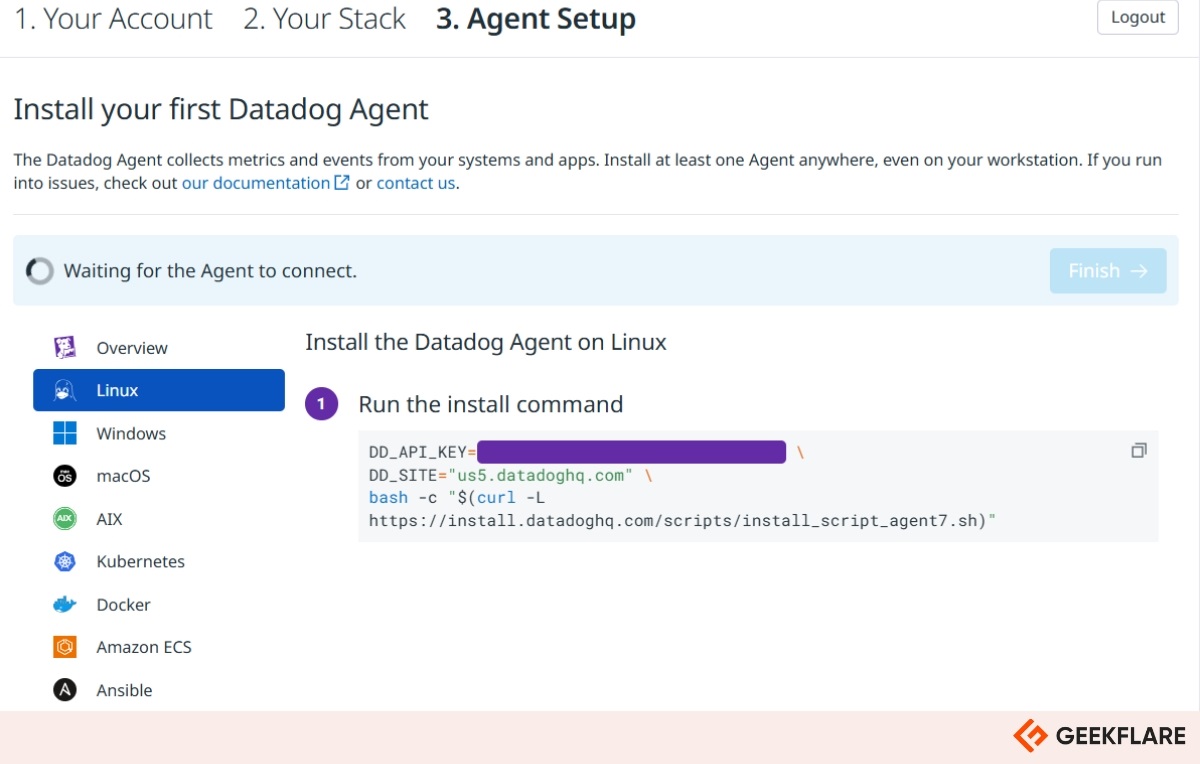
Datadog
Datadog is a cloud-native observability platform that provides end-to-end network health visibility across hybrid environments. It is widely recognized for its ability to monitor traffic between on-premise infra and cloud providers like AWS, Azure, GCP.
What makes Datadog stand out is its holistic monitoring solution. It doesn’t just monitor the network but have an option to monitor servers, applications, logs, APM and a lot more. It correlates network metrics with application and infrastructure performance. This approach allows you to instantly see if a latency spike is caused by a recent deployment or a saturated router.
Key Features
- Automatically maps network flows and dependencies across hosts and services.
- Monitors traffic health across data centers and containers.
- Uses Watchdog AI to detect anomalies and forecast potential outages before they happen.
- Filter traffic by destination, source, team, or service for speedy troubleshooting.
Pros & Cons
PROS
CONS
Datadog Pricing
Cloud network monitoring starts at $5/host/mo.
Use Datadog if you have a hybrid or multi-cloud environment and need to correlate network traffic with application performance in real-time.
LogicMonitor
LogicMonitor is a SaaS-based infrastructure monitoring platform, similar to Datadog.
We like LogicMonitor for its Collector architecture. Unlike tools that require agents on every endpoint, LogicMonitor uses lightweight local collectors to automatically scan your network. This makes it incredibly fast to deploy. It can discover, map, and start monitoring thousands of devices in hours.
Key Features
- Automatically identifies devices and maps topology as soon as the collector is installed.
- 3,000+ out-of-the-box integrations for top vendors like Cisco, Palo Alto, VMWare, and AWS.
- AI-driven baselining to detect anomalies and distinguish between normal traffic spike and actual issues.
- Correlates log data with network performance metrics to speed up troubleshooting.
Pros & Cons
PROS
CONS
LogicMonitor Pricing
Free Trial: for 15 days.
Essential Plan: network monitoring is included, starting around $16/resource/mo.
Use LogicMonitor if you are a medium-to-large enterprise with a hybrid environment and want a highly automated solution.
New Relic
New Relic is a cloud-native observability tool for real-time health metrics of servers, containers, and cloud platforms. It excels at infrastructure metrics and application performance (APM), giving DevOps teams a holistic view of their stack.
We particularly like its focus on dynamic infrastructure, if your environment spins up and destroys Docker containers or Kubernetes pods automatically, New Relic tracks them without manual configuration.
Key Features
- Automatically correlates infrastructure health with application performance.
- Connects with AWS, Azure, GCP, Kubernetes, and hundreds of other tools to pull metrics.
- Uses AI to detect anomalies and reduce alert noise by correlating related incidents.
- Fit into modern CI/CD pipelines, monitor changes in real-time as you deploy code.
Pros & Cons
PROS
CONS
New Relic Pricing
Free: Includes 100 GB/month of data ingest and 1 full platform user.
Paid plans: Pay-As-You-Go and data ingested.
Note: New Relic has partnered with Kentik for network performance monitoring.
I would suggest New Relic if you are a startup or small business running cloud-native applications and need to see how infrastructure performance impacts your end-user experience.
Auvik
Auvik is a cloud-based network monitoring and management platform for Managed Service Providers (MSPs) and internal IT teams who need to manage multiple distributed sites.
Its automated mapping engine is one of the best in the industry, within minutes of installing a collector, it builds a dynamic interactive map of your entire network topology.
Auvik is more than network monitoring, it is network management software. Which means it backs up network configurations. If a router update fails, you can restore the previous config directly from the Auvik dashboard.

Key Features
- Discover devices and creates real-time logical network maps.
- Provides deep visibility into traffic flows (NetFlow/sFlow) to identify exactly who or what is consuming your bandwidth.
- Backs up device configurations and alerts you to unauthorized changes.
- Secure remote terminal access to devices directly through the browser.
As Auvik is cloud only, it is not recommended if you purely need on-premise monitoring. Another thing is, pricing is quote-based so you must contact them to get the estimates.
More SaaS Tools
Zenoss
Pandora
Dynatrace
Domotz
Open Source Network Monitoring Tools
In this last section, I’ll review the popular open source and free tools.
Nagios
Nagios Core is the industry standard for open-source IT infrastructure monitoring. It is the grandfather of monitoring tools. It is free and capable of checking the health of servers, switches, applications, and services. While it lacks the polished interface of modern SaaS tools, its flexibility allows it to monitor virtually anything if you are willing to write the script for it.
Nagios is Do It Yourself tool. It is for sysadmins or network admins who prefer full control and ready to install and maintain in-house. Thanks to its large ecosystem, you can probably find plugins for your monitoring needs.
Pros & Cons
PROS
CONS
I’ve been using Nagios for more than 10 years and it is my go to tool when I need an open source monitoring solution. I would suggest Nagios if you have a skilled Linux team and need a highly customizable solution to monitor a mix of modern and legacy infrastructure.
LibreNMS
LibreNMS is built on PHP, MySQL, and SNMP. It is widely regarded as one of the best auto-discovering tools in the open-source community.
Unlike other open-source tools where you have to manually define every check, LibreNMS uses protocols like CDP, LLDP, OSPF, and BGP to automatically find devices and draw the map for you.
Pros & Cons
PROS
CONS
Use LibreNMS if are an ISP, MSP, or tech-savvy organization that wants a powerful free monitoring tool with automated mapping and bandwidth billing capabilities.
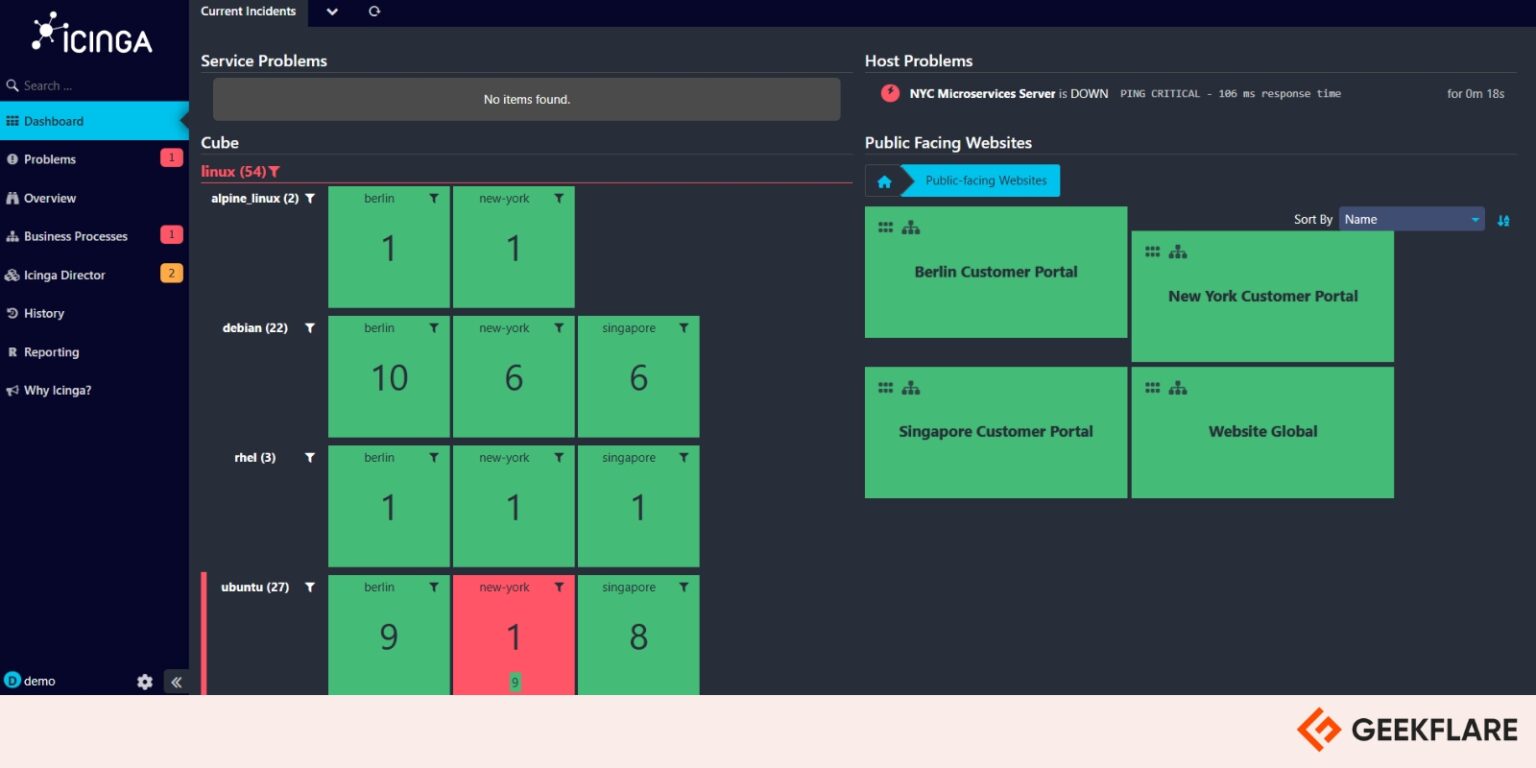
Icinga
Icinga is a scalable open-source monitoring system that originally started as a fork of Nagios but has evolved into a enterprise-grade tool. It can monitor the health of your entire infrastructure, from network switches and routers to servers, virtual machines, and cloud containers.
If you like the plugin ecosystem of Nagios but hate its complex file configuration, Icinga is the answer. It it the perfect choice for DevOps teams who want to automate their monitoring setup using tools like Puppet, Chef, or Ansible.
Other Open Source Tools
Zabbix
Prometheus
Cacti
Network Monitoring Tools Comparison
| Tool | Deployment | Best For | Licensing/Pricing | Key Feature |
|---|---|---|---|---|
| Datadog | SaaS | Cloud & DevOps | Per Host / Month | Logs, Metrics, Traces. |
| LogicMonitor | SaaS | Enterprise Hybrid IT | Per Device / Month | Agentless, automated discovery & collector based. |
| New Relic | SaaS | Application Performance (APM) | Usage + User Seat | Full-stack observability. |
| Auvik | SaaS | MSPs & SMBs | Per Device | Automated network topology maps. |
| Zenoss | Hybrid / SaaS | Large Enterprises | Quote-based | AIOps and model-based service impact analysis. |
| Pandora FMS | On-Prem / SaaS | Flexible / Mixed Environments | Free & Paid | Monitoring for IT, OT, and IoT. |
| Dynatrace | SaaS | Enterprise APM | Quote-based | Davis AI engine for automated root cause analysis. |
| Domotz | SaaS | MSPs & IoT Monitoring | Flat Fee Per Site | Affordable remote monitoring and management (RMM). |
| OpManager | On-Prem | Mid-to-Large Enterprise | Per Device | Cost-effective, all-in-one infrastructure management. |
| PRTG | On-Prem | SMB to Mid-Market | Per Sensor | Everything included in the price. |
| SolarWinds | Hybrid / On-Prem | Enterprise | Node / Module | NetPath & deep scalability. |
| WhatsUp Gold | On-Prem | Mid-Market to Enterprise | Per Device / Point | Interactive, action-based network mapping. |
| Kentik | SaaS | ISPs & NetOps | Quote-based | Deep network traffic and flow analysis (NetFlow). |
| Checkmk | On-Prem | SMBs & ISPs | Free & Subscription | Remote workspace, preconfigured checks. |
| Nagios | On-Prem | Linux Pros / Low Budget | Free / Paid (XI) | Massive plugin ecosystem for custom checks. |
| LibreNMS | On-Prem | ISPs & Tech-Savvy Teams | Open Source | Best-in-class auto-discovery. |
| Icinga | On-Prem | DevOps & Automation | Open Source | Network automation, logs integration. |
| Zabbix | On-Prem | Enterprise on a Budget | Open Source | Enterprise-grade features widely available for free. |
| Prometheus | On-Prem | Kubernetes / Containers | Open Source | Time-series database. |
| Cacti | On-Prem | Network Engineers | Free | RRDTool-based historical graphing & trending. |
Conclusion
Network monitoring software is the backbone of maintaining network uptime and performance. The ability to see what is happening in real-time is non-negotiable.
Choosing the best tool is subjective and depends entirely on your organization’s scale, technical expertise, and budget. Here is our final breakdown to help you decide:
- Go with SaaS like Auvik, New Relic if you need quick deployment and don’t want to manage a monitoring server.
- Go with Enterprise Suites like SolarWinds, PRTG if you require integrations, granular control over specific hardware, and support for hybrid environments.
- Go with Open Source Nagios, LibreNMS if you are working with a tight budget, have a skilled Linux team, and want the freedom to customize.