Agile metrics are measurements used to track the progress and success of an agile project team.
The metrics, when defined the right way, provide insights into the team’s performance, quality, testing efficiency, or overall effectivity and how it evolves over time.
The ultimate goal of agile metrics is to help teams identify areas for improvement and to make data-driven decisions that will lead to better products as the team progresses.
Most of the time, companies define metrics that are either vanity metrics or raw numbers, nicely growing from left to right. They might look nice on some dashboards, but they are usually useless for the team itself.
Their purpose is not to help the team in any way but rather to fill in some reports for leadership and then conclude with some strategic decisions. Unfortunately, it is then the team who doesn’t understand why this particular decision exists.
In a fence to fulfill such wrong metrics, the teams then fake their own processes to make the metrics look good. But the output of the team is not improving at all.
Basic Metrics
There are many ways how to segregate the metrics. Perhaps the most basic one is top-down and bottom-up.
➡️ Top-down means: We leadership will create for you metrics we want all of you to meet, and your ultimate goal is to fit into green areas of those. We don’t mind if you – a team like them or not; this is what we want to track.
➡️ Bottom-up means: We – the team need to improve in those areas, and for that, we need to focus on these things. We, therefore, define metrics that will allow us to track the progress of the team towards our goals, and we can demonstrate to you – leadership how exactly it improved our work over time.
Definition of Good Metric
So then, what should any good metric contain, or how to describe it?
The most important property is behavior-changing. This means that every time you look at the outcome of the metric, it’s clear what must change inside the team in order to get improvements.
Then it must be simple. If you can’t explain it with a few simple sentences so that all the relevant listeners can understand, then something is not really good.
A good metric is comparable over time. Take a results snapshot in a time, then do it again sometime later. Place them side by side. If you can’t compare the two results between each other, then you should give this metric a second thought.
Lastly, better than pure numbers, wherever possible, make it a ratio or percentage. “10 new open defects during the sprint” will not tell much. It depends if you normally have one or 100.
Here are some examples of metrics I believe meet all those definition criteria. They have specifically Agile teams in mind. There are three main categories: Performance, quality, and morale.
Categories of Metrics
Performance Metrics
The goal is to understand how good the team is at catching up with stories committed inside a sprint. To evaluate if overcommitment is not business as usual or if the carryover stories are a standard from sprint to sprint.
From the agile performance perspective, the team shall strive to deliver planned sprint content to which the team committed at the beginning of the sprint.
It does not mean we shall not be flexible in story exchange during the sprint. But it should always be a negotiation leading to an exchange, not an addition. The team’s capacity will not grow just because someone added new stories inside the sprint.
We bring this metric to watch out for such cases and guide everybody in the team to protect the capacity they have for the sprint.
This builds up the reliability and predictability of the team.
#1. Sprint Capacity vs. Delivered Story Points
Watch the history of sprint capacity vs. delivered story points (SP) content over the sprints.
- Small deviations from sprint to sprint are fine. Huge jumps in any direction signal something is off.
- Total Sprint Capacity – one team member’s available day adds one to the Total Capacity. E.g., If the team has 10 people and all of them will be available in full sprint, then the total capacity for the sprint is 100.
Verify the sprint capacity vs. completed SP from sprint to sprint. If the team is (during the planning) committing to a significantly higher amount of SP than the team can usually complete, raise this risk to the team.
The goal shall be to have a total planned SP equal to or less than the total completed SP per sprint.
You can still have more completed SP than planned if the team completed (towards the end of the sprint) all planned stories and the team still has the capacity to take the additional story.
- If the team repeatedly delivers less SP than planned, the team needs to amend its planning and take less SP into the next sprint.

Tools like monday.com, Atlassian Jira Software or Asana all provide a simple way how to save and extract story points per each story in the sprints. They can even generate that for you automatically after each sprint planning.
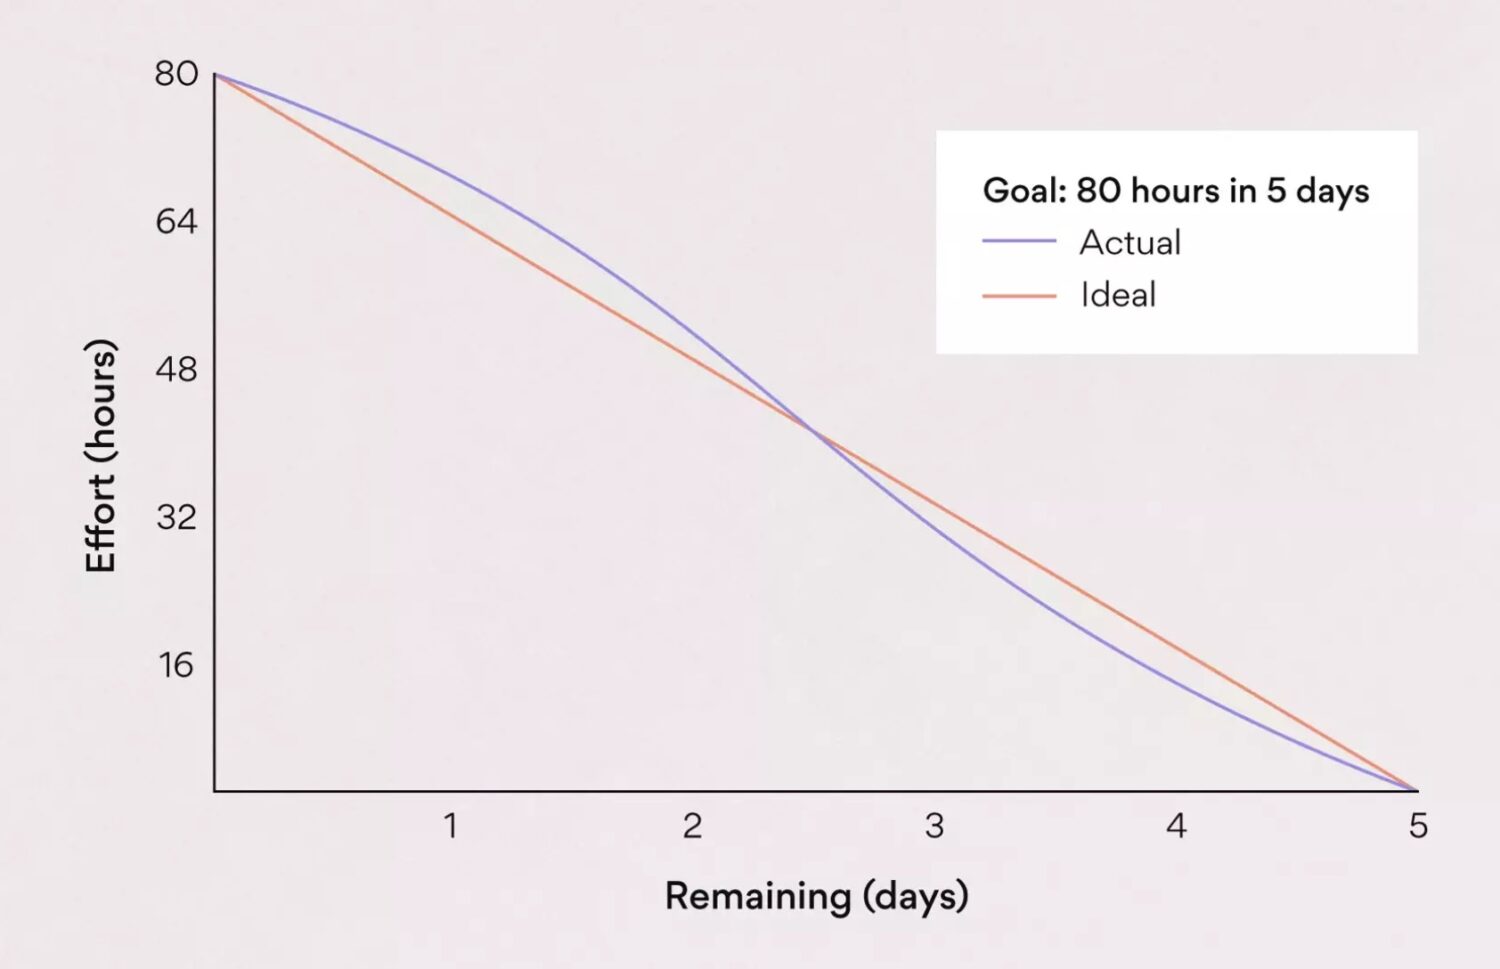
#2. Burndown Chart
This is one of the metrics probably most of the scrum teams have somewhere hidden on the dashboard. I agree that this might even look like a useless thing to have. The team rarely takes it into consideration. Rather, the manager like to point out how the stories do look from a high level and how they are not progressing well (as they are all open the whole sprint).
What I’d like to highlight is that despite that, you as a team should go and check on the burndown chart for your own good. If all stories are open the whole sprint and only closed on the last day of the sprint, this creates uncertainty inside the team and towards the sprint goals completion.
- Review your sprint board for completed stories.
- Check with the team to determine why small stories are still open, even if they started at the beginning of the sprint.
- Work with the team to build that mindset, not to keep the stories open longer than necessary.
- The ideal burndown chart is usually a theoretical state. However, the closer we get to it, the more effective story handling we have.
Agile management tools like Asana can generate a burndown chart for you automatically for each sprint.

#3. Sprint Goal Completion
This tracks the percentage of Sprint Goals that you completed during each sprint.
You document the Sprint Goals separately, e.g., on the Confluence page / Jira Software , for each sprint. Status shall be assigned whether they were met or not within the sprint.
Even if the team did not complete all stories within a sprint, they could still achieve the Sprint Goal (e.g., only side stories missing).
We shall aim for 100% Sprint Goals completion each sprint. If that is not the case, find out what the team is preventing.
- If it is too many parallel topics in each sprint, reduce the amount of them.
- If it is too many ad hoc stories are added during the sprint, reduce this so it will not affect original sprint goals.
- If the sprint goals are too big or too challenging, make it simpler. It anyway has no sense to have big sprint goals while not fulfilling them by the end of the sprint.
Code Quality Metrics
This shall track how good the code is over time. It helps to maintain healthy development processes and decreases the time spent on resolving issues. Or the developer’s idle time caused by waiting on the code execution during dev and test activities.

#1. Automated Tests
Create automated unit tests by developers for each change they do.
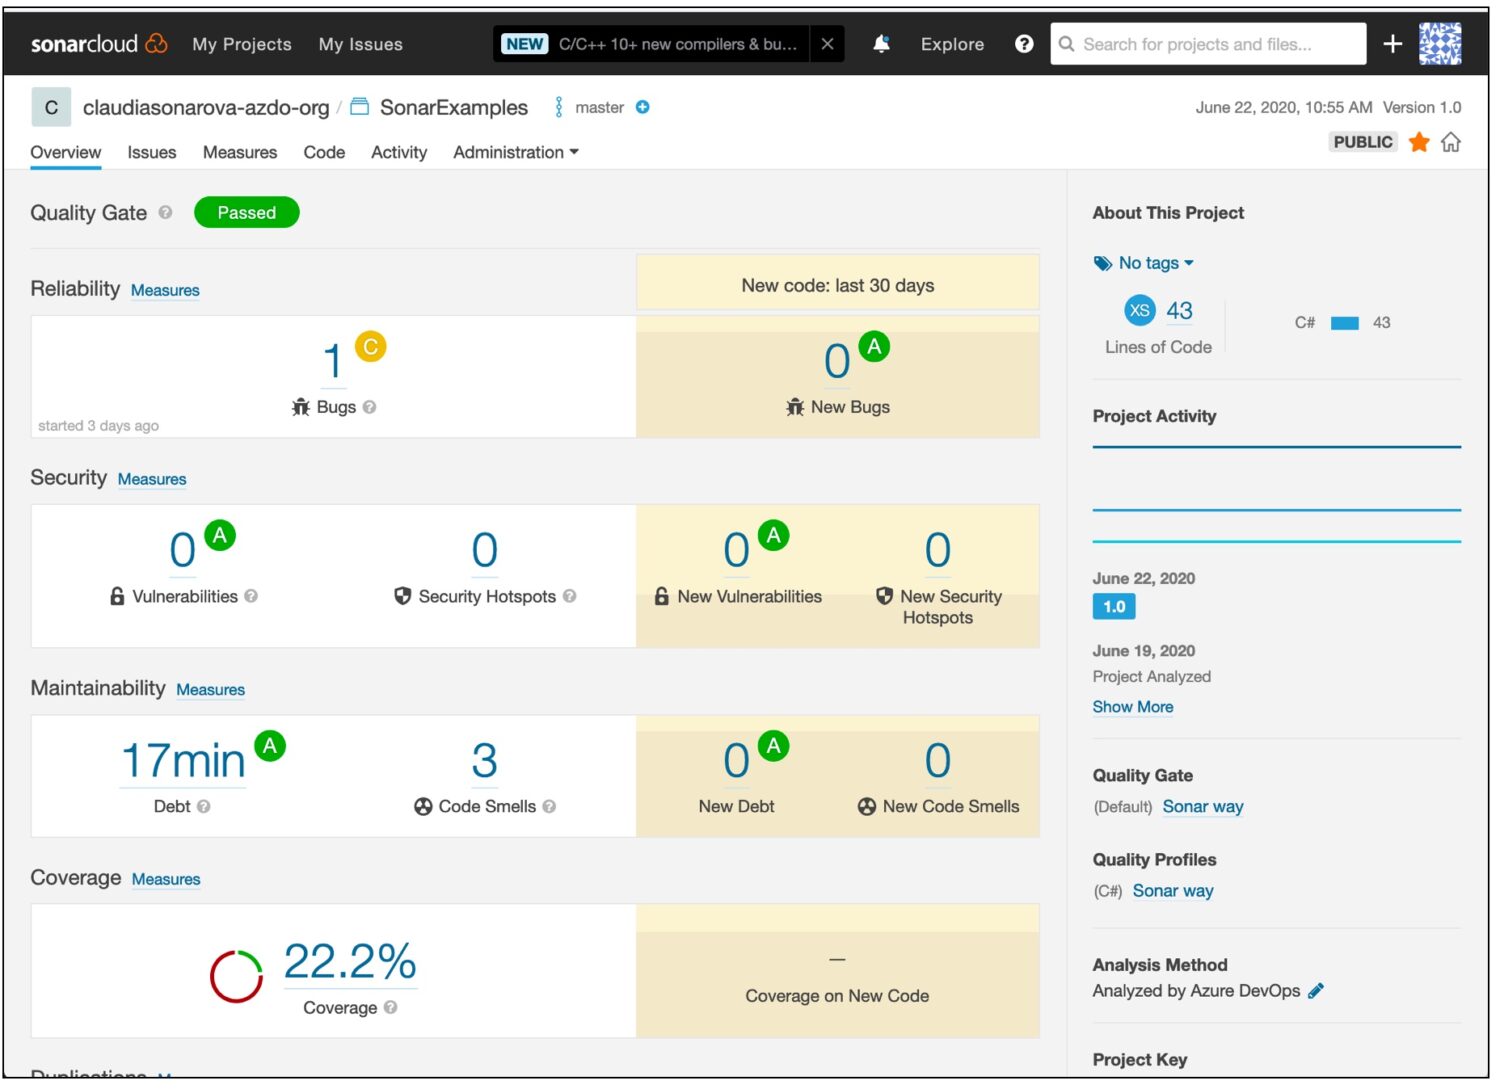
- Measure code coverage by automated tests – use Azure Pipelines or SonarCloud to run the tests. Aim for 85% coverage. Above 90% is not really efficient.
- Make sure the automated Unit test creation is part of the definition of done for the new stories.
- Catch up with old code test coverage as part of technical debt stories in the backlog.
#2. Code Complexity
Evaluate unnecessary complications the code is obtaining over time and actively fix it by technical debt stories. Or prevent them from happening if possible.
Define code standards and guidelines to educate developers to follow them. Make sure they stick to the coding rules in order to minimize the unreasoning increase in code complexity. Regularly updated the guidelines based on the experience of the team.
Identify Code Smells – indicators of potential problems in the code, such as duplicated code, long methods, and unused variables.
Peer reviews shall ensure code standards are applied to the newly created code.
Use tools like Azure Ado or SonarCloud dashboards and reports to discover code problems.
#3. Manual Steps in Deployment
Track how many manual steps the team has to do to release the code into test or production environments.
- Our goal shall be to achieve the 0 here over time.
- Create technical debt stories if necessary to bring up the deployment/release pipeline up to the automation roadmap. Gradually lower the remaining manual steps in the processes from sprint to sprint.
Morale Metrics
This is a metric to track how the team feels about their work and the processes they deal with daily.
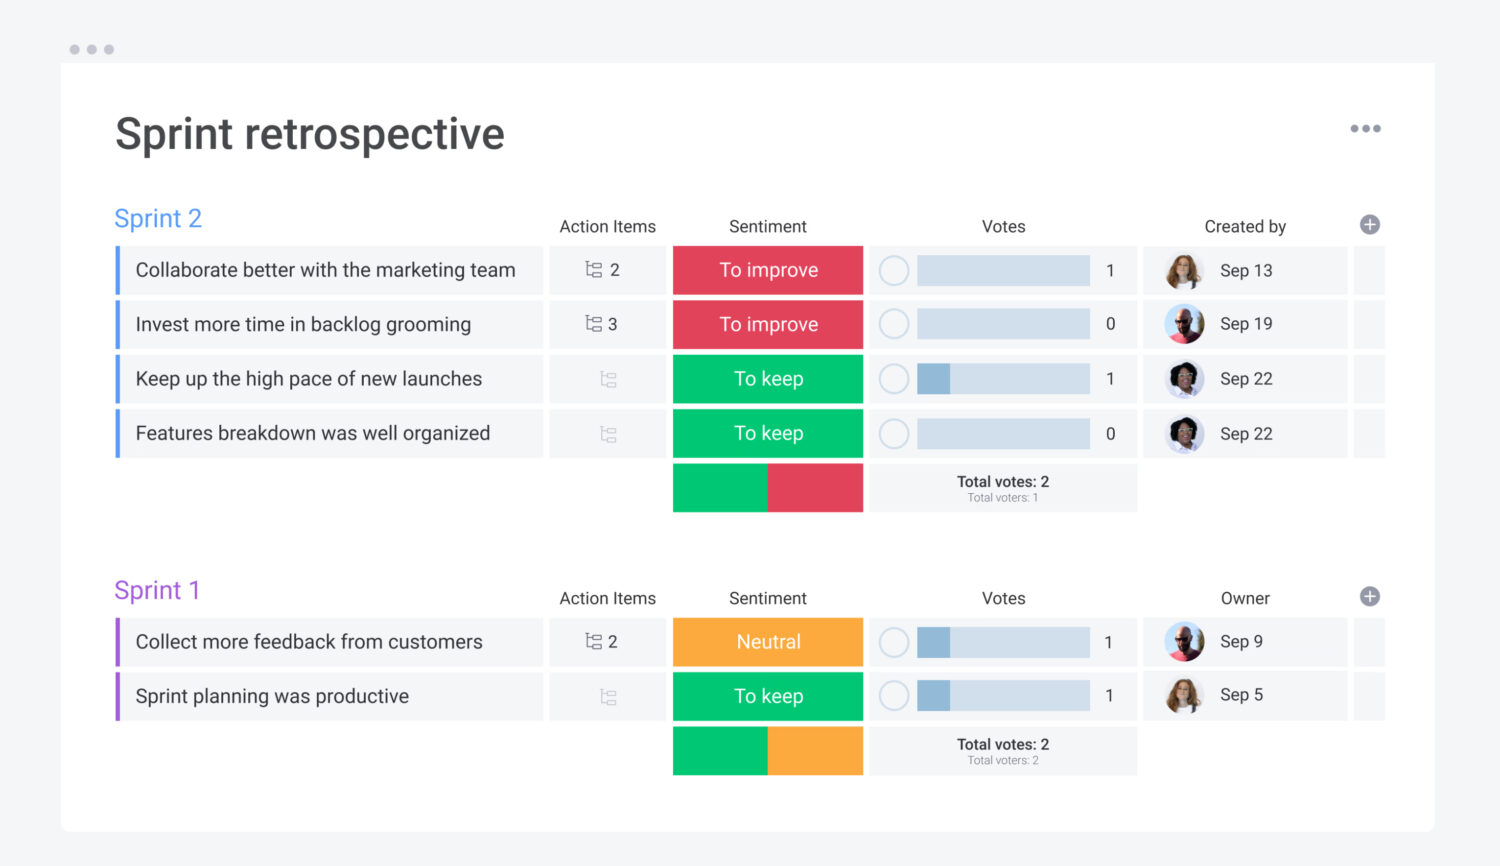
#1. Sprint Retrospective Fulfillment
You can track how many action items were actually completed in the next sprint.
- Scrum Master shall collect the Retrospective meeting outcomes into the team’s pages to track agreed action items.
- The team would then keep track of progress.
- Project management can then review whether the action items are progressing or what prevents the team from completing them. Then amend the environment to allow the team to progress in the agreed action items.
At least 33% or 1 (depending on what is higher) of action items from the previous sprint will be adopted into the next sprints.
If it is less than that, changes are needed to allow the team to implement the improvements they agreed on.
Project management tools contain ready-to-use templates for sprint retrospective activities. Here is an example from monday.com:

#2. Team Collaboration
Track pair programming.
- Form a natural couple per story to work together, sharing observation, knowledge, and success. Create subtasks under stories owned by different team members.
Track Code reviews from peers’ initiatives.
- Peers are asked or proactively taking action to review someone’s else story output.
The metric can be extracted from the monday.com/Asana/Jira Software board from the subtasks.
At least 50% of stories in the sprint shall be shared by team members. If it is less, investigate the reasons and take actions where it makes sense.
For voluntary peer reviews, track the stories with dedicated subtasks. In the beginning, 20% of code stories reviewed in this way is a good start. Gradually over the sprints, you shall encourage and motivate the team to work more collaboratively and increase it towards 50% of code stories per sprint as a goal.
#3. Technical Debt vs. New Functionality Stories

Giving the team the opportunity to resolve their own debt stories will increase the team’s satisfaction with their work.
- On the contrary, the accumulation of tech debt issues without a plan for solving them progressively will demotivate the team over time. And the solution will become more unstable, complex, and difficult to solve without substantial rework.
The team knows best what does not work well with the solution, even if the stakeholders or end users do not see it. Such stories have the biggest impact on the dev team itself. For the stakeholders, they might be invisible. That’s why it is important to give the team chance to work on stories that will help them unclutter the development activities.
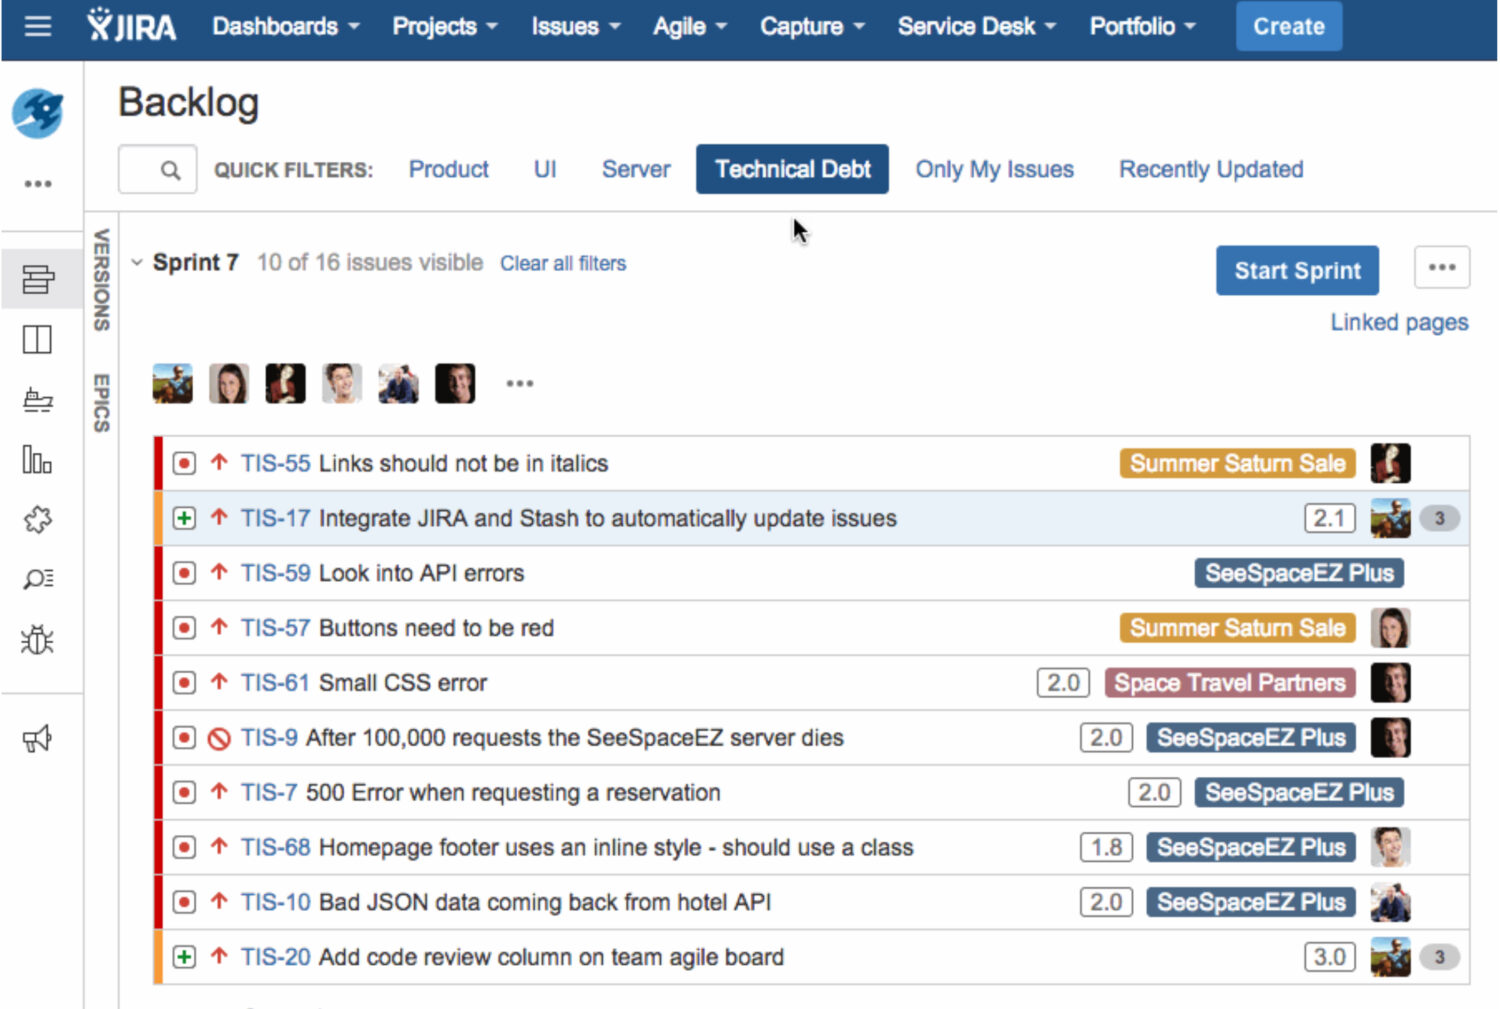
The goal is to track how many raised technical debt stories are solved over time and whether the backlog of such stories only grows or not.
The team can label the stories as TechDebt in the backlog and give them priority from the team, so they can go on top and be selected in sprints.
Depending on in which state the project is and how many tech debts are identified in the backlog, you might want to ensure the TechDebt backlog is not growing by more than 10% from sprint to sprint.
Prioritize the tech debt stories and include them in the sprints to keep tech debt backlog growth in check so that the team is allowed to work on the tech debt stories 10-20% of the time each sprint.
Final Words
Every project will eventually need some metrics, whether because the leadership wants to have them or because the team decides to measure its own success.
The best you can do is start building your library of metrics ready to be picked and used; the sooner, the better. And while doing that, make sure you always go for behavior-changing metrics above all.
Next, check out unhealthy processes that can ruin your sprint.

