Business intelligence tools are software applications that use analytics and data visualization to make data-driven decisions to maximize operations. These tools enable organizations to extract valuable insights from data for understanding and visualization.
Geekflare tested dozens of BI tools and finalized the list of the best business intelligence tools, considering integrations, dashboards, AI-powered features, and pricing.
- Zoho Analytics – Best for Small Businesses
- Microsoft Power BI – Best for Excel Users and Microsoft Integrations
- Sisense – Best for Embedded Analytics
- Qlik – Best for Data Discovery and Interactive Visualizations
- Dundas BI – Best for Dashboards and Reporting
- GoodData – Best for Building Analytical Applications
- Looker – Best for Data Governance and Collaboration
- IBM Cognos Analytics – Best for EnterpriseGrade Reporting and AI Insights
- Tableau – Best for Data Visualization and Storytelling
- Oracle BI – Best for Oracle Ecosystem Integration
- SAP BusinessObjects – Best for Large Enterprises Using SAP Solutions
- Domo – Best for Real-time Data and Mobile Dashboards
- RIB BI+ – Best for Construction and Real Estate Businesses
- Spotfire – Best for Data Scientists
- Show less
You can trust Geekflare
Imagine the satisfaction of finding just what you needed. We understand that feeling, too, so we go to great lengths to evaluate freemium, subscribe to the premium plan if required, have a cup of coffee, and test the products to provide unbiased reviews! While we may earn affiliate commissions, our primary focus remains steadfast: delivering unbiased editorial insights, and in-depth reviews. See how we test.
Zoho Analytics
Best for Small Businesses

Zoho Analytics can analyze data, create impressive visualizations, and discover concealed insights in a few minutes, whether the data lies in web files, flat files, databases, offline/online apps, or cloud services. Users can schedule data and sync it periodically or automatically.

Zoho Analytics blends data from multiple sources and merges them to create comprehensive business reports that make sense. It offers charts, pivot tables, tabular components, widgets, images, and formatted texts to create dashboards and reports. It provides various interaction options, such as viewing underlying data, contextual filters, and drill-downs to execute the ad-hoc analysis.
Zoho Analytics analyzes geographical data using map charts to measure and compare crucial metrics across countries, states, regions, counties, longitudes, latitudes, and even postal codes. It has a comprehensive library of statistical and mathematical functions to extract business metrics. Zoho Analytics’ intelligent analytical assistant, ZIA, uses machine learning and natural language processing (NLP) to answer the typed questions in the form of KPI widgets and reports.
Zoho Analytics allows users to collaborate with their teams by sharing reports. Users can control the access of reports through read-only, report authoring, read-write, export, and drill-down options. They can also add contextual comments, annotate images, see comment history, publish reports, and embed them into blogs, websites, and apps for extensive consumption.
Zoho Analytics includes white labeling to create a reporting website or portal under any brand. Users get powerful HTTP-based APIs for data integration and Metadata control.
Zoho Analytics Pros

Single sign-on API for embedded analytics in any application
Available as a cloud and on-premise solution
Free forever plan for personal on-premise users
Zoho Analytics Cons
Additional charges for each viewer
Limited number of users in Enterprise plans compared to other plans
Zoho Analytics Pricing
| Plan | Pricing (monthly) | Offerings |
|---|---|---|
| Basic | $24 | 2 Users, 0.5 Million Rows |
| Standard | $48 | 5 Users, 1 Million Rows |
| Premium | $115 | 15 Users, 5 Million Rows |
| Enterprise | $455 | 50 Users, 50 Million Rows |
| Custom | Pricing on request | Tailored plan for high scale (rows/users) or dedicated server needs |
Microsoft Power BI
Best for Excel Users and Microsoft Integrations

Microsoft Power BI enables employees at different levels of an organization to make confident business decisions with updated analytics. It offers enterprise-scale self-service analytics to reduce added costs, security risks, and complexities associated with multiple solutions. It provides meaningful insights that users can share using hundreds of built-in artificial intelligence capabilities, data visualizations, excel integrations, and pre-built data connectors.
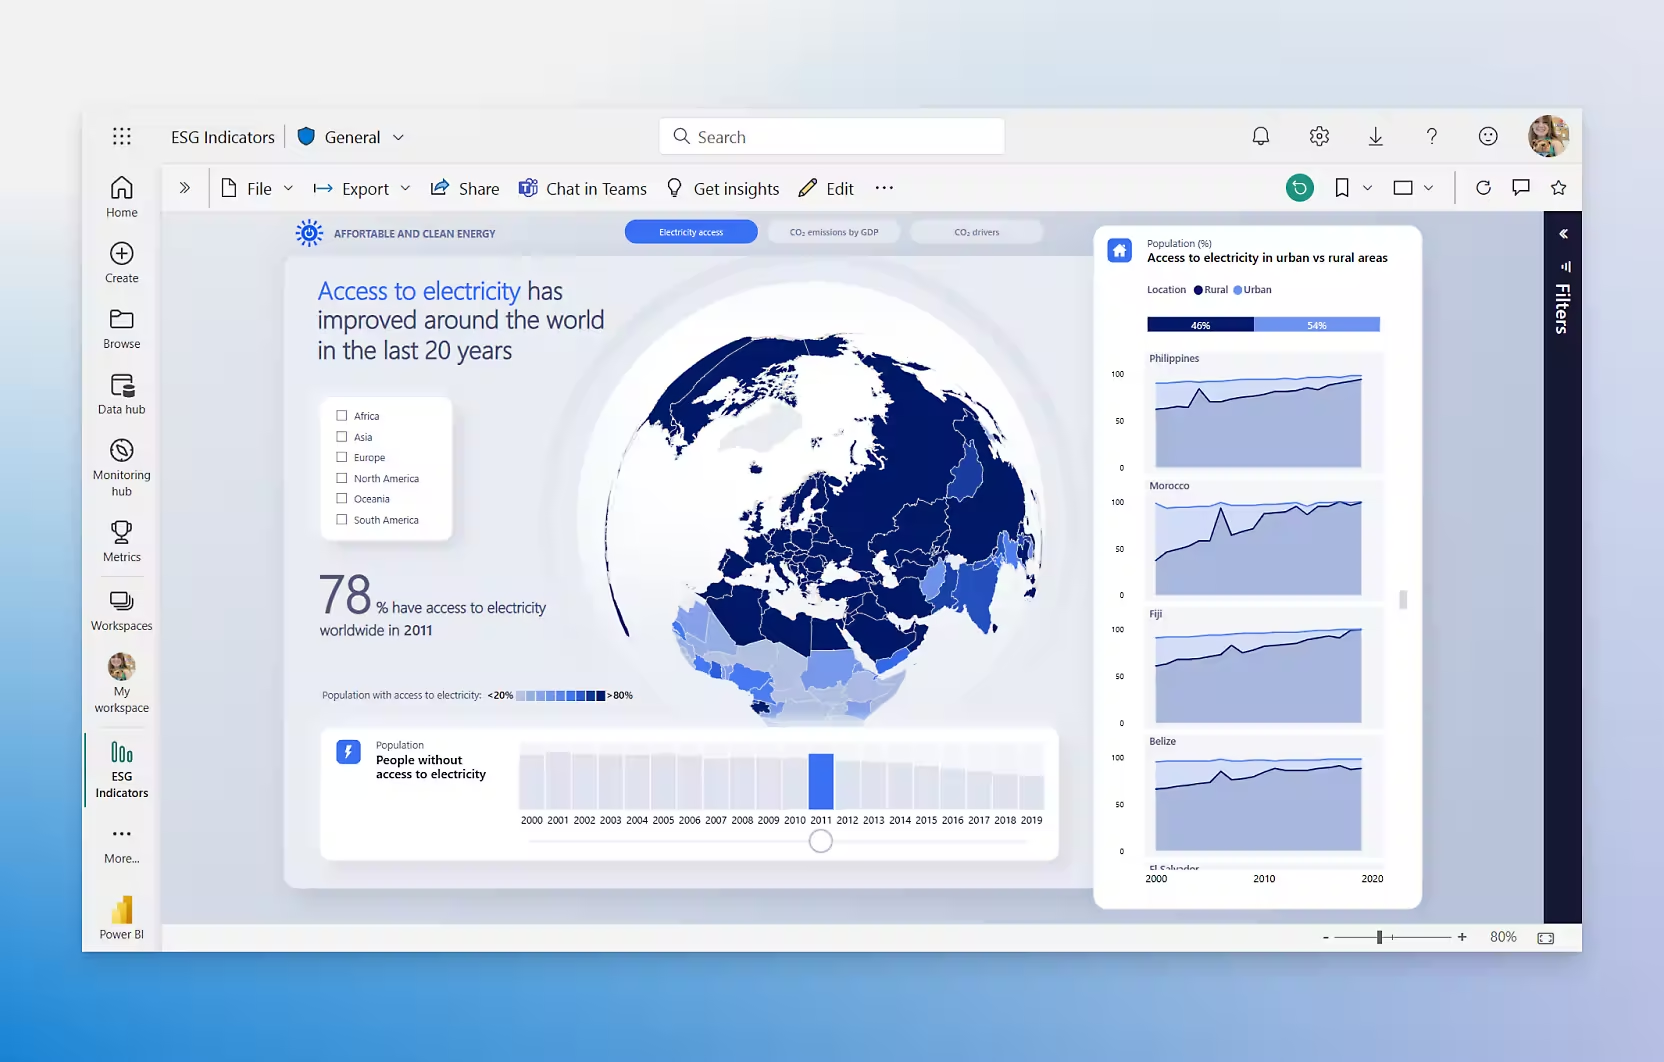
Power BI integrates with Adobe Analytics Cloud to deliver extensive data capabilities. It provides a 360-degree audience view with tools to build, manage, and deliver a digital experience. Users get major sensitivity classification and data loss prevention features to secure data and maintain compliance.
Power BI helps create end-to-end business solutions by connecting with Office 365, Azure, Dynamics 365, and other Microsoft 365 applications. It supports building applications that can easily connect to data, run over iOS, Android, and web devices, and utilize Excel-like expressions.
Power BI unifies data from multiple sources to build immersive, interactive dashboards and reports. It allows users to include robust workflow automation directly into apps without writing a single line of code to connect to popular services and applications.
Pros
Free plan available to try out proficiency
Embed BI reports into apps created by users
Report sharing through Teams, PowerPoint, Excel, and Power platform
Cons
Free plan allows users only to create reports
Power BI Pro plan does not offer advance AI and advanced workflows
Microsoft Power BI Pricing
| Plan | Pricing (monthly) | Offerings |
|---|---|---|
| Free account | $0 | Included in Microsoft Fabric free account, No credit card required |
| Power BI Pro | $10 | Publish and share Power BI reports, Included in Microsoft 365 E5 and Office 365 E5, Available to buy now with a credit card |
| Power BI Premium Per User | $20 | Includes all the features available with Power BI Pro, Access to larger model sizes, More frequent refreshes |
| Power BI Embedded | Pricing on request | Brand Power BI reports as your own, Automate monitoring, management, and deployment, Reduce developer overhead |
Sisense
Best for Embedded Analytics
Sisense is a robust analytics software that enables users to collect data, create beautiful visualizations, and build analytic applications that can be embedded anywhere. This self-service analytics solution utilizes data irrespective of location and uses artificial intelligence and machine learning to build enterprise-grade apps at a lower TCO.

Sisense provides embeddable analytics with white labeling and customization for integration into any product development project. It uses AI and ML to autonomously map connections between datasets, anomaly detection for a triggered response, and natural language query interfaces via chat and voice.
Sisense analyzes data from the entire data landscape of an organization to convert it into actionable app components and powerful dashboards with interactive visualizations. It combines live and cached data models for optimizing performance and management of resources.
Sisense uses collected insights to make better business decisions and solve complex scenarios. Users can control the access of systems, data, objects, and process levels, such as audit trails and recovery.
Sisense Pros
Integrates with Naveego, Kraken, and OvalEdge
Open API with documentation
Code-free to code-first tools for deeper analysis
Sisense Cons
Does not offer any free trial or free forever plan
Pricing information not available
Sisense Pricing
Contact the Sisense sales team for custom pricing.
Qlik
Best for Data Discovery and Interactive Visualizations
Qlik allows users to leverage information and associated analytics to solve their challenging problems while enhancing decision-making. It offers end-to-end data integration in real time to close wider gaps between insights, data, and action. It produces accurate insights that are easy to access through cloud solutions.
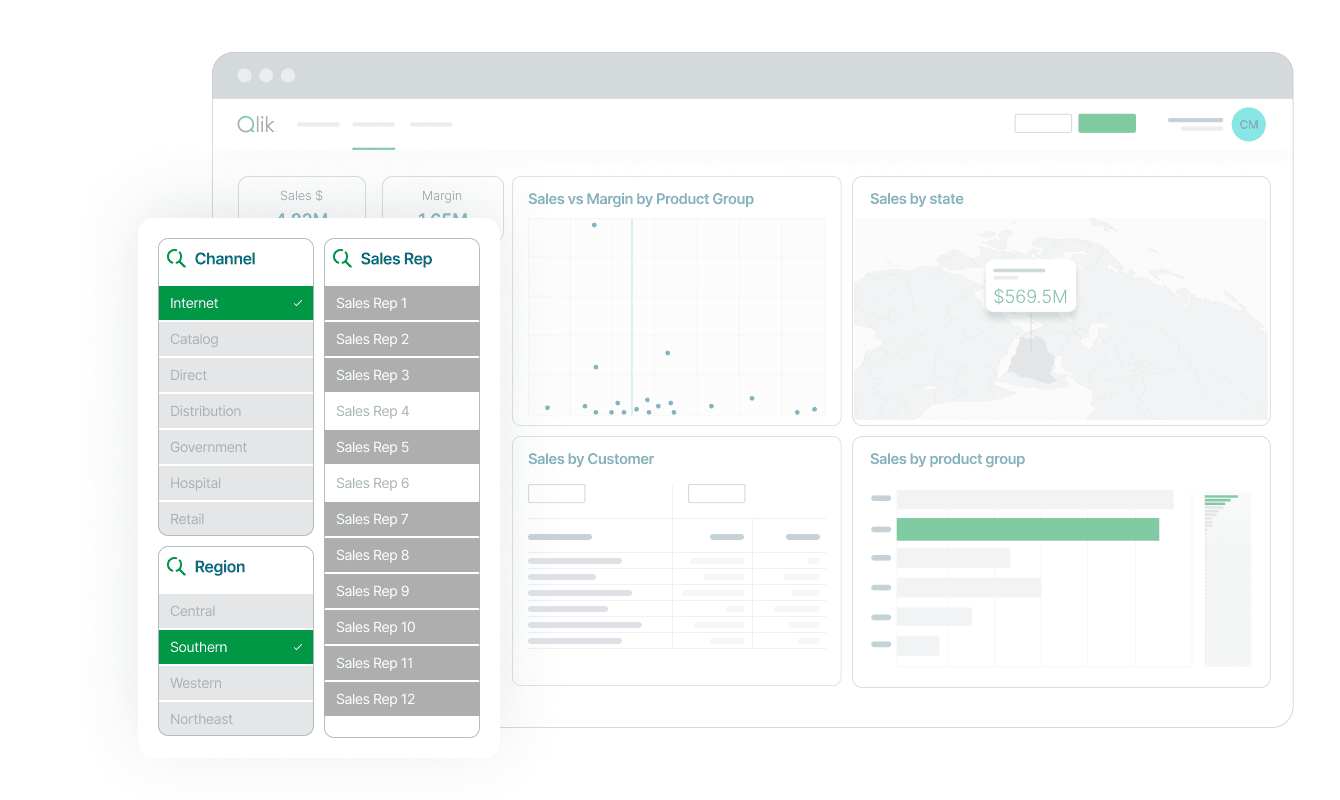
Qlik moves data instantly at scale with no tasking sources to efficiently deliver data to the cloud. Users can automate the overall process right from raw data to analytics-ready. They gain scalability and agility by automation, eliminating errors and complex scripting to build trust.
Qlik Sense is a dedicated product for AI-powered insight that anyone in an organization uses to make data-driven decisions. It has a purpose-built unique engine that can index and connect data for insights. It offers enterprise users features like natural language interaction.
Qlik Sense offers dashboards to search and explore data sets quickly. It automatically shares reports in PDF, Excel, and PPT formats.
Qlik Pros
AI assistance in 10 languages for ad hoc analysis
Insight-based alert for humans and machines
Predictive analytics and generative AI
Qlik Cons
Transparent pricing is not available
Steep learning curve for novices
Qlik Pricing
Contact Qlik Sense to get custom pricing.
Dundas BI
Best for Dashboards and Reporting
Dundas BI helps businesses gain data-driven insights and end-to-end business intelligence by analyzing and visualizing data. It converts raw data into intelligent, actionable insights through reports, dashboards, visual analytics, etc. Unlike other one-dimensional BI platforms, Dundas BI offers much-needed flexibility and speed while removing roadblocks.
Dundas BI can adapt to any user type, which allows you to personalize it to a great extent. With this self-service analytics approach, developers and analysts are empowered to analyze data quickly and meaningfully. With it, running ad-hoc queries, performing visual analytics, and creating relevant content is easy and quick with minimal IT assistance. Dundas BI uses open APIs and HTML5 for better customization and to improve dashboards, interactions, labels, and scorecards to meet unique design needs.
Dundas BI helps users understand the business value of their data with advanced prediction and on-the-go data analysis represented in a personalized format. It can manage and deploy analytics solutions securely based on IT standards. Users can connect it to relational databases, file-based data, web-based data, OLAP, etc.
Dundas BI Pros
Free trial available
Logi AI integration into workflows for forecasting
Patented In-Memory Data Engine for maximized performance
Dundas BI Cons
Does not offer any mobile apps
Offers multiple BI products, which can be confusing
Dundas BI Pricing
Contact Dundas BI to know pricing information.
GoodData
Best for Building Analytical Applications
GoodData is a cost-efficient, easily controllable, and fully customizable BI platform. It lets organizations embed analytics directly onto products/services to help them make decisions without any assistance from IT or analytics experts. eCommerce partners of a business can utilize this platform efficiently to gather essential insights instantly.

GoodData enables companies to transform their employees’ skills so that they can make better and more reliable decisions, even in critical business moments. This BI analytics is in the cloud, which reduces IT headaches associated with installation, management, etc. Users get fast and flexible services from GoodData, whether organizations build it for themselves or use a service package.
GoodData offers no-code tools and supports collaboration with code. Its AI-powered developer tools assist with automation in deployment, testing, and repetitive tasks. It automatically scales up when there is an increase in data volume, users, or stakeholders.
GoodData Pros
Separate pricing plans for businesses and their customers
Live demo with Q&A is available
Plug-and-play integrations for flexible embedding
GoodData Cons
Internal Analytics plan needs a subscription for a minimum of 10 users
Multi-region and self-hosted deployment is only available for Enterprise plan
GoodData Pricing
| Plan | Pricing (user/month) | Offerings |
|---|---|---|
| Startup | $30 | 10 users min., 30 users max. |
| Professional | $30 + $1,500 platform fee | Unlimited users and data |
| Enterprise | Pricing on request | Enterprise level security & compliance |
Looker
Best for Data Governance and Collaboration
Looker offers more options and increases deliverability through fresh and strong insights by combining the data analysis of Google Cloud. It has a real-time dashboard to get consistent analysis and easy access to genuine data that enables teams to garner accurate results and reporting. Users can integrate it with their favorite tools to increase productivity and make data-informed decisions.

Looker helps to accelerate workflows using unified answers and create custom applications to deliver unique data experiences. It has embedded analytics services from healthcare to retail and more to serve a wider range of customers. It supports different data sources and deployment methods to provide more flexibility with no compromise on security, privacy, and transparency.
Looker can seamlessly connect with Snowflake, Redshift, BigQuery, and 50+ SQL dialects. As a result, businesses can link to various databases, maintain multi-cloud environments, and prevent database lock-in.
Looker Pros
Free trial for 90 days
Supports public cloud hosting services in multi-cloud and hybrid environments
Gemini for AI-powered analytics
Looker Cons
Strong integration with Google Cloud might cause difficulty in data migration
Steep learning curve
Looker Pricing
Users need to request a custom quote for Looker pricing.
IBM Cognos Analytics
Best for EnterpriseGrade Reporting and AI Insights
IBM Cognos Analytics drives confident decisions through automated data discovery, preparation, and visualization. Users can import data from spreadsheets and CSV files or connect to several on-premises or cloud sources such as Google BigQuery, SQL database, Redshift, Amazon, and more.
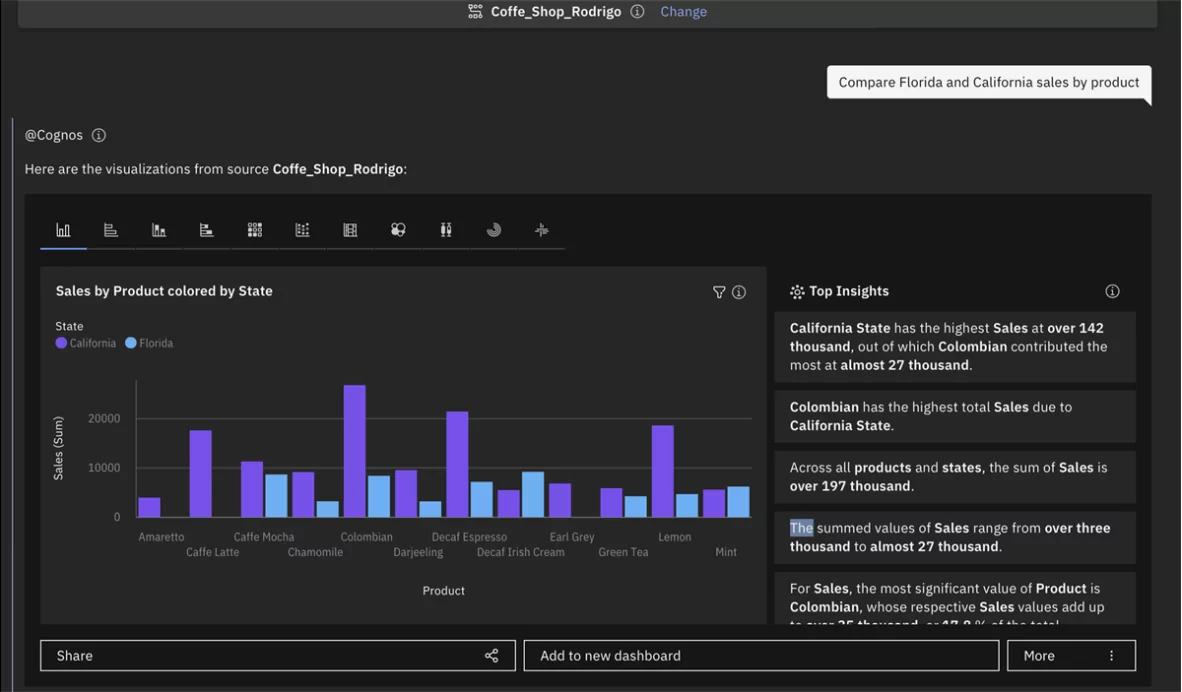
IBM Cognos Analytics saves the time spent on data cleaning by incorporating AI-assisted preparation. Users can also join data, including calculated fields, create tables, create interactive dashboards quickly, drag-and-drop data to build auto-generated visualizations, carry deep detailing, and share them through Slack or email.
IBM Cognos Analytics has an AI assistant to answer questions and predict trends with time-series modeling. It updates the stakeholders automatically while crafting and sharing personalized, dynamic, and multi-page reports presented in the stakeholder’s preferred format.
IBM Cognos Analytics helps to gain deep insights even with no background in data science necessarily. Users can validate the information and identify new things with pinpoint patterns and accurate forecasting. It helps users stay in the loop with their mobile application to access data while directly getting real-time alerts.
IBM Cognos Analytics Pros
Deploy on-premise, IBM Cloud, or third-party cloud platform
Governed self-service analytics for protection against misuse
Web-based data modeling with uploading and joining features
IBM Cognos Analytics Cons
Advanced reporting features are only available to premium users
Steep learning curve for non-technical users
IBM Cognos Analytics Pricing
| Plan | Pricing (user/month) | Offerings |
|---|---|---|
| Standard | $10.6 | AI Assistant, Mobile app, View saved report output, Receive email reports, View/interact with active reports |
| Premium | $42.4 | Create and edit reports, Run reports in HTML, CSV, Excel and more, Schedule reports and jobs, Save report output in Cognos, Exploration |
Tableau
Best for Data Visualization and Storytelling

Tableau minimizes the regular tasks of a business and enhances its data-driven decision-making process. Its visual analytics solution can solve complex problems with ease. Users can drive better business outcomes with its data governance, data storytelling, collaboration, and visual analytics.
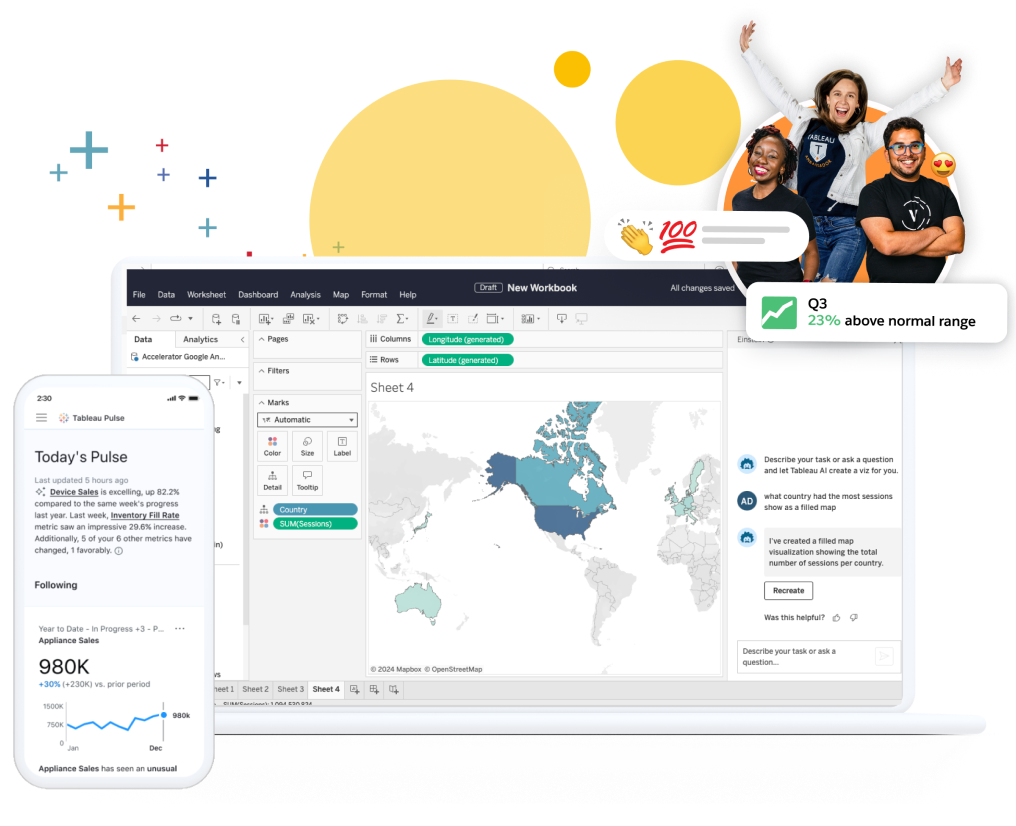
Tableau bridges the gap between engagement and interaction using drag-and-drop functionality. It enables users to explore more data over time with an AI-driven model. It lets users manage all the data with security, maintenance, compliance, governance, and support.
Tableau Cloud enables users to make insight-driven, smarter decisions with its cloud-based solution. Tableau Desktop gives everything needed to view, analyze, and access data. Users can explore hidden data with its drag-and-drop feature and speed up decision-making.
Tableau Prep Builder comes with a modern approach to preparing data and making it easier to clean and use for analysis.
Tableau Pros
Integration with Salesforce Customer 360 for a shared view of customer data
1 year free service of Tableau Desktop, Prep, and eLearning for students and teachers
Intuitive interface, offering quick data-driven insights using AI
Tableau Cons
Data Cloud feature is only available with Tableau+
Multiple subscription plans can be confusing
Tableau Pricing
Contact Tableau sales to know pricing information.
Oracle BI
Best for Oracle Ecosystem Integration
Oracle Business Intelligence offers an end-to-end and integrated business performance system to build a better company. It includes BI tools like reporting, alerting, data integration, analysis, data management, queries, desktop integration, and more. It helps to manage financial performance, data warehousing, and business intelligence applications.
Oracle BI has a scalable business intelligence server that shows old and current data so that users can compare them to make data-driven decisions. It allows data calculation and access centrally, which is crucial for all team members to easily access data in any form. This BI server comes with features including ad hoc queries, OLAP analysis, dashboards, data mining, production reporting, and interaction reports.
Oracle BI platform supports integrated analysis, information delivery, and access options. Different teams can access different data on the same architecture, enabling an amazing user experience. Its real-time decision server combines predictive analytics and rules to give solutions for decision-making.
Oracle BI Pros
Phone and live chat support
Alerts users via email, dashboard, and mobile
Web architecture with live reports, prompts, charts, pivot tables, graphics, and tickers
Oracle BI Cons
Technical support needs improvement
Complex software compared to many competitors
Oracle BI Pricing
Contact the Oracle BI sales team for pricing information.
SAP BusinessObjects
Best for Large Enterprises Using SAP Solutions
SAP BusinessObjects’ BI suite allows users to access real-time insights and make informed decisions. It provides a centralized place to report, share, and visualize data. Since it is an on-premise BI layer, it can transform data into valuable insights for anytime, anywhere access.
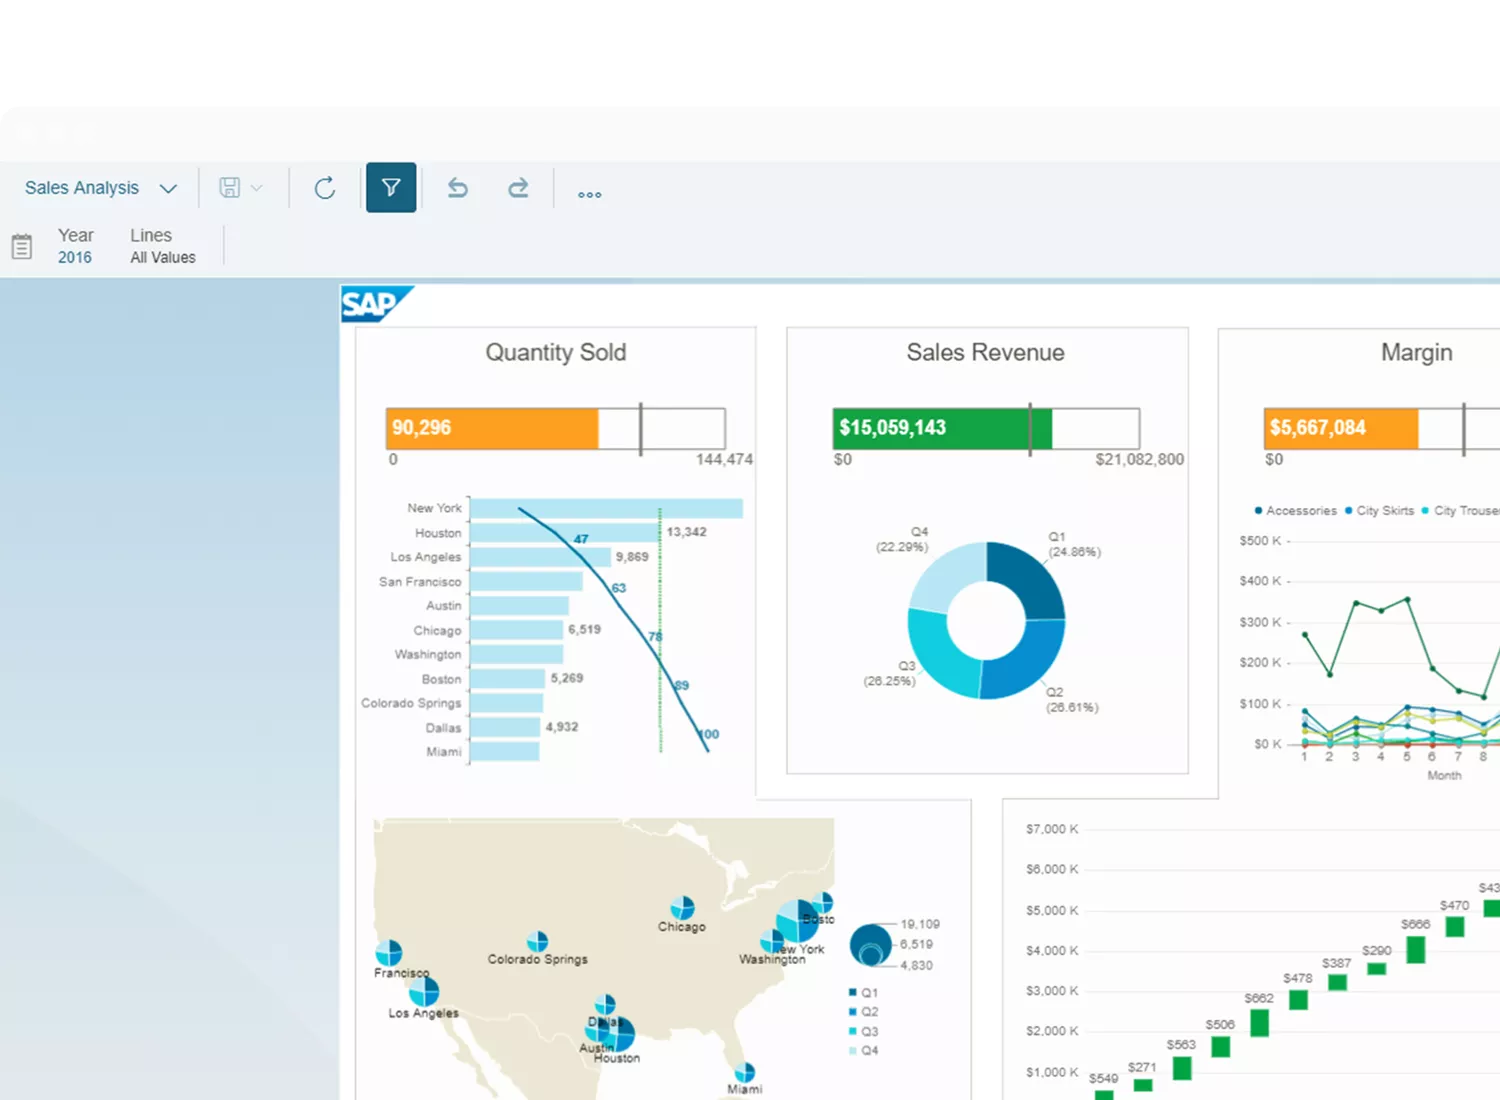
With SAP’s flexible architecture, users can access multiple interfaces and tools in a single place to get real-time, personalized, and simplified data. It enables users to identify trends and problems using BI reporting and ad hoc queries. They can access its self-service and intuitive tools to combine historical and present data to analyze trends and make decisions.
Users can create role-based and interactive dashboards for their teams. By integrating Microsoft 365 tools, users can enhance their data analysis capabilities by filtering and manipulating data. It also supports connection with SAP HANA and SAP Business Warehouse to access real-time analytics.
SAP offers a complete roadmap that helps explore present options to make innovations and decide on new product functions. It helps users view their risks, identify opportunities, and enhance productivity.
SAP BusinessObjects Pros
Increased user autonomy
Scalable and flexible architecture
Basic and advanced trial
SAP BusinessObjects Cons
Transparent pricing is not available
Capterra users complained about the difficulty in setting up
SAP BusinessObjects Pricing
Request a custom quote from the SAP BusinessObjects team.
Domo
Best for Real-time Data and Mobile Dashboards
Domo is a BI software that offers dashboard, reporting, and AI-generated insights so businesses can make the right move based on their current situation. Its drag-and-drop interface makes complex datasets consumable through data visualization. It has a collection of 150+ types of charts, including Trellis charts, data science charts, and period-over-period charts.
Domo has 7000+ custom maps, along with the facility to upload user-created maps. Users can filter and sort data on this platform without changing the views of other users. Its Beast Modes allow users to calculate new metrics from different datasets. Domo supports exporting raw data and visuals into CSV, Excel, PDF, and PPT formats.
Domo enables businesses to create branded data stories for data analysis guides without any coding. It lets users include variables in the interactive dashboard to customize it according to any business scenario. Users can apply page and chart filters and get alerts via email, web, and mobile devices. Scheduled reports, augmented analysis, a branded toolkit for embedded analytics, and bi-directional filter parameters are other key features of this software.
Domo Pros
30-day free trial
A library of over 1,000 pre-built connectors
Native iOS and Android mobile apps
Domo Cons
Support service is available as an add-on
Enterprise apps and training are not included in subscription plans
Domo Pricing
Contact Domo sales for pricing information.
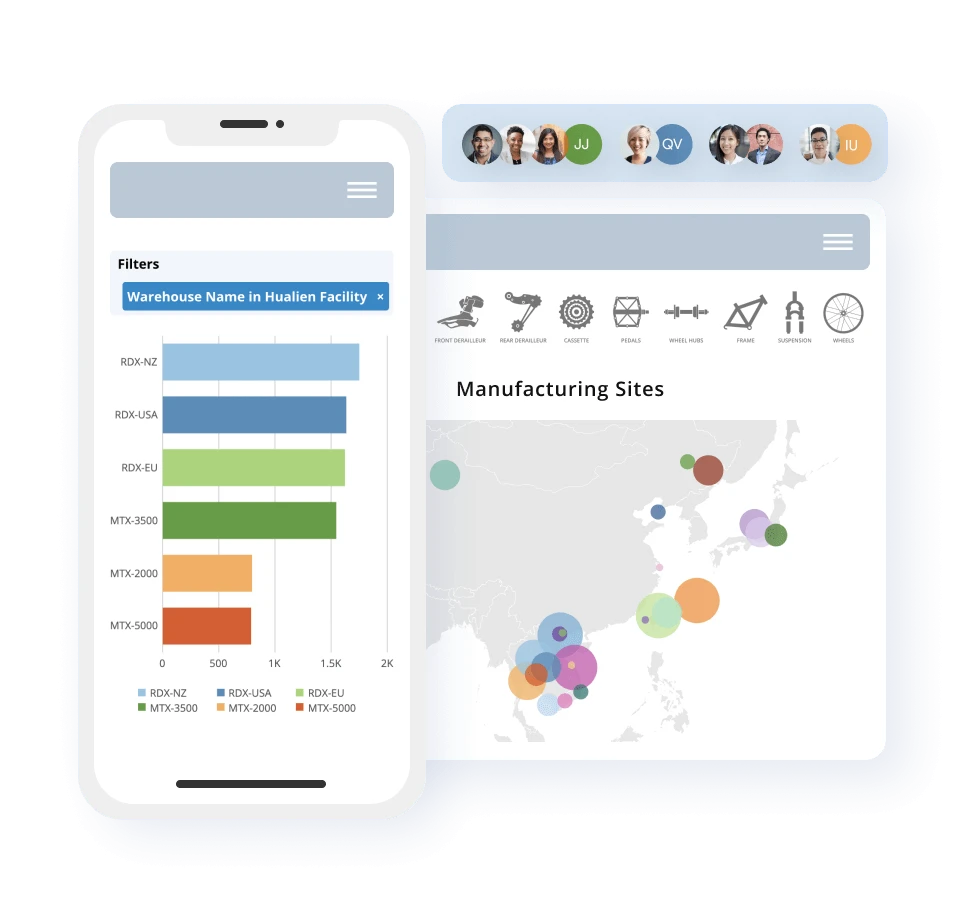
RIB BI+
Best for Construction and Real Estate Businesses
RIB BI+ is a perfect solution for data analysts, C-suite executives, and operational teams in the construction industry. It offers centralized access to all their data and a user-friendly interface to generate professional construction dashboards with interactive visuals. These boost strategic decision-making and project efficiency while keeping costs in control.
RIB BI+ uses neural networks, pattern recognition, and ML technologies to self-learn and find data patterns, anomalies, and seasonality. It can alert users based on predefined parameters. Its dashboard is customizable to meet organizational needs and allows users to add interactive filters to answer any questions during the analysis.
RIB BI+ has a robust integration capability to connect all data sources for fetching data in a central location. It offers an overview of existing reports, while users can also create standard or custom reports. RIB BI+ allows users to set up automatic weekly or monthly report generation. Admins have the option to manage the roles of employees, such as who can view or edit the data.
RIB BI+ Pros
Intelligent KPI monitoring system for over 300 KPIs
Automatic real-time overview using classic thresholds and AI
25+ construction dashboard templates containing industry-specific KPIs
RIB BI+ Cons
Software suitable for construction use cases only
Does not offer a free trial
RIB BI+ Pricing
Contact the RIB BI+ sales team to get the pricing information.
Spotfire
Best for Data Scientists
Spotfire empowers data scientists with a point-and-click, no-code platform that can analyze data at rest and in transit together. This visual analytics platform also comes with data science and streaming capabilities. It allows users to collect structured and unstructured data from varying sources in one place.
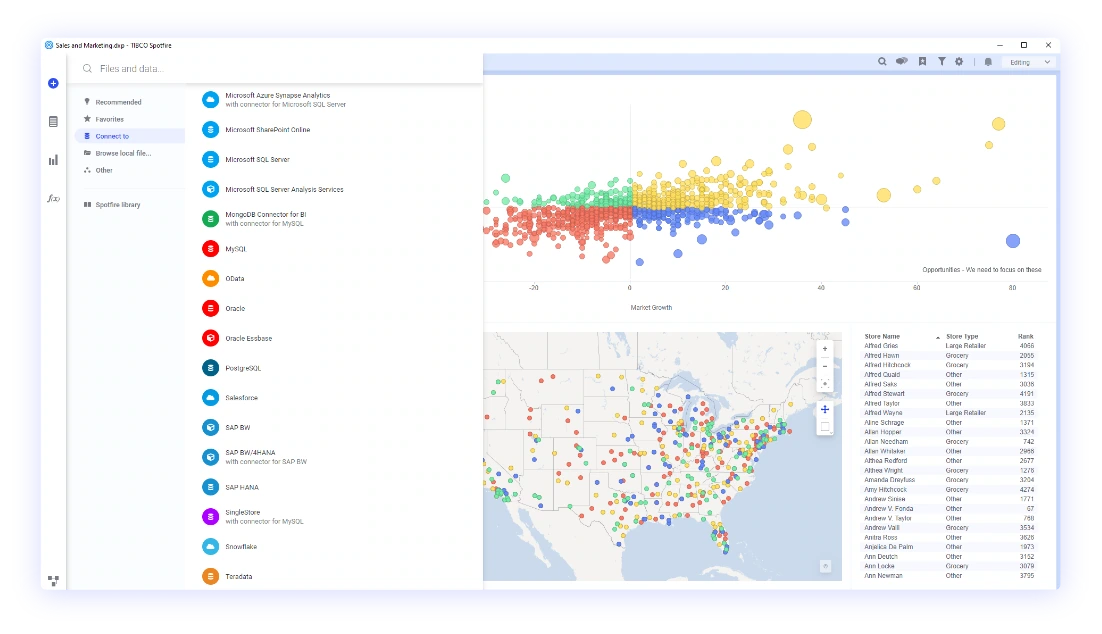
Spotfire also conducts tasks like data wrangling, data transformation, and data cleaning to help with visual data exploration. Its single-pane-of-glass dashboard helps with quick data discovery. Spotfire enables businesses to democratize and operationalize machine learning across their organization using reliable, governed data science models.
Spotfire lets users apply learning algorithms to live stream data in real-time. Live streaming can be embedded in applications or surfaced in operational dashboards. It also provides guided and interactive advanced analytics where interactive discovery is possible through an immersive visual experience.
Spotfire Pros
Supports R and Python for data science workflows
“What if” predictive and prescriptive analytics
Native Python and R engines for speedy, high-value insights
Spotfire Cons
Complex software functionality
Too many features can be overwhelming
Spotfire Pricing
Contact Spotfire to get pricing information.
What is a BI Tool?
BI tools are software that collects past and current data to process and analyze it to understand future trends. It generates actionable insights, creates interactive reports, and simplifies business decision-making. These platforms offer other features, including data visualization, KPI scorecards, visual analytics, and interactive dashboards.
How does BI Help Businesses Understand Data?
The human brain is wired in such a way that it catches visual triggers quickly to get fully immersed in something. When someone looks at an image or graphic, it becomes much easier for them to understand things instead of scrolling through unending texts or spreadsheets. BI tools are built keeping this aspect of the human brain in mind. It makes data easy to grasp by creating valuable insights out of them.
BI tools help businesses understand data by transforming it into visually appealing formats like charts, graphs, heat maps, images, videos, and infographics. However, the functioning of BI tools goes beyond visualization. It collects, stores, cleans, and analyzes data to identify hidden patterns, trends, and anomalies.
How Does a BI Tool Work?
BI tools work in the following steps:
- Accessing and viewing data
- Interacting with them
- Analyzing and discovering meaningful information beneficial for business
- Sharing that information with the team for further implementation
- Promoting and governing insightful data to make better business decisions, along with future planning
Benefits of BI tools
The benefits of BI tools are outlined below.
- Brings together every relevant data from multiple endpoints such as portals, CRMs, ERPs, databases, flat files, APIs, etc.
- Help businesses to create self-service analytics without any IT support. It’s because these tools make everything clear and concise so that users can easily understand. Next, they can effortlessly generate reports that make sense and perform queries as well.
- Predictive analysis can be achieved with these tools to shape future decisions based on trends. If conditions change at a later phase or an anomaly occurs, you can receive intelligent alerts that help you react instantly.
- Due to automation with BI tools, you can save time using a drag-and-drop editor from their interactive dashboard.
- It saves business expenditure and time that otherwise is wasted on inaccurate planning.
What is the Difference between BI and Data Analytics Tools?
The difference between BI tools and data analytics tools is that BI tools present historical and current data to help with decision-making. In contrast, data analytics tools perform predictive analysis for immediate insights and future trends. BI tools display past and present data in a consumable format so users can understand them and make informed choices. Data analytics tools deploy advanced techniques to explore possibilities and guide strategic directions.
Can I Use Excel as a Business Intelligence Tool?
Yes, you can use Excel as a basic BI tool, as it offers primary business intelligence features like data visualization and data analysis. To get the advanced BI functionalities, you need to get Microsoft 365 Enterprise plans with dedicated BI tools like Power BI.
Final Words
Data has a huge role in shaping business operations and outcomes. Organizations can utilize the available data in various ways to make better decisions. This is why business intelligence tools can help with better planning and execution using insightful data. From this comparative discussion, companies should be able to find the BI tool that is suitable for them.