Monitoring webserver is essential to see what’s happening on your website. Lately, I was looking for some sort of solution and came across ngxtop, which helps you to monitor various metrics, including the following.
- Current active request
- Total request counts summary
- Total request by status code (2xx, 3xx, 4xx, 5xx)
- Average byte sent
- Top remote address
In this article, I’ll explain how to install and use ngxtop for Linux and Ubuntu OS.
Previously, I have used GoAccess Log Analyzer and found ngxtop is a lightweight and good choice for Nginx web server metrics monitoring.
This assumes you have Nginx installed and running. If not, then you can refer to my installation guide.
A little introduction about ngxtop
ngxtop is a python based program, which you can install on top of Python. Once installed, you can execute ngxtop, and you will notice it looks like the typical top output on Linux but with Nginx related information.
To Install ngxtop on CentOS/RHEL
First, you need to install PIP (Python Package Management System).
To do so…
- Login to your server with root credential
- Enable EPEL repository by installing below package
yum install epel-releaseNow, install pip with below command
yum install python-pipAnd finally, use below to install ngxtop
pip install ngxtopIf using CentOS/RHEL 8 then you can use the DNF command like the following.
dnf install epel-release python2 python2-pip
pip2 install ngxtop
To Install ngxtop on Ubuntu
Use below command to install PIP
apt-get install python-pipAnd now use following to install ngxtop
pip install ngxtopInstallation is easy. Isn’t it? Let’s see some of the real-time metrics.
Nginx Activity Summary
Use ngxtop command to view the summary of request count, requested URI, the number of requests by status code.
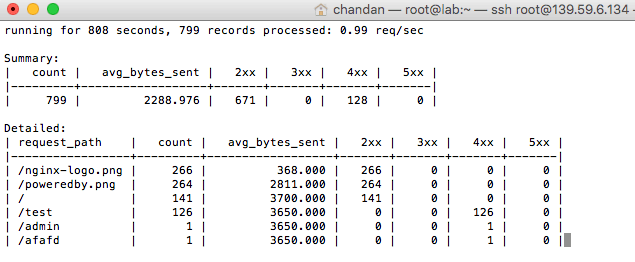
Tip: you can use to find a broken link by looking at a request, which has a status code as 404.
Check top client’s IP
It’s very handy to see who is making a large number of requests to your Nginx server.
ngxtop top remote_addr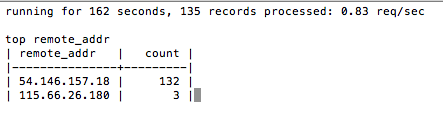
How about displaying requests only, which has a 404 status code?
ngxtop -i 'status >= 404'It’s not just real-time, but also you can analyze it offline by parsing access log.
To analyze access.log, you can use:
ngxtop –l /path/access.logAnother example would be to parse the offline access.log from Apache.
ngxtop –f common –l /path/access.logThere are multiple combinations you can use to filter out access.log for meaningful data. Next, you may want to try out Nginx Plus.