Do you know your website’s average response time? Do you know how many concurrent users your site can handle?
Load testing is essential for web applications to know website capacity. If you are to choose the webserver, then one of the first things you want to do is perform the load testing and see which one works well for you.
Benchmarking can help you to decide;
- Which web server works the best
- Number of servers you need to serve x number of requests
- Which configuration gives you the best results
- Which tech stacks perform better
- When your site performs slower or breakdown
There are several online tools to perform a stress test; however, if you are looking for an in-house solution or want to benchmark just the webserver performance, then you can use ApacheBench and alternatively some of the below-listed tools.
I’ve used Apache & Nginx web server hosted on DigitalOcean to test it.
ApacheBench
ApacheBench (ab) is an open-source command-line program that works with any web server. In this post, I will explain how to install this small program and perform the load test to benchmark the results.
Apache
Let’s get ApacheBench installed by using a yum command.
yum install httpd-toolsIf you already have httpd-tools, then you may ignore this.
Now, let’s see how it performs for 5000 requests with a concurrency of 500.
[root@lab ~]# ab -n 5000 -c 500 http://localhost:80/
This is ApacheBench, Version 2.3 <$Revision: 655654
gt; Copyright 1996 Adam Twiss, Zeus Technology Ltd, http://www.zeustech.net/ Licensed to The Apache Software Foundation, http://www.apache.org/ Benchmarking localhost (be patient) Completed 500 requests Completed 1000 requests Completed 1500 requests Completed 2000 requests Completed 2500 requests Completed 3000 requests Completed 3500 requests Completed 4000 requests Completed 4500 requests Completed 5000 requests Finished 5000 requests Server Software: Apache/2.2.15 Server Hostname: localhost Server Port: 80 Document Path: / Document Length: 4961 bytes Concurrency Level: 500 Time taken for tests: 13.389 seconds Complete requests: 5000 Failed requests: 0 Write errors: 0 Non-2xx responses: 5058 Total transferred: 26094222 bytes HTML transferred: 25092738 bytes Requests per second: 373.45 [#/sec] (mean) Time per request: 1338.866 [ms] (mean) Time per request: 2.678 [ms] (mean, across all concurrent requests) Transfer rate: 1903.30 [Kbytes/sec] received Connection Times (ms) min mean[+/-sd] median max Connect: 0 42 20.8 41 1000 Processing: 0 428 2116.5 65 13310 Waiting: 0 416 2117.7 55 13303 Total: 51 470 2121.0 102 13378 Percentage of the requests served within a certain time (ms) 50% 102 66% 117 75% 130 80% 132 90% 149 95% 255 98% 13377 99% 13378 100% 13378 (longest request) [root@lab ~]#So as you can see, Apache has handled 373 requests per second, and it took a total of 13.389 seconds to serve the total requests.
Now you know the default configuration can serve these many requests so when you make any configuration changes you can do the test again to compare the results and choose the best one.
Nginx
Let’s make the test what we did for Apache so you can compare which one performs better.
[root@lab ~]# ab -n 5000 -c 500 http://localhost:80/
This is ApacheBench, Version 2.3 <$Revision: 655654
gt; Copyright 1996 Adam Twiss, Zeus Technology Ltd, http://www.zeustech.net/ Licensed to The Apache Software Foundation, http://www.apache.org/ Benchmarking localhost (be patient) Completed 500 requests Completed 1000 requests Completed 1500 requests Completed 2000 requests Completed 2500 requests Completed 3000 requests Completed 3500 requests Completed 4000 requests Completed 4500 requests Completed 5000 requests Finished 5000 requests Server Software: nginx/1.10.1 Server Hostname: localhost Server Port: 80 Document Path: / Document Length: 3698 bytes Concurrency Level: 500 Time taken for tests: 0.758 seconds Complete requests: 5000 Failed requests: 0 Write errors: 0 Total transferred: 19660000 bytes HTML transferred: 18490000 bytes Requests per second: 6593.48 [#/sec] (mean) Time per request: 75.832 [ms] (mean) Time per request: 0.152 [ms] (mean, across all concurrent requests) Transfer rate: 25317.93 [Kbytes/sec] received Connection Times (ms) min mean[+/-sd] median max Connect: 0 6 11.0 2 53 Processing: 5 19 8.2 17 53 Waiting: 0 18 8.2 16 47 Total: 10 25 17.4 18 79 Percentage of the requests served within a certain time (ms) 50% 18 66% 21 75% 21 80% 22 90% 69 95% 73 98% 75 99% 76 00% 79 (longest request) [root@lab ~]#WOW!
Did you see that?
Nginx handled 6593 requests per second! A winner.
So you see just comparing with two web servers you will get an idea which one to choose for your web application.
The above test is on CentOS 6.8, 64 bit. You can try multiple combinations of OS & Web Server version for the optimal results.
Don’t like ApacheBench for whatever reason? No worries, there are plenty of others you can use to perform HTTP load.
SIEGE
SIEGE is an HTTP load test utility supported on UNIX. You can put multiple URL’s in a text file to load tests against. You can install siege using yum.
# yum install siege
Let’s run the test with 500 concurrent requests for 5 seconds.
[root@lab ~]# siege -q -t 5S -c 500 http://localhost/
Lifting the server siege...      done.
Transactions:                       4323 hits
Availability:               100.00 %
Elapsed time:                       4.60 secs
Data transferred:        15.25 MB
Response time:                    0.04 secs
Transaction rate:       939.78 trans/sec
Throughput:                         3.31 MB/sec
Concurrency:                      37.97
Successful transactions:        4323
Failed transactions:                0
Longest transaction:            1.04
Shortest transaction:            0.00
[root@lab ~]#
To break down the parameters.
-q – to run it quietly (not showing request details)
-t – run for 5 seconds
-c – 500 concurrent requests
So as you can see, the availability is 100% and the response time is 0.04 seconds. You can tweak the load test parameter based on your goal.
Ali
Ali is a relatively new load testing tool to perform real-time analysis. It supports multiple platforms to install, including Docker.
Once installed, execute ali to see the usage details.
root@lab:~# ali
no target given
Usage:
  ali [flags] <target URL>

Flags:
  -b, --body string         A request body to be sent.
  -B, --body-file string    The path to file whose content will be set as the http request body.
      --debug               Run in debug mode.
  -d, --duration duration   The amount of time to issue requests to the targets. Give 0s for an infinite attack. (default 10s)
  -H, --header strings      A request header to be sent. Can be used multiple times to send multiple headers.
  -k, --keepalive           Use persistent connections. (default true)
  -M, --max-body int        Max bytes to capture from response bodies. Give -1 for no limit. (default -1)
  -m, --method string       An HTTP request method for each request. (default "GET")
  -r, --rate int            The request rate per second to issue against the targets. Give 0 then it will send requests as fast as possible. (default 50)
  -t, --timeout duration    The timeout for each request. 0s means to disable timeouts. (default 30s)
  -v, --version             Print the current version.

Examples:
  ali --duration=10m --rate=100 http://host.xz

Author:
  Ryo Nakao <[email protected]>
root@lab:~#
As you can see above, you have an option to send HTTP headers, test duration, rate limit, timeout, and more. I did a quick test on Geekflare Tools and here is the output looks like.
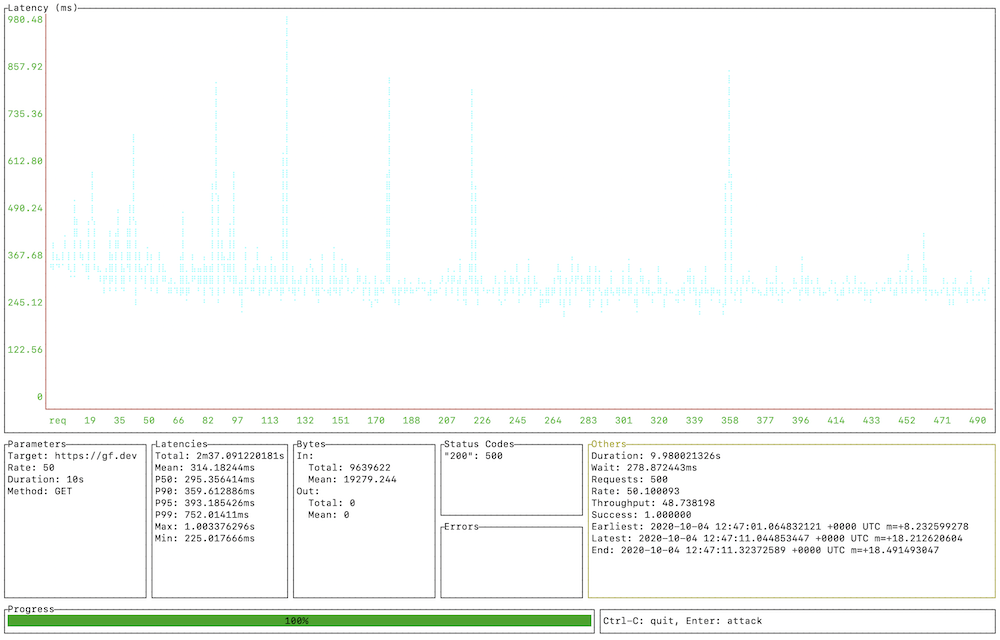
The report is interactive and gives detailed latency information.
Gobench
Gobench is written in Go language and simple load testing utility to benchmark the web server performance. It supports more than 20,000 concurrent users which ApacheBench doesn’t.
Apache JMeter
JMeter is one of the most popular open-source tools to measure web application performance. JMeter is java based application and not only a web server, but you can use it against PHP, Java. ASP.net, SOAP, REST, etc.
JMeter got decent friendly GUI, and the latest version 3.0 require Java 7 or higher to launch the application. You must give a try to JMeter if your goal is to optimize the web application performance.
wrk
wrk is another modern performance measurement tool to put a load on your web server and give you latency, request per second, transfer per second, etc. details.
With wrk, you can specify to run a load test with a number of threads.
Let’s take an example of running a test for 5 minutes with 500 concurrent users with 8 threads.
wrk –t8 –c500 -d300s http://localhostAutocannon
Inspired by work, autocannon is written in Node.js. You can use it programmatically, through API or standalone utility. All you need is NodeJS installed as a prerequisite.
You can control a number of connections, requests, duration, workers, timeout, connection rate and offer tons of options to benchmark your web applications.
Curl-loader
curl-loader is written in C to simulate application load, and it supports SSL/TLS. Along with the web page test, you can also use this open-source tool to perform load on FTP servers.
You can create a test plan with a mix of HTTP, HTTPS, FTP, and FTPS in a single batch configuration.
httperf
The httperf is a high-performance tool that focuses on micro and macro-level benchmarks. It supports HTTP/1.1 and SSL protocols.
If you have the expected number of concurrent users and looking to test if your web server can serve a number of a request, you can use the following command.
httperf --server localhost --port 80 --num-conns 1000 --rate 100The above command will test with 100 requests per second for 1000 HTTP requests.
Tsung
Tsung is a multi-protocol distributed stress testing tool to stress HTTP, SOAP, PostgreSQL, LDAP, XAMP, MySQL server. It supports HTTP/1.0, HTTP/1.1, and cookies are automatically handled.
Generating a report is feasible with Tsung.
Conclusion
I hope the above benchmarking tools give you an idea about your web server performance and decide what works best for your project.
Next, don’t forget to monitor your website performance.