Today’s IT networks are complex. They span cloud, on-prem, and hybrid environments, making monitoring and management a real challenge.
ManageEngine OpManager has helped businesses manage networks for 15+ years. But is it still reliable? Are there any downsides? How does it compare to alternatives? I will answer these questions and more in this detailed ManageEngine OpManager review.
What Is OpManager?
ManageEngine OpManager is a network and server monitoring software. It helps your IT teams monitor the performance of various network devices, including routers, switches, load balancers, storage devices, virtual machines, firewalls, and more.
With its real-time network and server insights, your IT team can discover the root causes of network issues affecting performance and fix them. And the best part is your team doesn’t have to go through various tools, GUIs, graphs, and reports to get to the bottom of the issues.
ManageEngine is an IT management division of Zoho Corporation. It has been serving businesses and enterprises since 2002. It has about 40,000 customers worldwide, including Sony Pictures, Siemens, Vodafone, DHL, and many other global brands.
Top 9 Reasons to Use OpManager
I didn’t want to write a surface-level review for OpManager. So, I have subscribed to ManageEngine OpManager’s free trial to explore its various features in detail.
Here are the top features I found super helpful in network and server monitoring to optimize performance.
1. Comprehensive Network Management
ManageEngine OpManager isn’t just network monitoring software. It helps you stay ahead and manage your network proactively. You get full control, so outages drop significantly.
With OpManager, you manage all critical aspects of your network, such as:
- Administration: OpManager includes network configuration management modules to manage configuration changes. And its inbuilt tools such as MIB browser, Traceroute, and remote control aid in troubleshooting. Its network assessment tool lets you check if your IT infrastructure is in line with your business goals to form a reliable network strategy.
- Network provisioning: It offers tools like capacity planning reports and IP address & switch port management to help you figure out network trends and provision your network. It helps you manage your resources effectively.
- Maintenance: OpManager helps you find and fix faults in your network before they impact end users.
- Operations: Network performance declines over time. OpManager helps maintain 99.9% uptime and meets SLAs with real-time business dashboards.
- Security: OpManager’s firewall analyzer offers you insights into malicious traffic. And NetFlow bandwidth management helps you get real-time visibility into your network and analyze network bandwidth for performance and security.
- Automation: OpManager’s automated workflows can help you automatically stop/restart services or processes, shut down/restart/suspend a VM, backup network configuration automatically, and more.
I really liked OpManager’s automated workflows. They can save you tons of time.
2. Automated Network Discovery
OpsManager detects and automatically maps a wide range of network devices. Scheduling automated device discovery saves you tons of time, as you won’t need to manually add or remove devices regularly.
Furthermore, it offers detailed device discovery reports that you can schedule to receive via email whenever the tool performs a device discovery function.
You can classify device models automatically using a set of pre-configured device templates. And a good thing is that these device templates have predefined monitors and variable threshold settings.
So, you will receive alerts whenever SLA metrics are violated. At present, ManageEngine OpManager supports over 11,000 device templates.
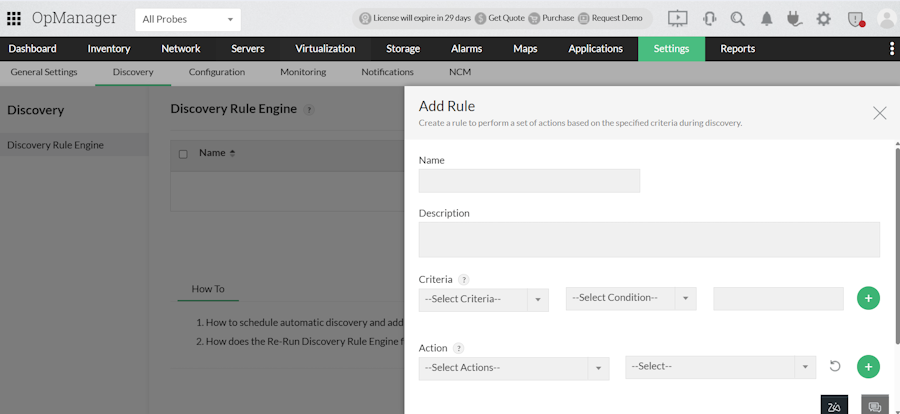
OpManager also lets you automate all the post-discovery actions that otherwise require manual intervention. Examples of these actions include plotting the device on maps or linking service monitors.
3. In-depth Server Monitoring
OpManager helps you boost your server health with in-depth monitoring and automation. It leverages ICMP, WMI, SNMP, and TCP protocols to check your server’s availability status.
What’s more, it lets you track packet loss and response time. As a result, you can find and fix latency issues originating from your server.
In my research, I have observed that OpManager allows you to monitor, restart, and terminate processes/services in just a few clicks. You can see all processes running on your servers and gather detailed information, such as Process Name, Process ID, Process Path, and Process Arguments.
Its Remote Process Diagnostics feature enables you to terminate problematic processes remotely with ease.
It offers well-designed dashboards, graphs, and severity-based alerting to help you proactively prevent server performance issues.
I liked the fact that OpManager offers unified server monitoring across vendors and entities. So you can use it to monitor all servers—mail, database, Windows, and Linux—in one place.
OpManager is one of the most widely used Windows server monitoring tools.
4. Enterprise Application Monitoring
ManageEngine OpManager’s application monitoring feature lets you proactively monitor your applications to prevent failure and degradation.
It can monitor the following applications:
- Microsoft Exchange Monitor
- MySQL Monitor
- Lotus Notes Monitor
- MSSQL Monitor
I’m impressed with OpManager’s capability to monitor applications. It can monitor any application that supports SNMP and send notifications if a threshold violation occurs in your application. I can say that it is one of the most powerful application monitoring tools.
If you want to monitor J2EE web transactions, SAP servers, and Microsoft .NET applications, you will need an application manager plug-in that offers out-of-the-box monitoring support for 130+ applications and servers.
The key highlights of the OpManager application performance manager (APM) plug-in include, but are not limited to:
- Automatic application discovery
- Comprehensive performance management
- Root cause analysis and bottleneck identification
- End-user experience monitoring
OpManager and APM Plug-in provide you with integrated network application monitoring.
5. Storage Management
ManageEngine OpManager has an integrated storage monitoring solution to help you manage all your network storage devices. And the best thing is you don’t have to jump over different dashboards. A single pane allows you to manage all storage devices.
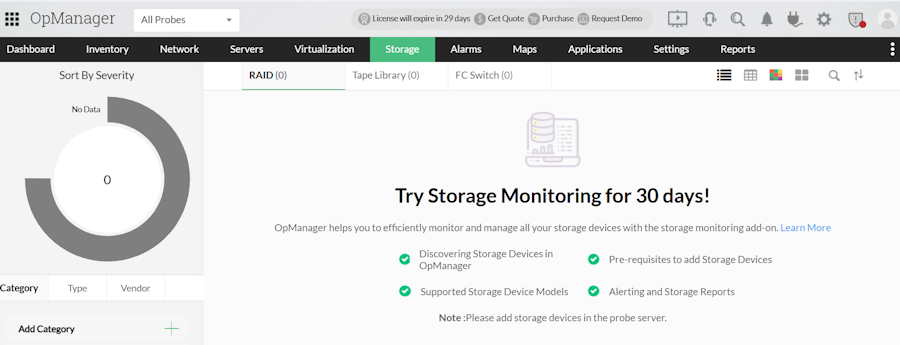
The key features of the OpManager storage monitoring solution include:
- Storage RAID management: It monitors the Redundant Array of Independent Disks (RAIDs) to keep tabs on the health, availability, and utilization of storage. If it detects any issue with hardware or software, you will get alerts. For a trend analysis, you can generate reports based on the performance and availability of storage RAID over a period of time.
- Tape library monitoring & management: OpManager auto-discovers tape libraries and tracks status, operations, and usage. Then, it generates reports on downtime and trends.
- Storage capacity forecasting: It enables you to predict storage capacity by utilization and growth trend. You will receive an alert when a capacity threshold is breached. You can schedule reports based on capacity trends.
- Fabric switch management: It monitors and manages fabric switches. You can see asset and configuration details, capacity, and performance of switches in OpManager. Real-time graphs and threshold-based alerts help you monitor and manage fabric switches with ease.
In my research, I’ve noted that OpManager employs machine learning to forecast potential storage failures and optimize performance. So you can rest assured about early issue detection and smoother operations.
6. Fault Management and Intelligent Alarms
The fault management feature of OpManager detects faults in your network through active and passive monitoring.
Active fault management checks devices in real-time using TCP or UDP port checks, custom scripts, ICMP ping, remote queries, and more.
However, passive fault monitoring looks for events that signal faults or failures. It can be checked through syslog messages, SNMP traps, Windows Event Log messages, and more.
After detecting faults, it finds out actionable faults through duplication, correlation, and root cause analysis (RCA).
Once actionable events are isolated, the OpManager automated fault management system notifies you about them.
To enable trouble-ticketing, it supports Jira, ServiceNow, and ServiceDesk Plus. You also have multiple alerting options, including Telegram, email, SMS, and your smartphone GUI.
OpManager enables you to troubleshoot faults through automation and manually using built-in, web-based troubleshooting tools.
7. Advanced Performance Monitoring and Analysis
OpManager lets you monitor various attributes of your network to improve operational efficiency, minimize disruptions, and save costs through proactive issue resolutions. Its network monitoring covers network activity monitoring, Wi-Fi monitoring, VPN monitoring, Syslog monitoring, Cisco ACI monitoring support, and many more.
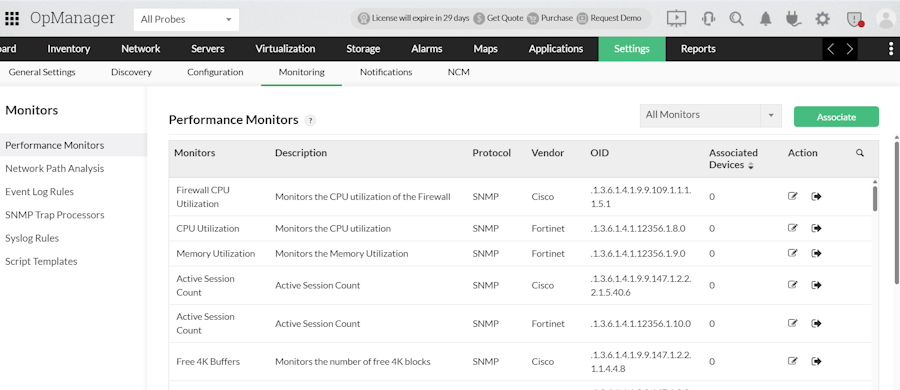
Here are the key highlights of OpManager network performance monitoring.
- Availability monitoring: It tracks all your connected devices for uptimes and response times. It will notify you via email or SMS if there is any issue, like packet loss or device failure.
- Traffic analysis: It detects bandwidth hogs by analyzing traffic and offers real-time and historical traffic data. As a result, your team can make informed decisions to ensure smooth operations.
- CPU and memory optimization: It tracks key metrics, such as CPU utilization, speed, and processor time. It also spots and fixes server performance bottlenecks. Consequently, you can proactively prevent performance degradation that might affect end users.
- Errors and discards: It monitors errors and discards so that they do not affect network performance.
- WAN performance management: It helps your IT team improve your WAN performance by monitoring WAN links for latency, bandwidth utilization, and availability.
After extensively reviewing OpManager’s product documents, I have observed that it offers real-time performance metrics with actionable reporting, to help you optimize your network for peak performance.
However, understanding intensive reports on utilization, traffic, and trends can be challenging if you have just started in IT administration.
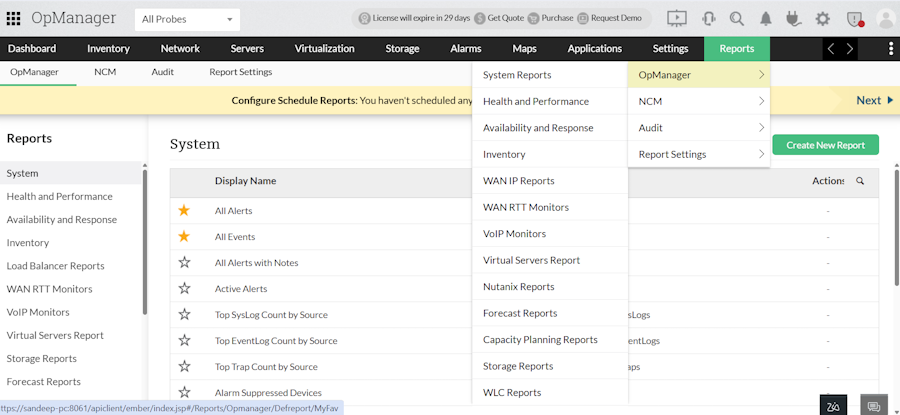
8. Customizable Dashboards and Reporting
I like the fact that OpManager lets you build and view key network metrics in one place. As a result, it saves time, improves visibility, and boosts response speed.
You can create network health dashboards tailored to your team’s roles and share them with others for better teamwork and faster, informed decisions across your IT team.
Another aspect of OpManager that I find helpful is its ability to create various types of reports to help you make informed decisions.
You can request detailed network performance reports that support 250 default bundled reporting profiles. These reporting profiles are grouped and classified based on factors such as availability and response, health and performance, inventory, storage, forecast, capacity planning, and more.
It also offers business snapshot-based reports that show the status of a group of devices or systems that support a specific business function.
By accessing forecast reports, you can predict the status of the resources in the near future.
You can easily schedule the automated emailing of these reports so that you don’t miss crucial information about your network or server.
9. AIOps and Intelligent Automation
ManageEngine OpManager uses machine learning to automate threshold settings. Instead of manually checking past data, OpManager studies performance trends over 14 days. It then predicts normal values for each monitor and sets thresholds using those forecasts.
As an admin, you only need to define deviation levels for alerts: Attention, Trouble, or Critical. If a device’s metric goes beyond those limits, OpManager raises the right alert.
For example, let’s say the forecasted CPU utilization monitor value is 60. The Attention, Trouble, and Critical deviation values are set to 5, 10, and 15.
In this case, alerts will be raised at:
- Attention: when CPU utilization reaches 65 (60 + 5)
- Trouble: when CPU utilization hits 70 (60 + 10)
- Critical: when CPU utilization climbs to 75 (60 + 15)
OpManager’s curated workflows allow you to automate mundane tasks. You can start/stop/resume services, processes, and automate various other tasks using over 70 workflow actions based on your defined conditions.
Is OpManager Difficult to Learn?
No, OpManager isn’t difficult to learn. The interface is user-friendly, and most features are easy to understand with basic IT knowledge. It also offers guided setup, built-in templates, and clear dashboards. The company also provides a customized demo to help users get started.
With its knowledge base, free training webinars, eBooks, how-to videos, and community support, you can easily get started even without deep IT knowledge.
OpManager Integrations
You can expand what OpManager can do by connecting it with other ManageEngine tools and third-party communication or IT ticketing tools.
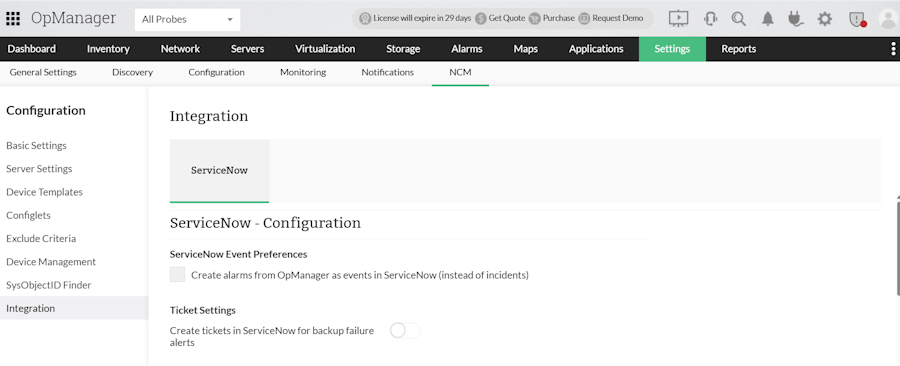
Here are popular OpManager integrations:
- ManageEngine Tools: ServiceDesk Plus (including cloud and MSP), Analytics Plus, Alarms One
- Third-party Tools: Jira Service Management, Slack, Microsoft Teams, Webhook, Red Hat Ansible,
ServiceDesk is quite helpful in automating ticket creation, tracking issues, accessing solutions, and managing assets more efficiently. OpManager also supports custom integrations with the help of webhooks and REST APIs.
I’m impressed with the availability of various OpManager add-ons (optional modules) that can boost its functionalities and capabilities.
Here are popular add-ons.
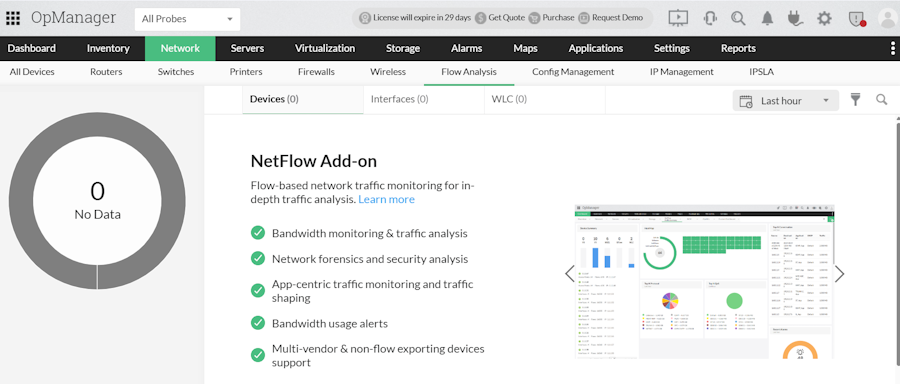
- Flow Analysis add-on: It provides real-time visibility into your network traffic.
- Log Analysis add-on: It offers you insights into firewall activity and identifies potential threats.
- Application monitoring add-on: It lets you monitor your application and services.
OpManager vs Full ITOM Suite from ManageEngine
Do you wonder how ManageEngine OpManager differs from OpManager Plus, a complete IT Operations Management (ITOM) suite from ManageEngine? I will explain next.
OpManager is focused more on network monitoring. But OpManager Plus is an all-inclusive platform offering unified IT operations, monitoring, vendor support, and more.
OpManager Plus has built-in add-ons for firewall management, application management, etc. A single subscription covers the cost of these add-ons.
On the other hand, you have to pay for these add-ons if you want to use them in OpManager.
In a nutshell, OpManager Plus includes everything OpManager has + extra ITOM tools for broader infrastructure management.
OpManager Drawbacks
Though ManageEngine OpManager is an excellent network monitoring tool, it has the following trade-offs.
- It can consume a lot of server memory and CPU, especially in large environments.
- Features like firewall management and application performance monitoring require extra charges.
- It doesn’t offer agent-based monitoring for Linux.
- The licensing model can be complex, with pricing based on the number of devices and selected add-ons.
How Much Does OpManager Cost?
ManageEngine OpManager offers three subscription tiers: Standard Edition, Professional Edition, and Enterprise Edition.
Here is a quick overview of these tiers.
| Feature | Standard Edition | Professional Edition | Enterprise Edition |
|---|---|---|---|
| Starting price | $245 for 25 devices | $345 for 25 devices | $4,595 for 250 devices |
| Multi-site/ Distributed network monitoring | ❌ | ✅ | ✅ |
| Schedule discovery | ❌ | ✅ | ✅ |
| Agent-based monitoring | ❌ | ✅ | ✅ |
| IT workflow automation | ❌ | ✅ | ✅ |
| AIOps | ❌ | ✅ | ✅ |
| Scheduled & forecasting reports | ❌ | ✅ | ✅ |
| Raw data maintenance | 7 days | 60 days | 180 days |
Add-ons are charged separately. ManageEngine OpManager offers a 30-day free trial.
It also offers a free plan that lets you monitor up to 3 devices with basic features.
What Are the Best OpManager Alternatives?
If you find OpManager complex, costly, or less flexible for your requirements, you can explore OpManager alternatives.
SolarWinds and PRTG are top choices for small and medium businesses looking for robust, all-in-one monitoring solutions. They’re known for ease of use and solid support.
Nagios and Zabbix, on the other hand, appeal to users who want full control. These open-source tools are flexible but need more setup and technical know-how.
OpManager Verdict – Scalable Network Monitoring Software
In my testing, ManageEngine OpManager stands out as a robust network monitoring tool. It gives clear insights into device health, server, and virtual machine health. Its real-time dashboards and visual maps help teams spot and solve issues fast. The unified view and automation features reduce manual effort and boost efficiency.
Thanks to its rich feature set, smart automation, and reliable performance, OpManager gets the Geekflare Value Award.
That said, the tool does have a learning curve during the initial setup. Also, the licensing model might feel a bit complex for new users.
Still, if you run a small or mid-sized business and want a powerful, scalable monitoring solution, OpManager is a solid choice.
Frequently Asked Questions (FAQs)
Yes, OpManager supports custom SNMP MIBs. You can create custom SNMP monitors using vendor-specific OIDs from the MIB.
The OpManager mobile app lets you monitor your IT network from anywhere. You get real-time alerts, device status, and access to network tools like Ping and Traceroute. It helps troubleshoot issues quickly, manage alarms, and stay informed with push notifications.
Yes, ManageEngine OpManager offers AI-based anomaly detection through its Adaptive Thresholding feature that uses machine learning to learn normal network behavior. It sets dynamic thresholds and alerts you when something unusual happens.