Unexpected API downtime can disrupt your business operations and frustrate users. You lose visibility into your applications’ health, leaving you with anxious questions like:
- Are you prepared for the next time your API goes down?
- How will you respond if users experience latency?
- What if a security breach compromises sensitive data?
This is where API monitoring becomes essential. It is the process of analyzing the performance and availability of your endpoints to ensure they function as expected.
API monitoring tools help you guarantee reliability by offering real-time visibility. You can track uptime, monitor endpoint performance, and detect issues before they impact your customers.
With the Monitoring Tools market set to achieve $69.57 billion by 2030 per Mordon Intelligence, the demand for API monitoring has never been greater.
Why Trust Our Guide
Top API Monitoring Tools Review
Checkly
E2E Monitoring for APIs and Web Services
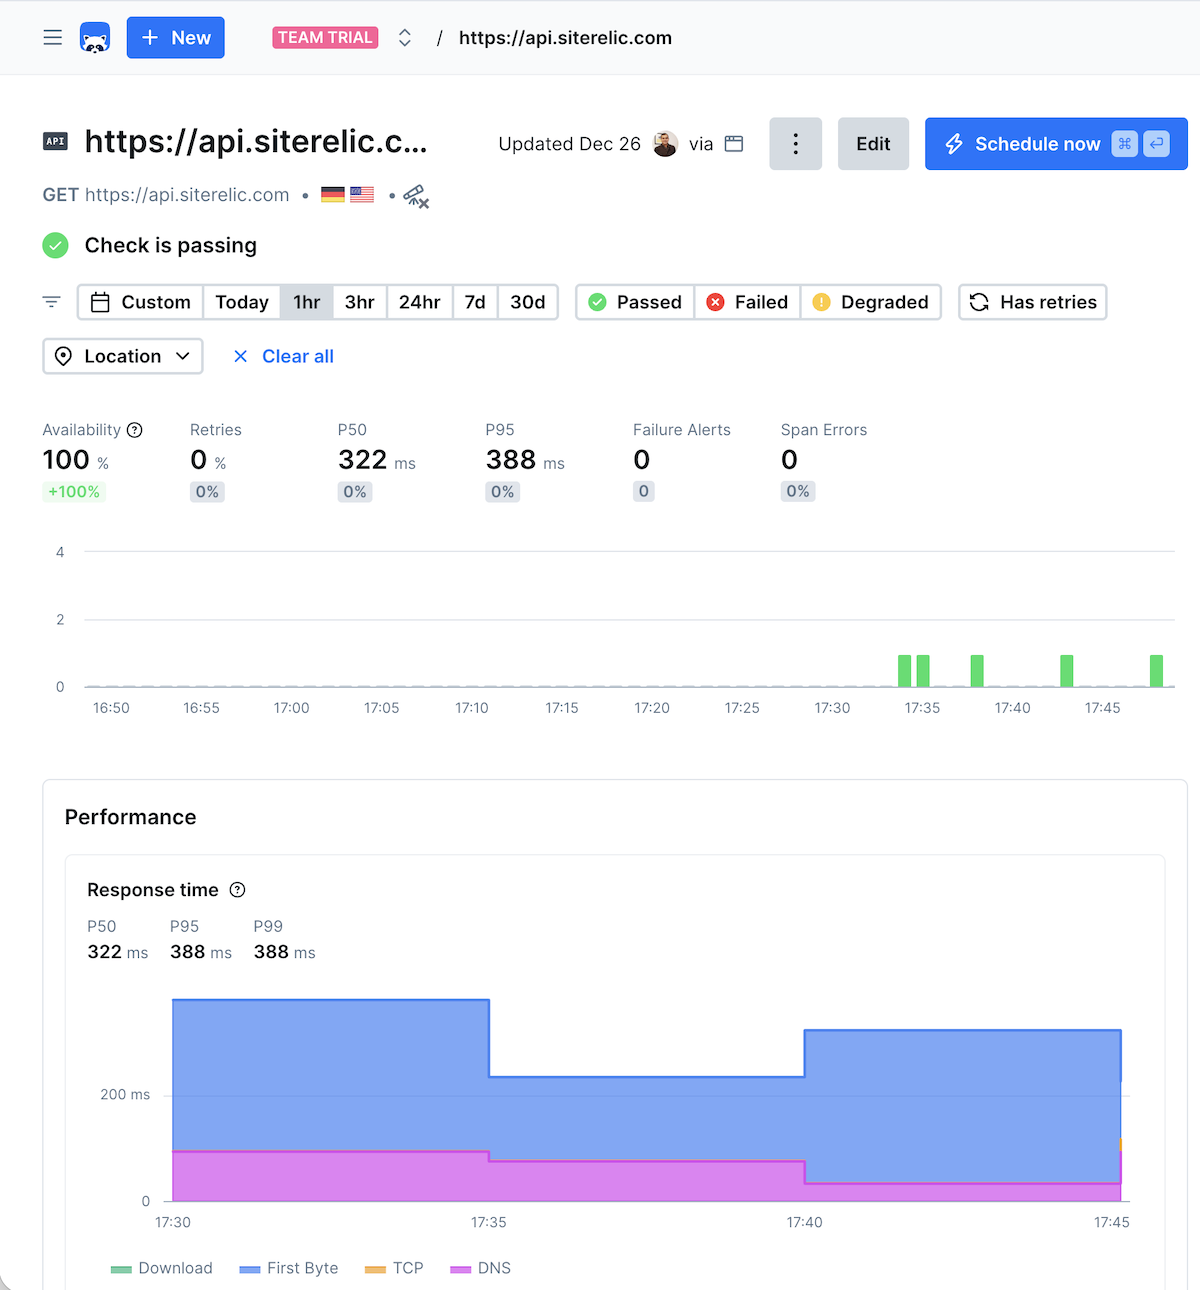
Checkly is a code-first monitoring solution for developers to validate their APIs using the same tools they use for development. By leveraging the Playwright, Checkly allows you to script end-to-end (E2E) tests in JavaScript or TypeScript.
Many organizations struggle to identify how their APIs perform under real-world scenarios. Basic ping checks often fail to catch functional errors.
Checkly solves this by allowing you to create multistep checks that mimic actual user interactions. It continuously tracks response times and uptime from over 20 global locations. Because it integrates deeply into your CI/CD pipeline, you can monitor as you code and catch issues before they reach production.
Key Features
- Customize checks in TypeScript or JavaScript to validate response codes, bodies, and headers.
- Run checks as frequently as every 10 seconds from 20+ data centers worldwide to detect outages.
- Integrates with GitHub, GitLab, Vercel, Jenkins, Incident.io, and other tools.
- Sends notifications via Slack, PagerDuty, SMS, Teams, and email when thresholds are breached.
- Import existing configurations from Swagger to speed up setup.
Pros & Cons
PROS
CONS
Checkly Pricing
Checkly offers multiple subscription plans:
Hobby – free plan cover up to 10 uptime monitoring.
Starter – starts at $24/mo, cover up to 50 uptime monitoring.
Team – $64/mo, cover up to 75 uptime monitors.
Better Stack
Best for Small to Medium Businesses
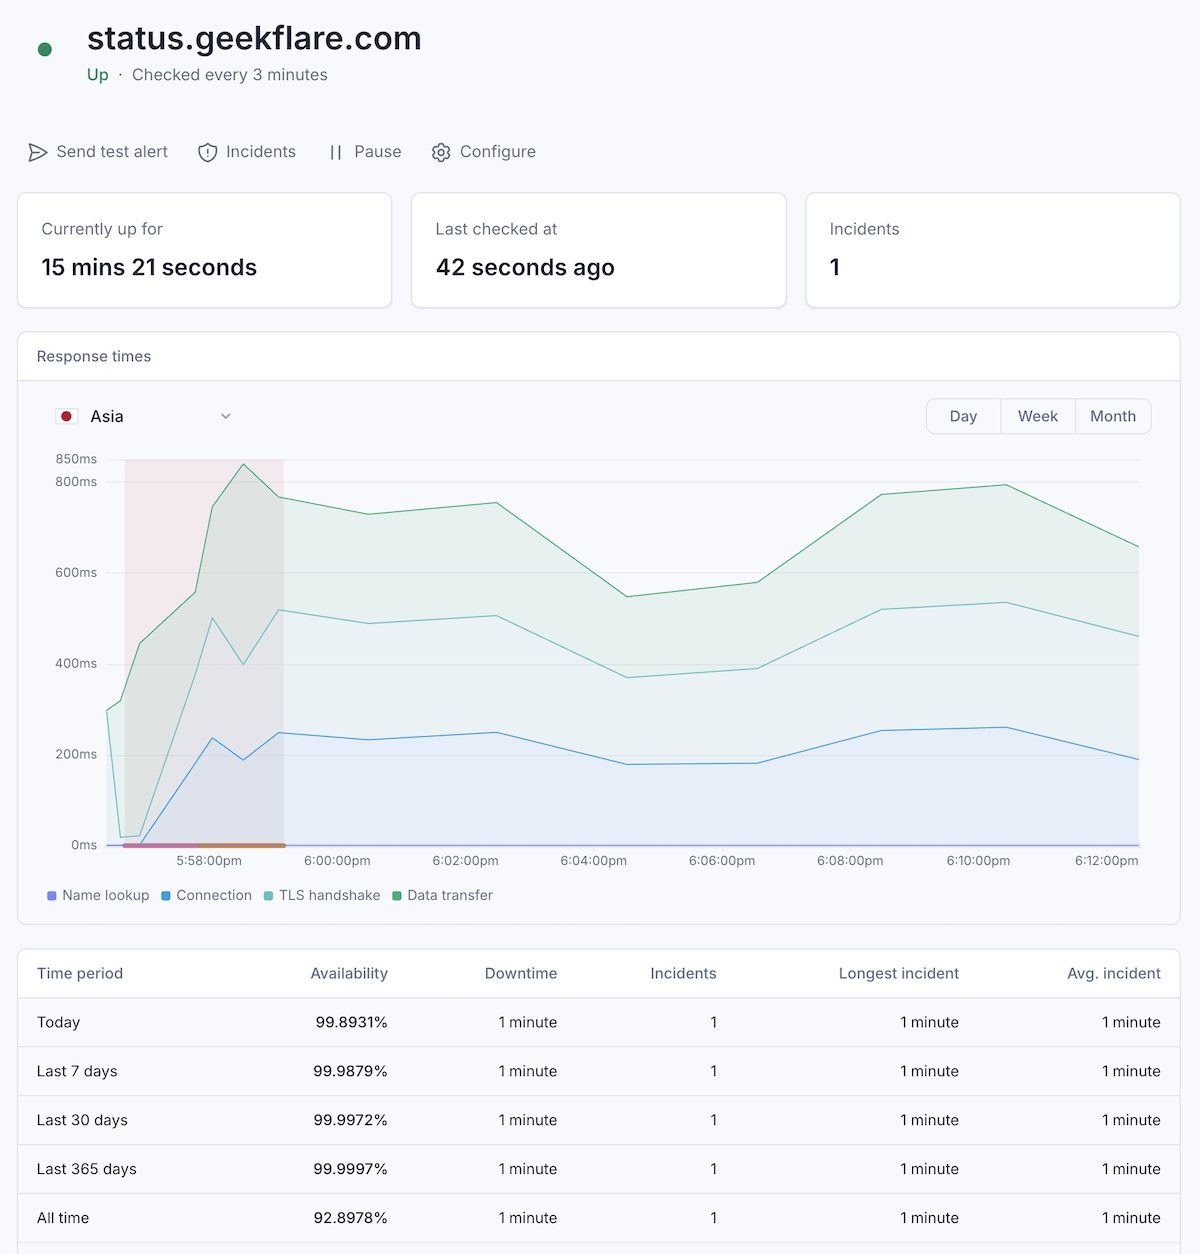
Better Stack offers more than just uptime. It has combined multiple solutions to monitor uptime and its underline infrastructure. For APIs, you need their Uptime monitoring platform.
It provides real-time insights into the performance of your web services, supporting a wide range of protocols including HTTP, Ping, POP3, IMAP, SMTP, and DNS.
Better Stack eliminate the noise often associated with monitoring. By performing checks as frequently as every 30 seconds from multiple global locations, it ensures accuracy. Before sending an alert, the system verifies the incident from at least three different locations to reduce false positives.
Key Features
- Better Stack provides screenshots of the error and detailed logs.
- It supports on-call scheduling and offers unlimited voice call alerts, along with SMS, email, Slack, Teams, and Push notifications.
- You can host customizable status pages on your own subdomain.
- Connects with observability platforms like Datadog, New Relic, and Grafana, as well as major cloud providers like AWS, Azure, and Google Cloud.
Pros & Cons
PROS
CONS
BetterStack Pricing
Free – up to 10 monitoring at 3 minutes interval and 1 status page
Paid – starts at $29/mo
Sematext
Best for API uptime and performance monitoring
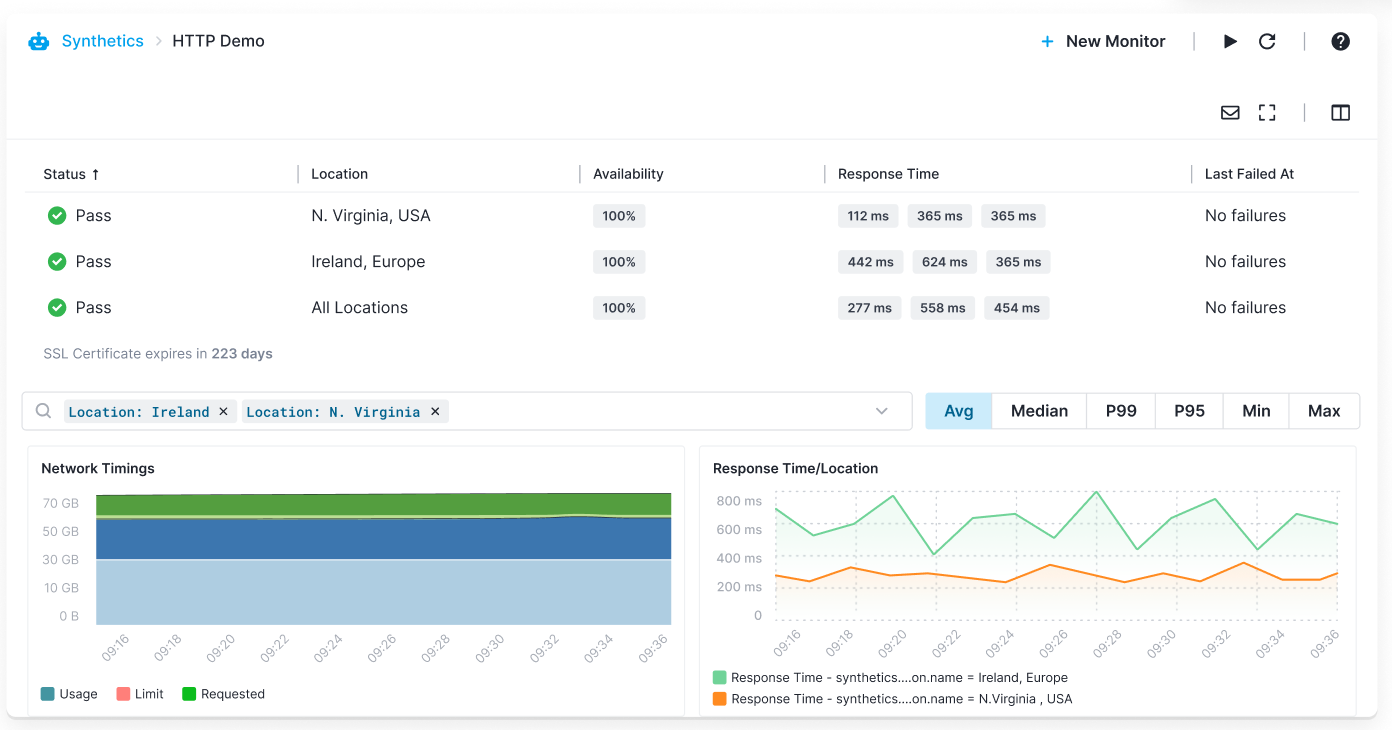
Sematext is similar to BetterStack and suitable for SMBs. It provides a holistic view of your system’s health by combining API monitoring with infrastructure metrics and log management.
Sematext make sense if you are looking to consolidate your monitoring stack into one platform or vendor. You can do these:
- Manage logs centrally.
- Monitor entire infrastructure including containers.
- Gain application visibility through distributed tracing.
- Track user experience.
- Synthetic monitoring.
- Create reporting dashboards.
- Monitor APIs and website even if they are behind firewall.
Features and cost wise, it sits between BetterStack and New Relic. One thing to note is that, Sematext also offer consulting and support for Elasticsearch, Solr, and OpenSearch.
Pros & Cons
PROS
CONS
Pay attention to monitoring interval, it is 1 minute and may not be suitable for critical application.
Sematext Pricing
API monitoring falls under Synthetic subscription, which has 3 main plans.
Pay-As-You-Go – $2/HTTP monitor
Standard – $29/mo, includes 40 HTTP monitor
Pro – $99/mo, includes 100 HTTP monitor
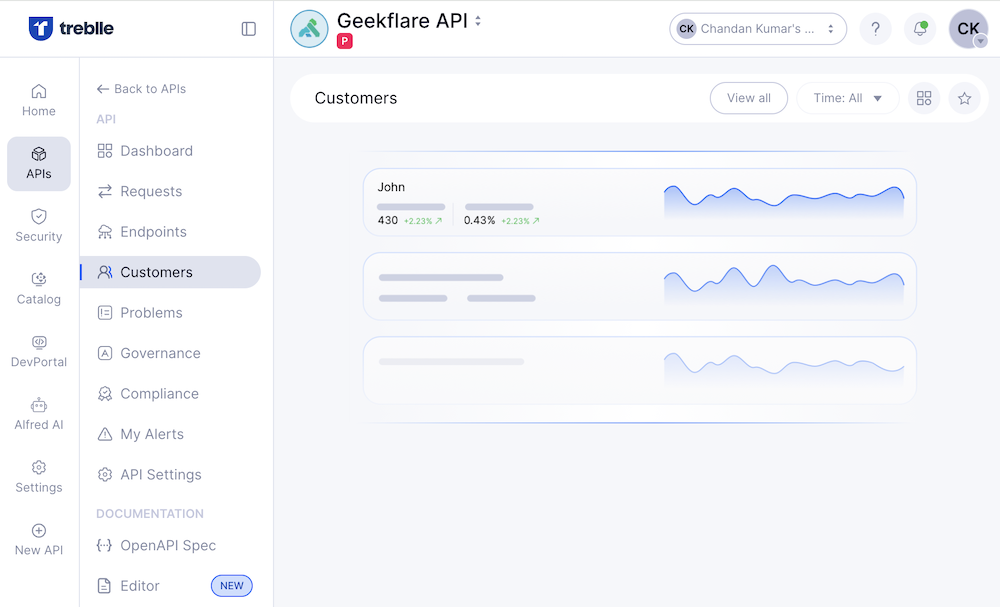
Treblle
API Observability and Analytics Tool
Treblle is an API intelligence platform, gives you deep visibility into how APIs are being used and performing. The platform has multiple products like:
- API Intelligence
- API Analytics
- API Insights
- API Testing
- API Assistant
- API Documentation
- API Governance
You don’t need to subscribe to each product, instead, choosing the relevant plan allows you to use them. For ex, if you just need API monitoring, you are good to select Starter plan, however, if you need security or governance then you need to go for Team plan.
Treblle tracks every request in real-time, allowing you to spot errors instantly, understand user behavior, and optimize performance without relying on multiple tools.
Key Features
- Automatically generates and updates your API documentation.
- Ask anything about your APIs to Alfred.
- Identify issues and apply fixes.
- Capture request and response metadata.
Pros & Cons
PROS
CONS
Integrations
You need to integrate Treblle in your API stack to take advantage of the platform. There are multiple ways:
- API Gateway – AWS API Gateway, Azure API, Kong, MuleSoft, Traefik, WSO2, Apigee
- Framework – Node.js, Fastify, Express, NestJS, SailsJS, Laravel, Spring Boot, Django, .NET, Go
Treblle Pricing
Free – monitor 1 API with 250K requests/mo
Starter – starts at $25/mo, monitor 5 APIs and 5 million request
Team – starts at $233/mo, monitor 10 APIs and 50 million requests
Considering the cost, I would suggest Treblle to critical apps in industry like financial, healthcare, and IoT.
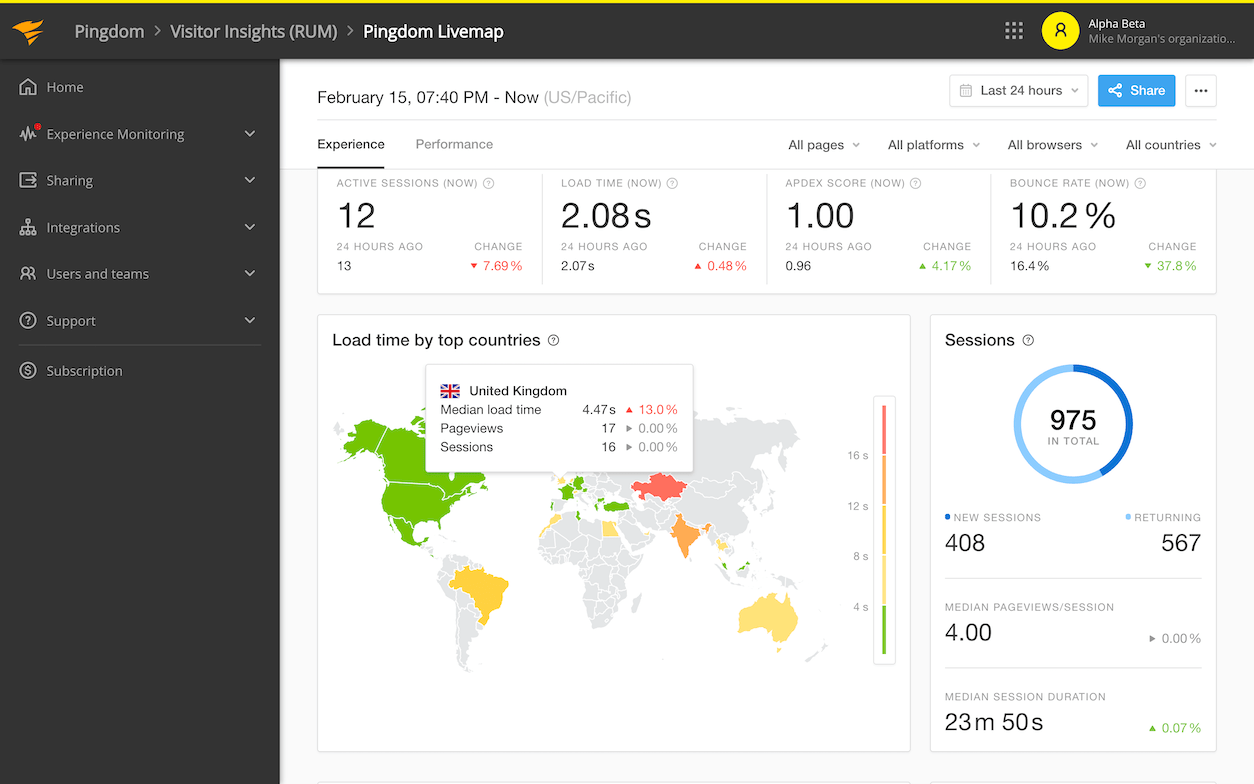
Pingdom
Old and famous website monitoring platform
SolarWinds Pingdom is a market-leading website and API monitoring solution known for its global servers. Utilizing a network of over 100 servers worldwide, it ensures your APIs uptime is monitored from everywhere your users are.
Unexpected downtime and high latency can immediately lead to lost revenue and a damaged brand reputation. For global businesses, the specific challenge is detecting outages or slowdowns in specific regions before they impact the local user base.
Pingdom addresses this by continuously monitoring service availability from multiple geographic locations. It simulates user transactions to assess the overall experience and analyzes historical data to identify long-term performance trends.
Pros & Cons
PROS
CONS
Pingdom Pricing
Synthetic monitoring pricing starts at $10/mo including 10 uptime monitoring and 50 SMS alerts.
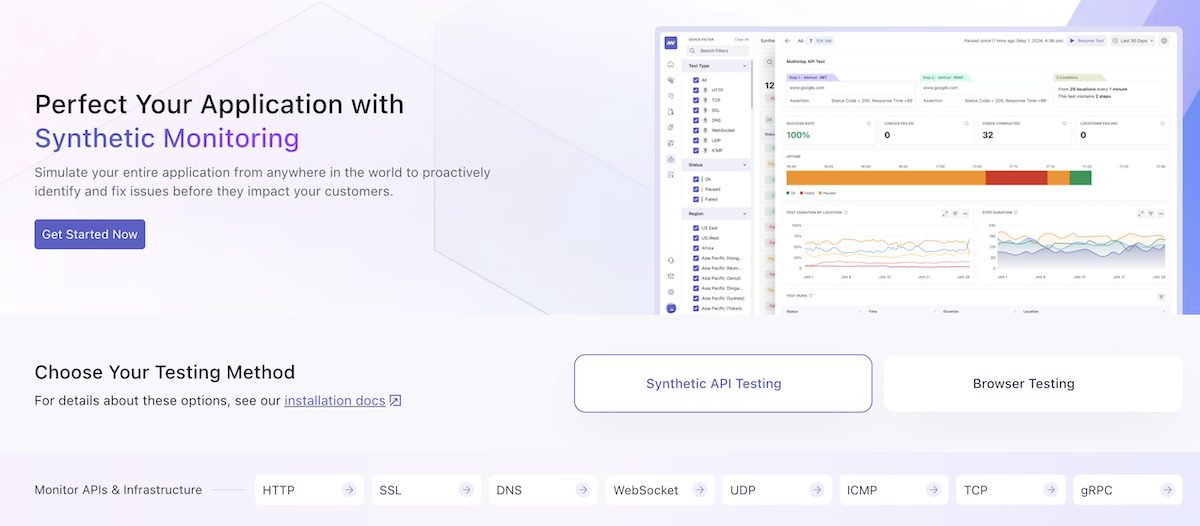
Middleware
AI-powered API observability platform
Middleware offering is similar to Sematext and Better Stack. It is all-in-one monitoring solution for APIs, websites, logs, infrastructure, applications, databases and LLMs.
To keep it relevant, I’ll talk about their API monitoring only which is part of Synthetic Monitoring.
You have an option to setup monitoring for single or multi-step API and support the following protocols.
- TCP
- ICMP
- UDP
- WebSocket
- HTTP/SSL
- gRPC
Key Features
Middleware.io is a new player in the market and offer good free plan. You don’t need to instrument your application or install any agent if you just want to monitor public API endpoints.
The first 20K checks are free, and then it cost $1 per 5K synthetic checks.
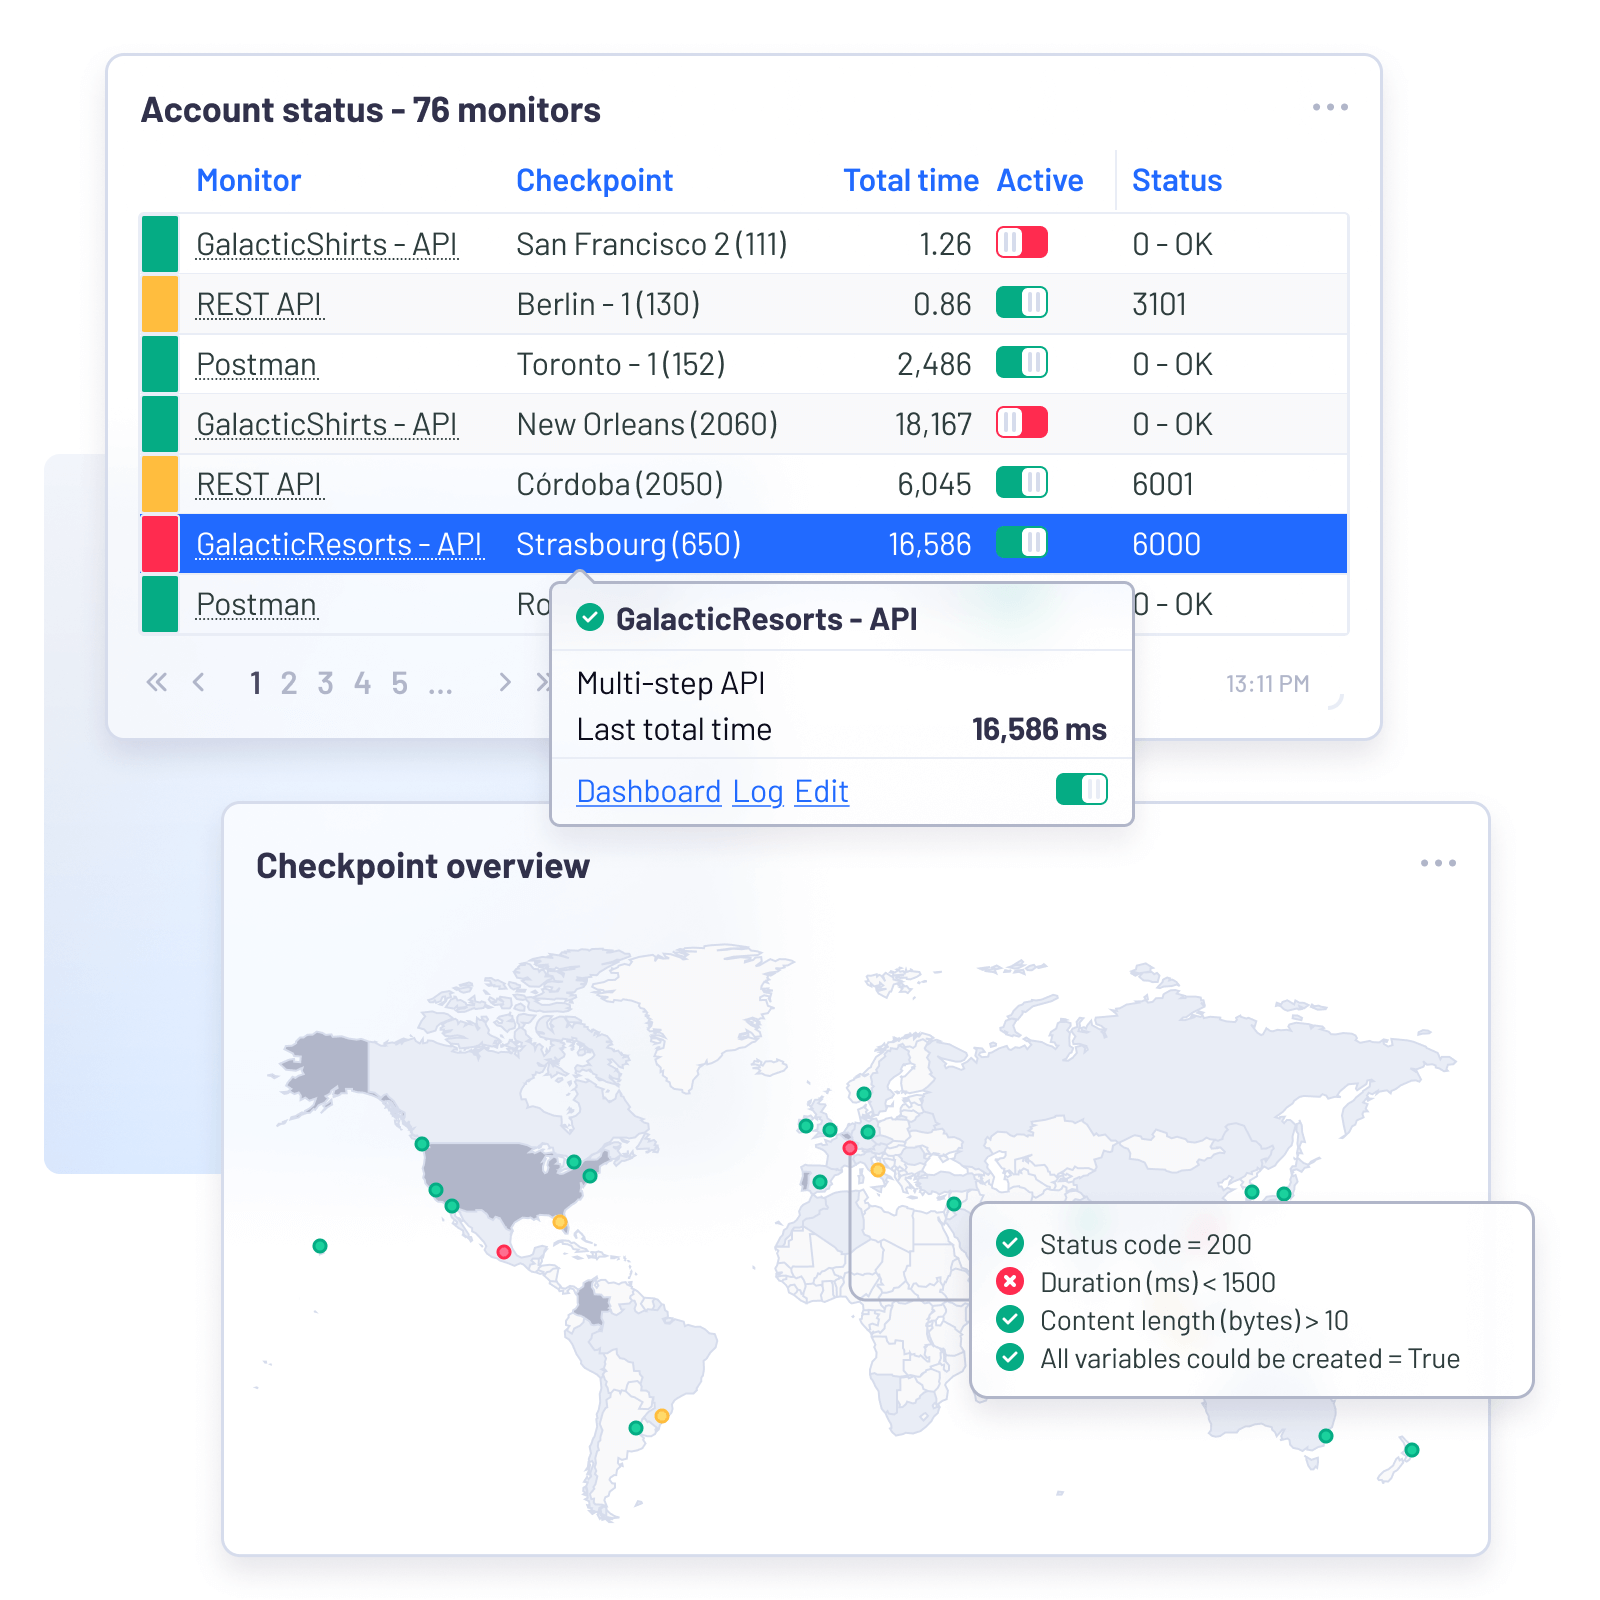
Uptrends
Monitor your APIs from 67 countries
Uptrends specializes in multi-step API monitoring, making it the go-to tool for verifying complete API interactions rather than just single endpoints. It allows you to chain multiple HTTP requests together to simulate real-world scenarios like auth and data retrieval.
Uptrends is now part of ITRS which has strong root in monitoring software industry. With Uptrends API monitoring, you can:
- Monitor API uptime from 229 cities.
- Get alerted when response time breaches threshold.
- Use OAuth token to monitor protected endpoints.
- Validate API response content to detect errors.
- Monitor internal endpoints using Private Checkpoints agent.
Pros & Cons
PROS
CONS
Verdict
If your API relies on complex logic where one request depends on the result of another, Uptrends offers the depth and control necessary to ensure every step of the process works as intended.
Dotcom-Monitor
Versatile web service monitoring
Dotcom-Monitor is a versatile monitoring tool to track the performance and uptime of a wide range of web services like REST/JSON APIs or legacy SOAP/XML architectures.
As a developer, you can import Postman collections into the platform to start monitoring APIs without having to setup them from scratch.
Key Features
- SSL certificate verification and OAuth 2.0 support to ensure secure API authentication.
- Verify specific content within XML and JSON responses to ensure data integrity.
- Monitor services from 30 global locations.
- Supports multi auth standards like API key, Basic and OAuth.
- Integrates in CI/CI pipelines for shift-left API monitoring.
- Error budget calculator based on Google SRE guides.
Dotcom-Monitor Pricing
Free – up to 25 targets, 5 minutes monitoring interval
Paid – starts at $19.99/mo, up to 100 targets
Note: premium locations and SSO integration is only available in Enterprise plan.
Other API Monitoring Tools
Moesif
SmartBear AlertSite
Datadog
New Relic
Splunk
LogicMonitor
Postman
Top API Monitoring Tools Comparison
| Software | Highlights | Global Locations | Free Plan | Pricing | Explore |
|---|---|---|---|---|---|
|
Moesif
|
API Monetization, User Analytics
|
Unknown
|
|
Starts at $132/mo
|
|
|
Datadog
|
Enterprise Observability
|
20+
|
|
Pay-As-You-Go
|
|
|
SmartBear AlertSite
|
Functional Testing
|
Unknown
|
|
Pay-As-You-Go
|
|
|
Middleware
|
AI-Powered Monitoring
|
Unknown
|
|
$/5K Checks
|
|
|
Sematext
|
Unified Monitoring, Logs & Metrics
|
15+
|
|
Pay-As-You-Go
|
|
|
Checkly
|
Code-First Monitoring, E2E Testing
|
20+
|
|
Starts at $24/mo
|
|
|
Uptrends
|
Multi-step Transactions, Global Checks
|
229
|
|
Pay-As-You-Go
|
|
|
Treblle
|
API Observability & Security
|
Unknown
|
|
Starts at $25/mo
|
|
|
Dot-Com Monitor
|
Postman Integration
|
30
|
|
Starts at $19.99/mo
|
|
|
Better Stack
|
Incident Management, Status Pages
|
30+
|
|
Starts at $29/mo
|
|
|
New Relic
|
Full-Stack APM
|
20+
|
|
Custom Pricing
|
|
|
Pingdom
|
Global Uptime
|
100+
|
|
Starts at $10/mo
|
FAQs
Yes, you are in luck! There are good open-source alternatives if you prefer to self-host.
Uptime Kuma – popular self-hosted monitoring tool with a modern UI.
Prometheus & Grafana: the industry standard for metrics. While it requires more setup, you can configure Prometheus to scrape API endpoints and visualize the data in Grafana.
Statping: open-source status page and monitoring tool.
Synthetic Monitoring simulates user interactions by sending automated requests to your API from global servers at set intervals. It tells you if your API is available and how fast it responds, even when no real users are on the site.
Real User Monitoring/Observability like Treblle, Moesif tracks actual traffic from real users interacting with your API. It tells you how users are using the API and captures errors that specific users are experiencing in real-time.
For production APIs, a check interval of 30 seconds to 1 minute is good. For non-critical services, a 5 to 10-minute interval is usually sufficient.
Yes, most tools like Sematext, SmartBear, Uptrends, and Dotcom-Monitor offer Private Locations or Agents.
You should focus on these three key metrics:
Uptime – the percentage of time the API is accessible.
Response Time – how long it takes for the API to process a request and send a response.
Error Rate – the percentage of requests that result in status codes like 4xx or 5xx.