AWS dominates the cloud market to deploy scalable infrastructure. Yet, with this scale comes complexity. To maintain uptime and efficiency, companies require total visibility into every layer of their stack.
For many, Amazon CloudWatch is the default choice for basic insights. But as applications grow, relying solely on native tools can lead to higher costs. To overcome these limitations, you can adopt dedicated AWS monitoring tools. These external solutions are cheaper and provides advanced features to proactively monitor and optimize AWS infrastructure.
Why Trust Our Guide
AWS Monitoring Tools At Glance
| Product | Best Use Case | Deployment | Free Plan | Pricing Model |
|---|---|---|---|---|
| AWS CloudWatch | Native AWS Basics | Cloud | Yes | Pay-as-you-go |
| Datadog | Full-Stack Observability | Cloud | Yes | Per Host |
| New Relic | App Performance (APM) | Cloud | Yes | Per GB Ingested |
| Dynatrace | Enterprise Automation | Cloud | No | Full-Stack Licensing |
| SolarWinds | Hybrid Infrastructure | Hybrid | No | Per Node |
| Paessler PRTG | Network Monitoring | Hybrid | Yes | Per License (Sensor) |
| Site24x7 | SMB | Cloud | Yes | All-in-one Sub |
| CloudZero | AWS Cost Optimization | Cloud | No | Custom |
| Zabbix | Open Source | Hybrid | Yes | Free (Self-Hosted) |
| Netdata | Real-time Diagnostics | Agent/Cloud | Yes | Per Node |
| Prometheus | DIY | Hybrid | Yes | Free (Self-Hosted) |
Best AWS Monitoring Tools Review
Below, I review each monitoring tool in detail to give you an idea how it can help you to monitor your AWS infrastructure and hosted applications.
Amazon CloudWatch
Zero-setup monitoring and basic metric collection.
As the built-in observability service for AWS, Amazon CloudWatch is the logical starting point for most organizations. It provides a unified view of operational health by collecting data across your AWS resources.
Because it is native to the platform, there are no agents to install for basic metrics, it starts collecting data the moment you launch an EC2 instance or RDS database.
While CloudWatch handles performance, it works alongside these native tools for security and compliance:
- AWS CloudTrail to tracks user activity and API usage for auditing.
- AWS Security Hub is a centralized dashboard for security alerts.
- Amazon Inspector automates vulnerability assessments.
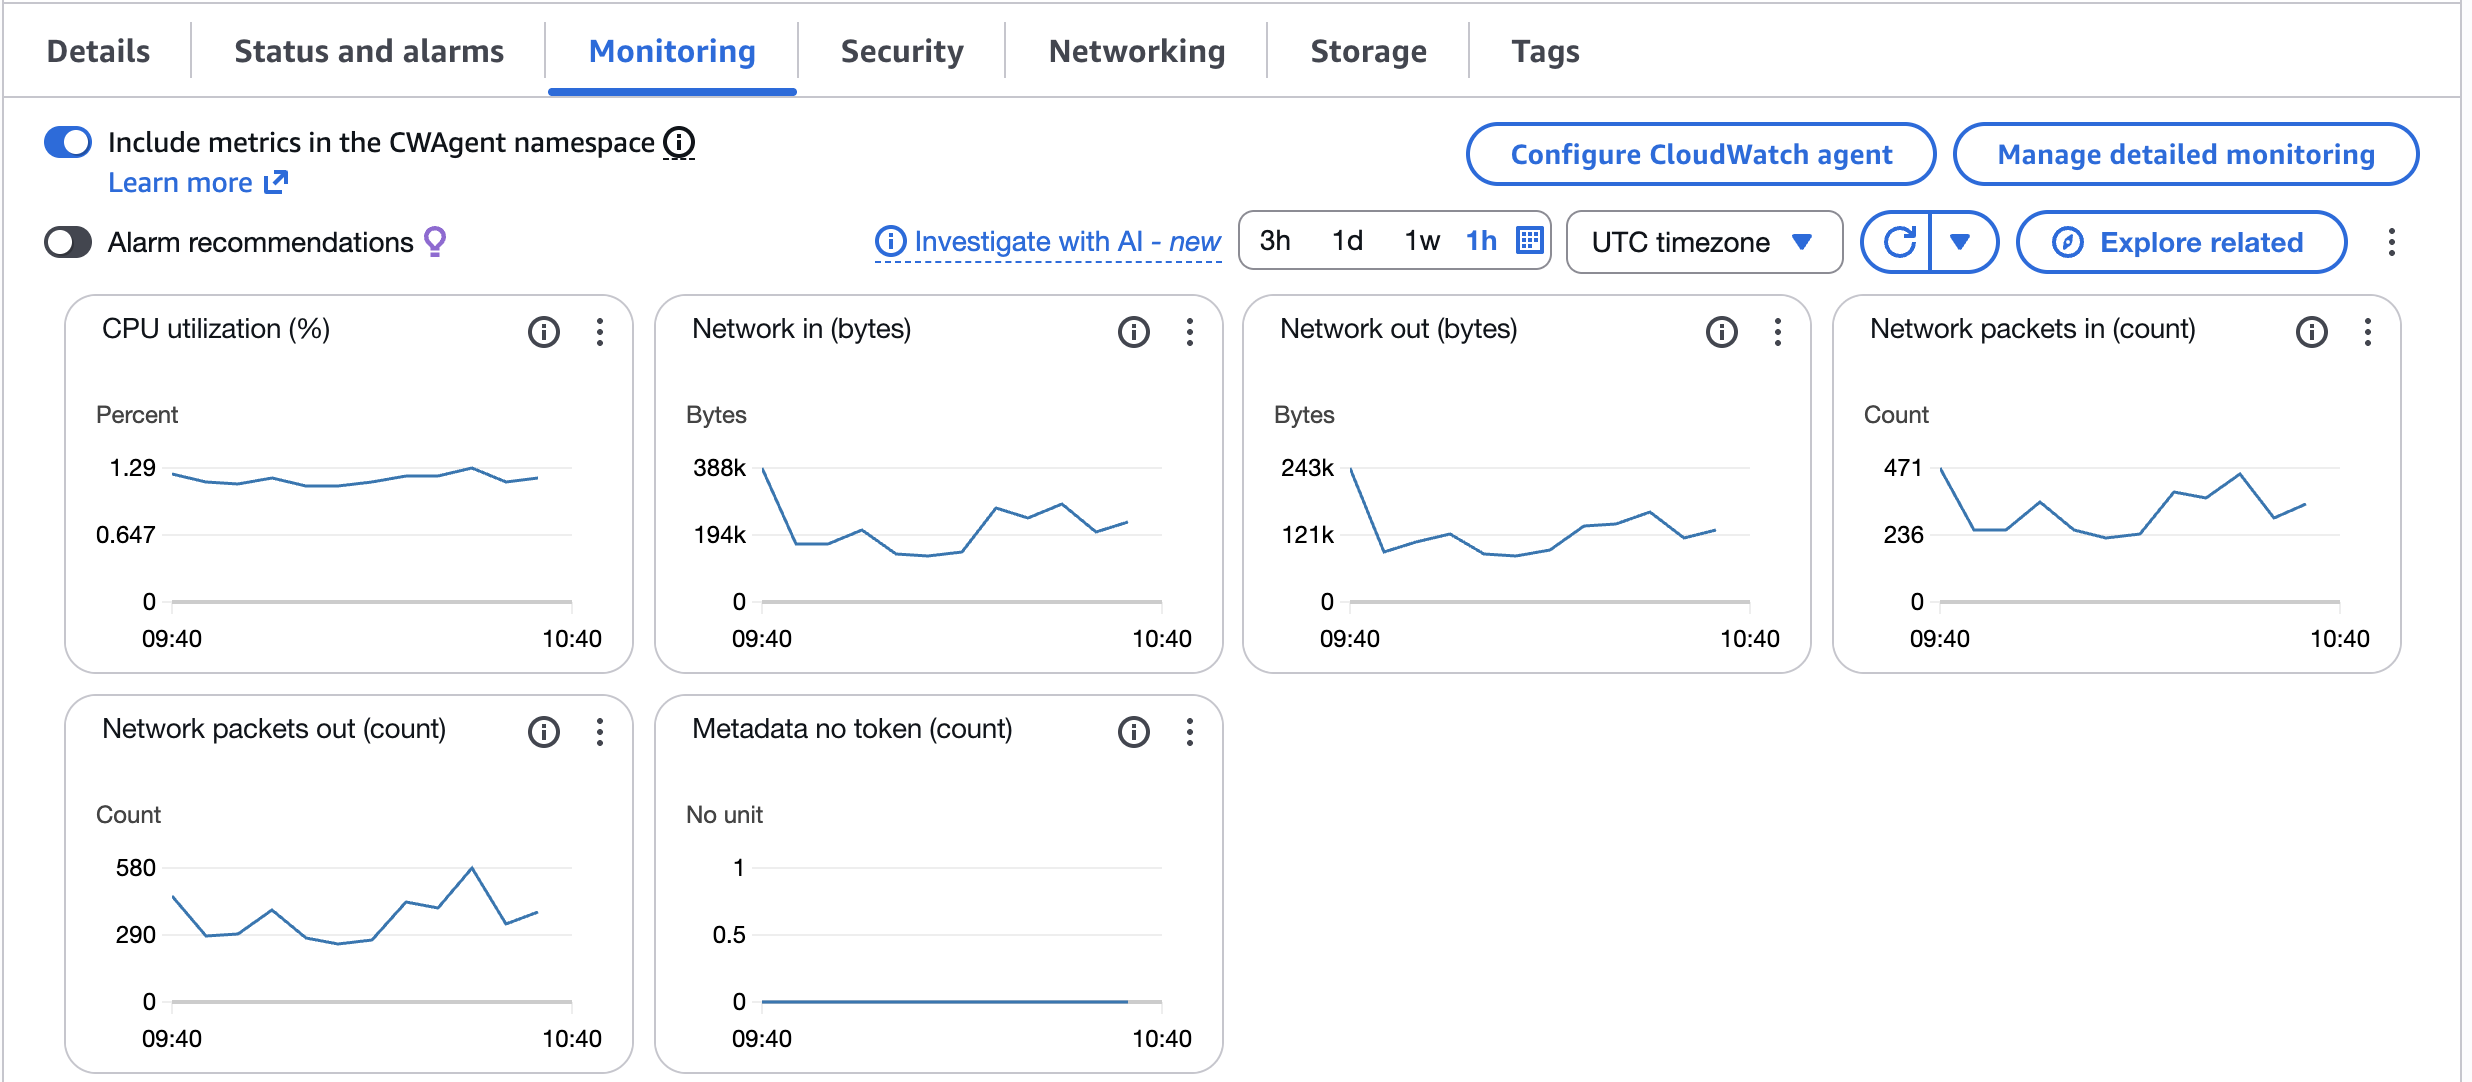
Key Features
- Collects metrics and logs from almost every AWS services automatically.
- Sets alarms that can trigger automated responses when thresholds are breached.
- Insights features allow you to query and analyze log data to identify root causes of operational issues.
- Monitors applications running on AWS and on-premises using the CloudWatch Agent.
CloudWatch Limitations
While excellent for getting started, CloudWatch has known drawbacks as you scale:
- Custom metrics and detailed log retention can become surprisingly expensive compared to third-party tools.
- It lacks the single pane of glass experience for multi-cloud environments.
- It lacks the advanced APM and predictive analytics found in tools like Datadog or Dynatrace.
CloudWatch Pricing
CloudWatch operates on a Pay-As-You-Go model with no upfront commitments.
Free Tier includes basic monitoring – 5-minute frequency, 10 alarms, and 5 GB of log ingestion.
Paid Tier charges based on the number of metrics, API requests, and GBs of logs ingested.
Verdict
Use Amazon CloudWatch to establish a baseline. It is essential for infrastructure health, but for deep application tracing or cost control, you may need to pair it with one of the tools below.
Datadog
Best for DevOps teams needing deep visibility across multi-cloud environments.
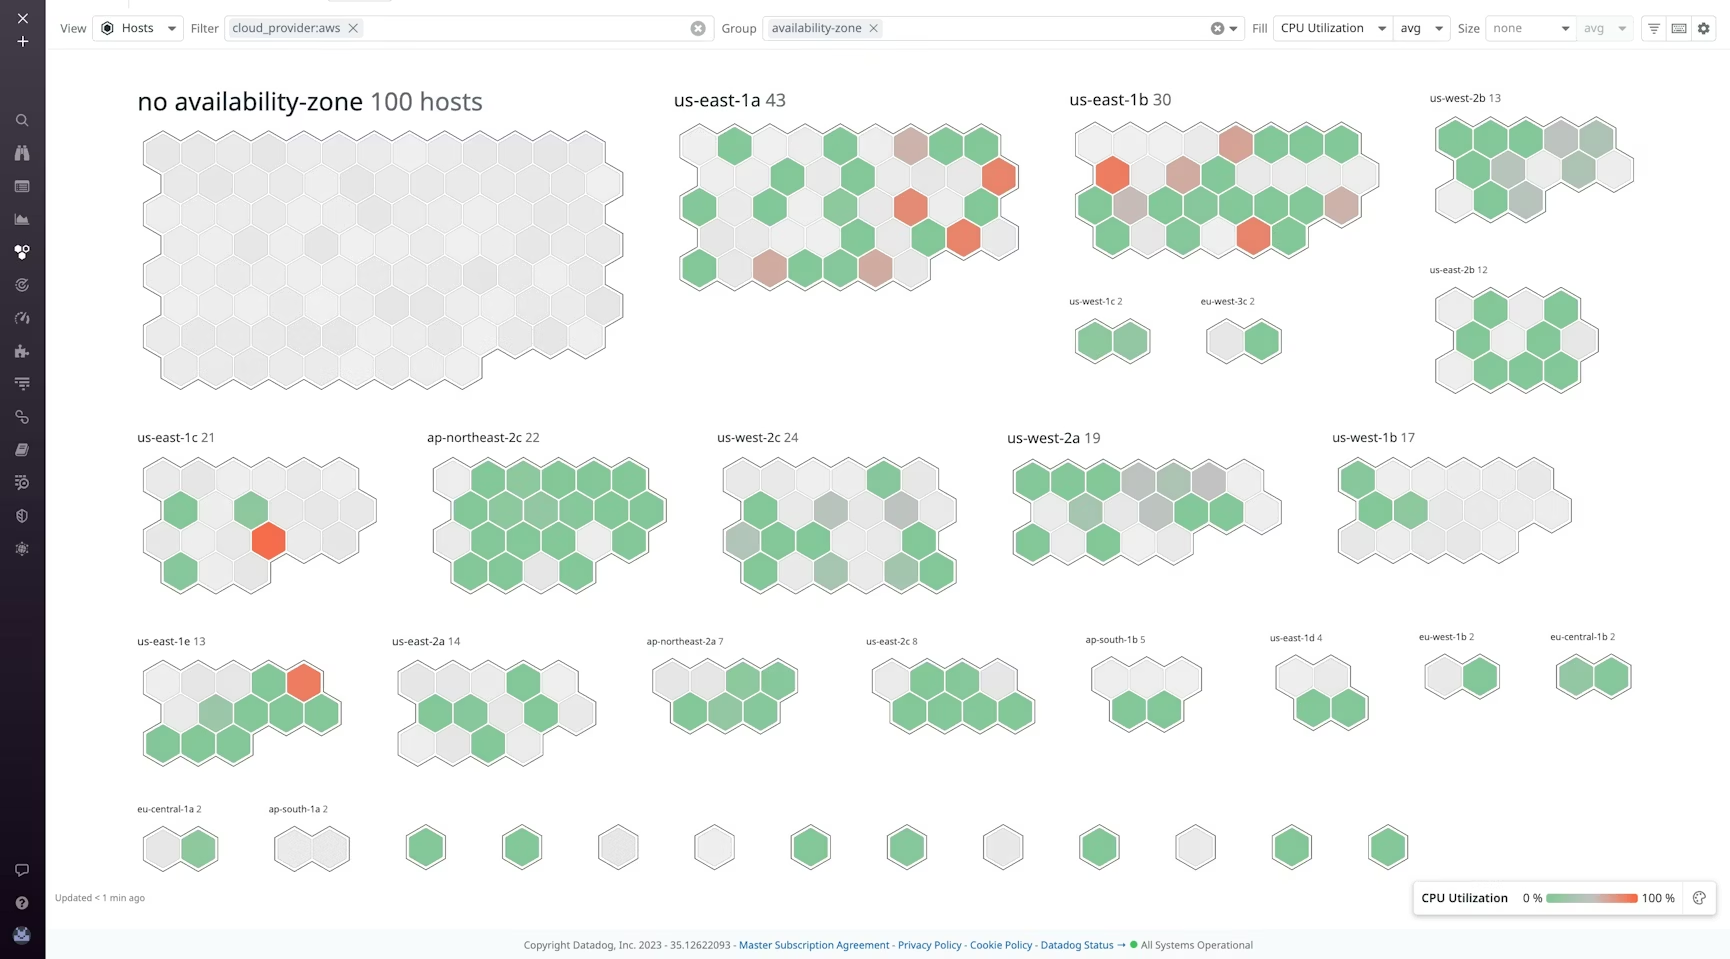
Datadog is the upgrade for business critical applications. It simplifies AWS monitoring by unifying data from servers, databases, tools, and services into a centralized platform.
With 800+ built-in integrations, it connects your AWS infrastructure with the rest of your stack like Kubernetes, Jenkins, LangChain. Its drag-and-drop dashboards allow you to visualize performance across the entire stack without the fragmentation often found in native tools.
Key Features
Key Features
- The Watchdog feature uses machine learning to automatically detect performance abnormalities.
- Tracks requests from the frontend to the backend database to pinpoint error.
- Provides side-by-side performance tracking, which is critical when migrating legacy apps to the AWS cloud.
- Combines observability with security, offering out-of-the-box threat detection rules for your cloud environment.
Datadog Limitations
- Datadog is powerful, but it can get expensive. Pricing is granular like per host, per log GB, per synthetic test, and costs can shoot up quickly if you don’t aggressively manage data ingestion.
- For simple applications or small infrastructure, the depth of features Datadog offers may be unnecessary.
Datadog Pricing
Datadog operates on a tiered subscription model.
Free Plan: Available for up to 5 hosts, with 1-day metric retention.
Free Trial: Offers a 14-day trial.
Paid Plans: Infra monitoring starts at $15/host/month.
Verdict
Choose Datadog if you are running microservices or containers on AWS and need a unified platform that correlates logs, metrics, and traces automatically.
New Relic
Best for SMB needing application performance monitoring.
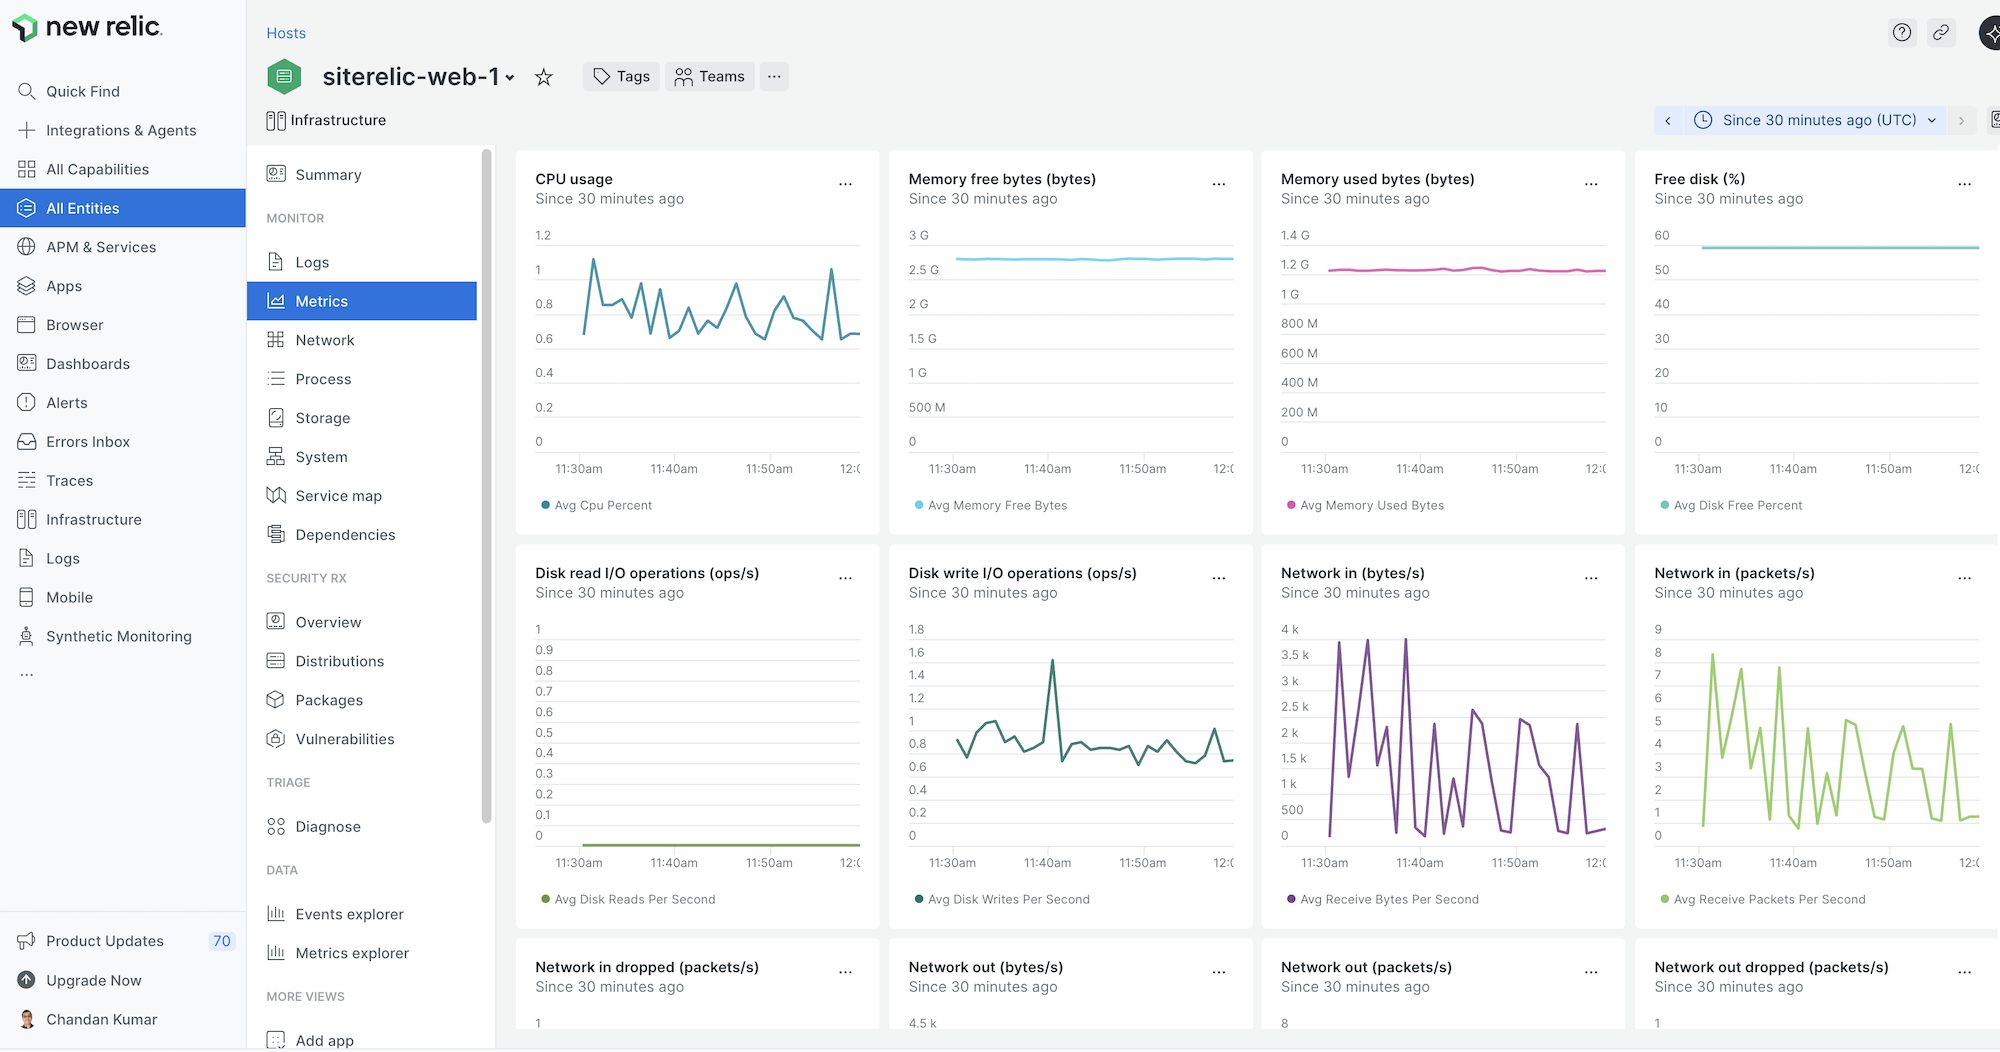
New Relic takes a data-centric approach to monitoring. While Datadog focuses heavily on infrastructure, New Relic excels at Application Performance Monitoring (APM).
I particularly like its usage-based pricing model. New Relic charges based on data ingestion. This makes it an attractive option for a growing AWS environment where the number of servers scales up and down frequently.
We use New Relic to monitor AWS and GCP servers. I like how it autodetects the running applications like docker, WordPress, PHP, Node.js and give application-level metrics.
Chandan Kumar, Founder of Geekflare.
Key Features
- Uses AWS CloudFormation templates to integrate with your AWS account in minutes.
- Automatically visualizes the relationships and dependencies between your applications and servers.
- Provides immediate visibility into EC2 and other AWS resources performance.
- Automatically correlates infrastructure health with application performance.
New Relic Limitations
- Pricing is based on GBs ingested, costs can skyrocket if you are logging everything without filtering.
- To get the most out of the platform, you need to learn NRQL.
New Relic Pricing
New Relic offers one of the most genuine free tiers.
Free: Includes 100 GB of data ingest per month for free.
Paid: Pricing starts at $0.40/GB for data beyond the free limit.
Verdict
Use New Relic if your primary focus is application monitoring and need a pricing model that scales with your data rather than servers count.
Dynatrace
Best for enterprise AI automation
Dynatrace is an AWS Service Ready Partner. That credibility says a lot. I would recommend Dynatrace to only large businesses and global enterprises.
I particularly like its Davis AI. Instead of just alerting you that CPU usage is high, Dynatrace analyzes dependencies to tell you why it is high and exactly which line of code or database query caused the bottleneck. It fits perfectly into high-scale AWS environments.
Key Features
- Delivers automatic baselining and root-cause analysis.
- Automatically discovers and maps your entire stack in real-time.
- Combines observability with runtime application security to detect vulnerabilities.
- OneAgent allows for auto-instrumentation.
Dynatrace Limitations
- Because it offers such deep data, the interface can be overwhelming for smaller teams.
- Dynatrace is an enterprise-grade solution. For startups or simple infra where basic metrics suffice, the cost and complexity may be overkill.
Dynatrace Pricing
Dynatrace offers a flexible pricing model based on the specific capabilities you need.
Foundation – starts at $7/mo/host.
Infra monitoring – starts at $29/mo/host.
Verdict
Use Dynatrace if you are a large enterprise with a hybrid environment and want to use AI to automate the troubleshooting process, reducing the Mean Time to Repair (MTTR).
SolarWinds
Best for hybrid infrastructure with SolarWinds ecosystem
SolarWinds Server & Application Monitor (SAM) is self-hosted solution for SMEs. It make sense to use SolarWinds when you have on-premises servers to monitor and some footprint on cloud.
I like its focus on asset management. The auto discovery feature is excellent, it automatically scans your AWS account to find and map EC2 instances.
Key Features
Key Features
- View the health of your physical servers, VMs, and AWS EC2 instances on a single dashboard.
- Comes with 1,200+ monitoring templates for common applications (like Active Directory, Exchange, IIS, and SQL Server) running on AWS.
- Identifies zombie instances and unattached EBS volumes to help you reduce wasted cloud spend.
SolarWinds Limitations
- The UI can feel traditional compared to the modern ones like Datadog or New Relic.
- While excellent for infrastructure (EC2/EBS), its integration with newer serverless AWS services like Lambda or Fargate is not as deep as cloud-native competitors.
SolarWinds Pricing
SAM on-premises subscription starts at $2900.
Verdict
Choose SolarWinds SAM if you are a Hybrid IT organization. If you need to monitor a SQL Server in your datacenter and an EC2 instance on the same dashboard.
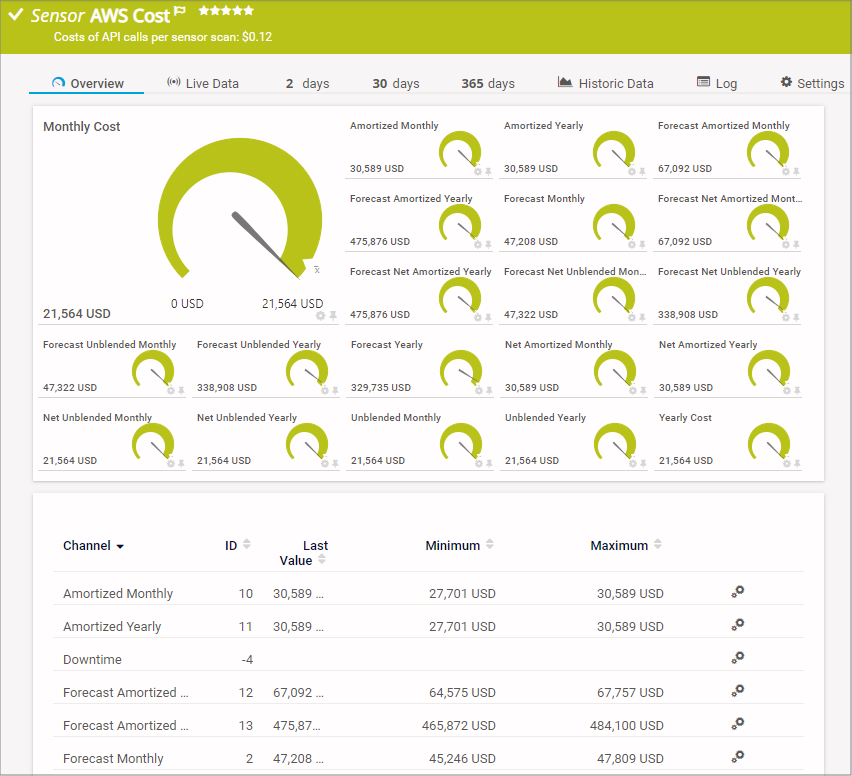
Paessler PRTG
Best for network and Windows environment
Paessler PRTG is a favorite among IT administrators for its sensor-based approach monitoring. Its true strength lies in unifying your AWS cloud with your on-premise network and Windows servers.
PRTG uses pre-configured sensors to track AWS metrics like EBS volume status or EC2 CPU usage. This makes it easy to set up custom dashboards that show the health of your local network alongside your cloud.
Key Features
- Allows you to build drag-and-drop dashboards that visualize your network topology and cloud connections in real-time.
- Excellent for tracking data transfer costs, helping you see if your AWS egress traffic is spiking.
- Generates PDF reports on uptime and performance.
Paessler PRTG Limitations
- The core PRTG server software must run on a Windows machine.
- Higher upfront committment, pricing starts above $1500/year which is not suitable for micro startups.
PRTG Pricing
PRTG offers 30-days free trial and pricing starts at $179/month.
Verdict
Use Paessler PRTG if your applications are mostly Windows-based and spread across on-premises and cloud.
Site24x7
Best for SMBs and MSPs
ManageEngine Site24x7 offers one of the cheapest monitoring subscription plan. It integrates with CloudSpend to guide you on cloud spending and optimization recommendation.
It covers website uptime, server monitoring, and application performance (APM) in a single ALL-IN-ONE subscription. And, a dedicated pricing for MSPs starting at $54/mo to manage 9 customers and 5 servers.
Its Guidance Report analyzes your AWS usage and provides actionable recommendations to reduce costs and improve security. For teams that want one tool to do it all without the enterprise price tag of Datadog or Dynatrace, this is a very good choice.

Key Features
- Allows you to automate repetitive tasks like restarting an EC2 instance or clearing logs automatically when a specific alert is triggered.
- Uses machine learning to learn your system’s normal behavior and only alerts you when metrics deviate significantly.
- Tracks your AWS spending trends and provides forecasts.
Site24x7 Cons
- UI can feel a bit cluttered compared to the modern observability platform like New Relic.
- Pricing is based on per host which can be expensive if you have fleet of micro VMs.
Site24x7 Pricing
Free – monitor uptime of up to 50 resources.
Paid – Lite plan starts at $9/mo which includes 2 servers.
Verdict
Choose Site24x7 if you are an SMB or MSP. Another reason is if you are already using ManageEngine and Zoho apps so billing is consolidated.
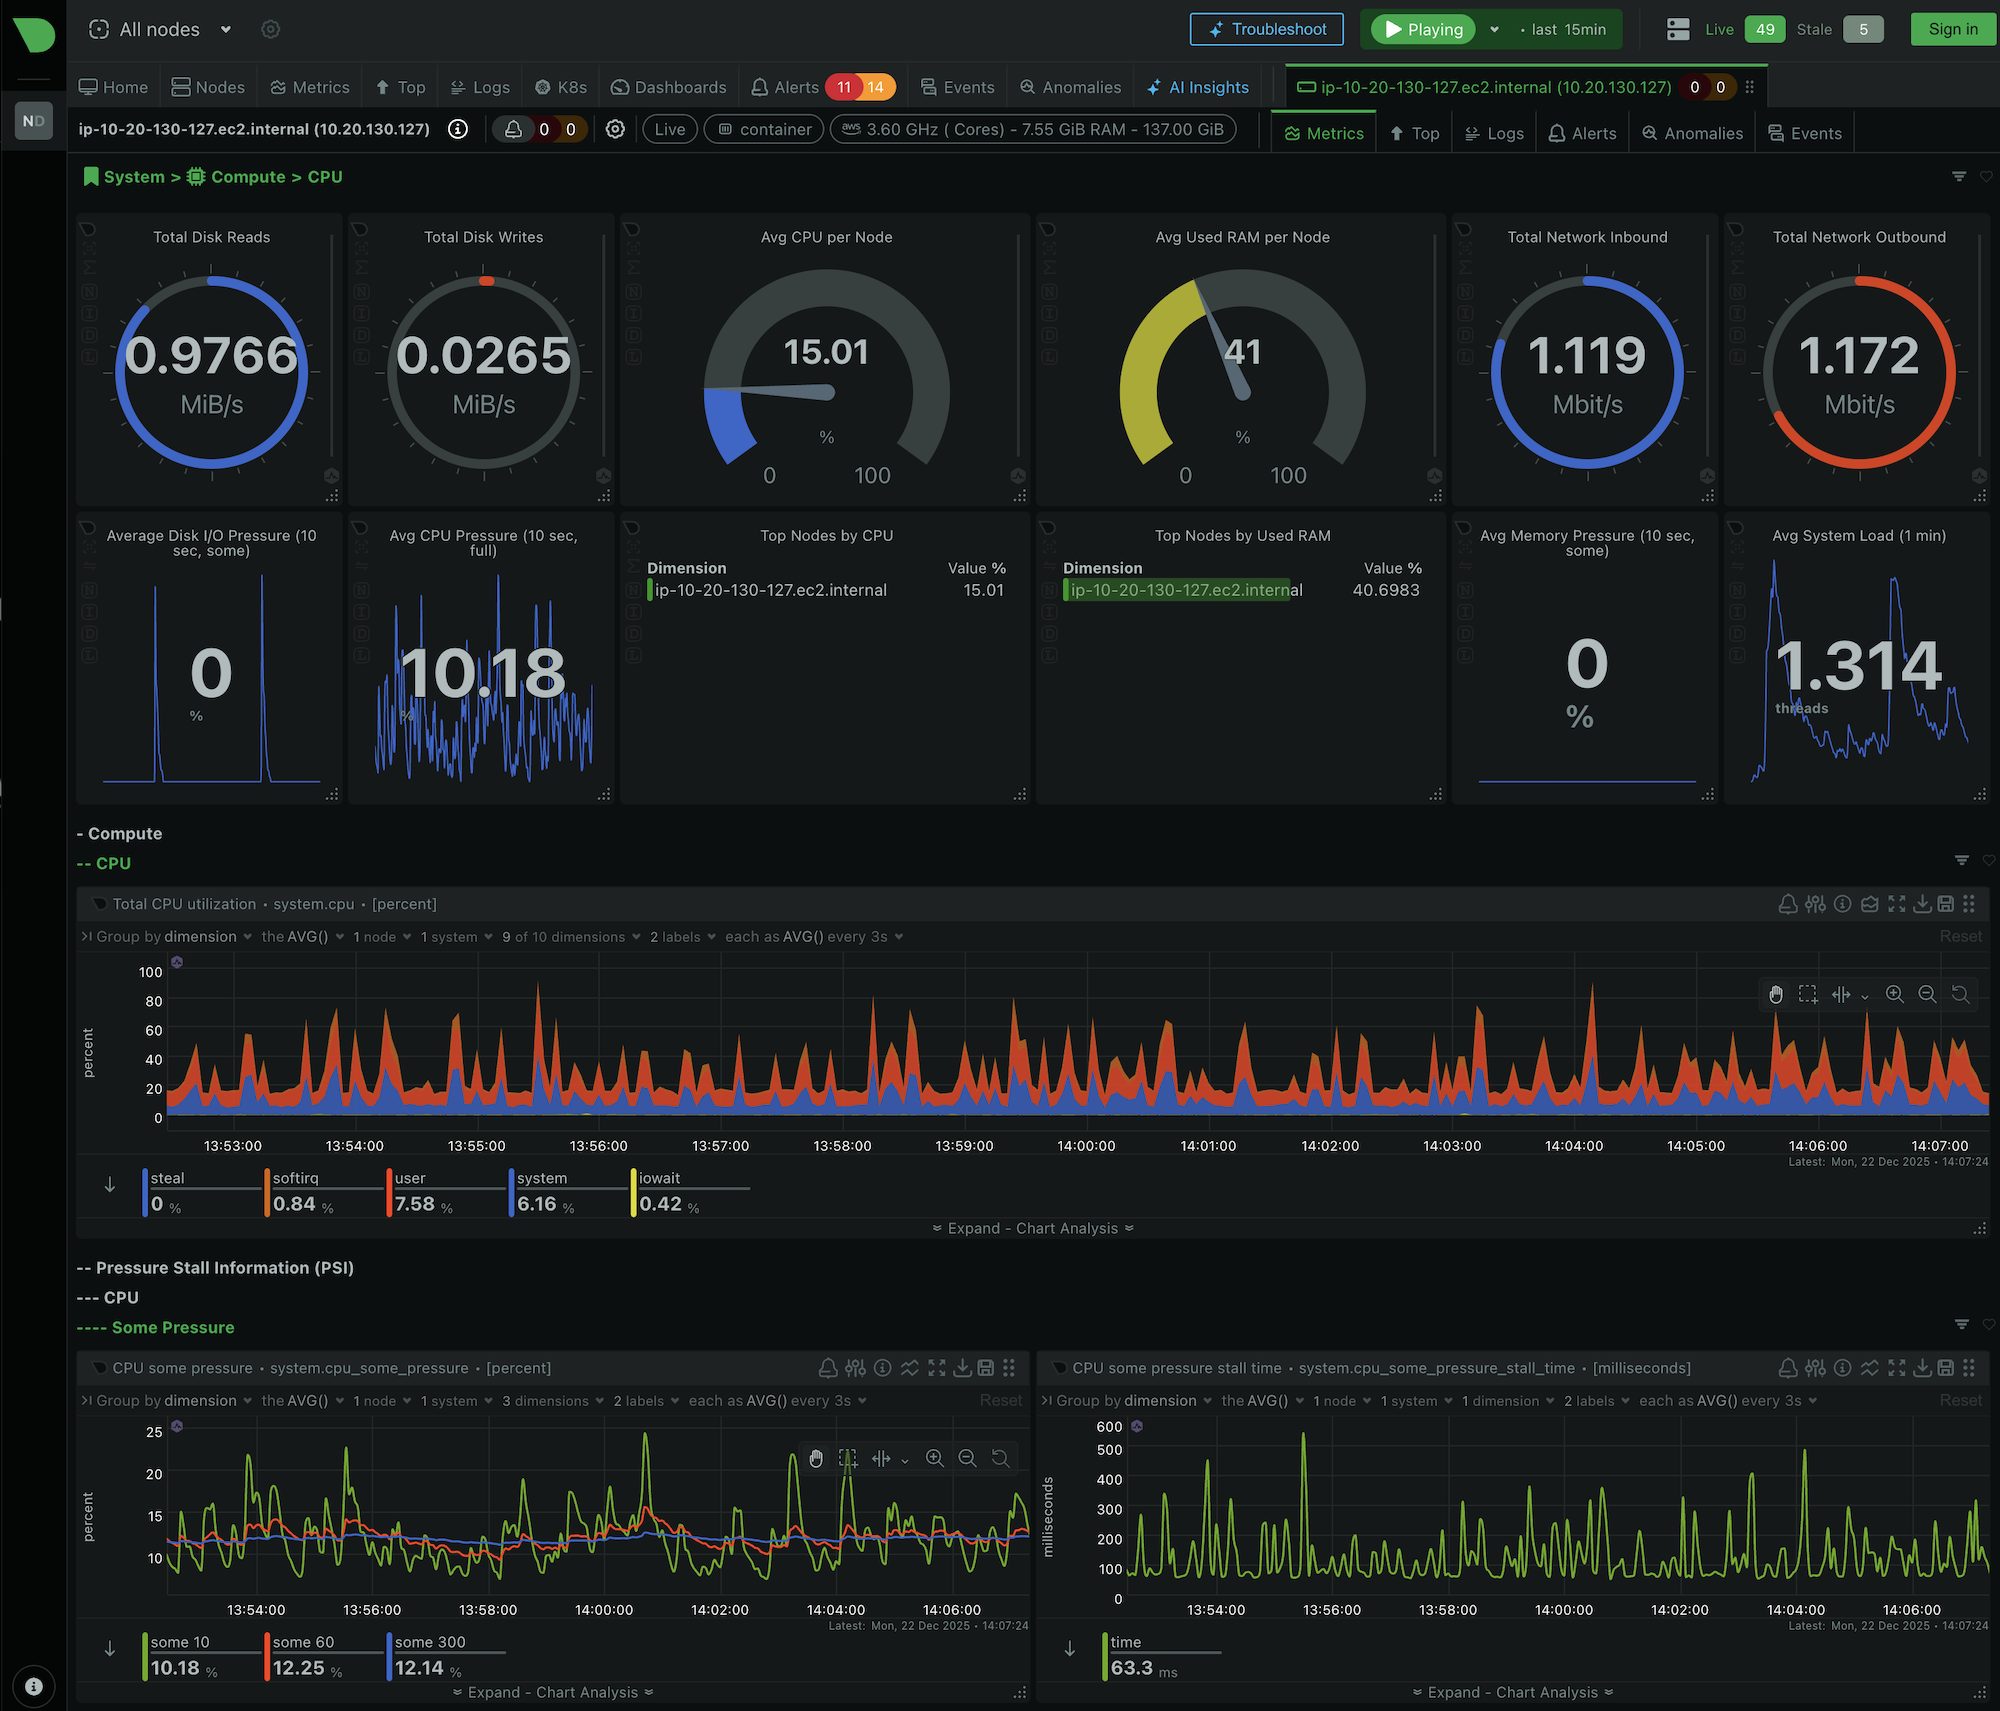
Netdata
Best for open-source infra monitoring
Netdata is open-source monitoring solution and also offer managed subscription starting at $4.50/mo.
While most tools like CloudWatch provide metrics with a 1-minute or 5-minute delay, Netdata provides per-second granularity.
I love its Zero-Configuration approach. You install the lightweight agent on your AWS EC2 instance and it immediately detects hundreds of metrics.
Key Features
- Collects data every second.
- Lightweight agent, consuming roughly 1% of a single CPU core.
- Automatically detects running services like Nginx, Docker, MySQL, or MongoDB and starts collecting the metrics immediately.
- It is a highly rated project on the Cloud Native Computing Foundation (CNCF) landscape.
Netdata Limitations
- It is a performance monitoring tool. It does not have the deep cloud cost management or multi-cloud billing analysis found in tools like Datadog or CloudZero.
Netdata Pricing
Netdata is extremely generous with its free offerings.
Open Source: Connect unlimited nodes with some feature restrictions.
Business: Starts at $4.50 per node/month.
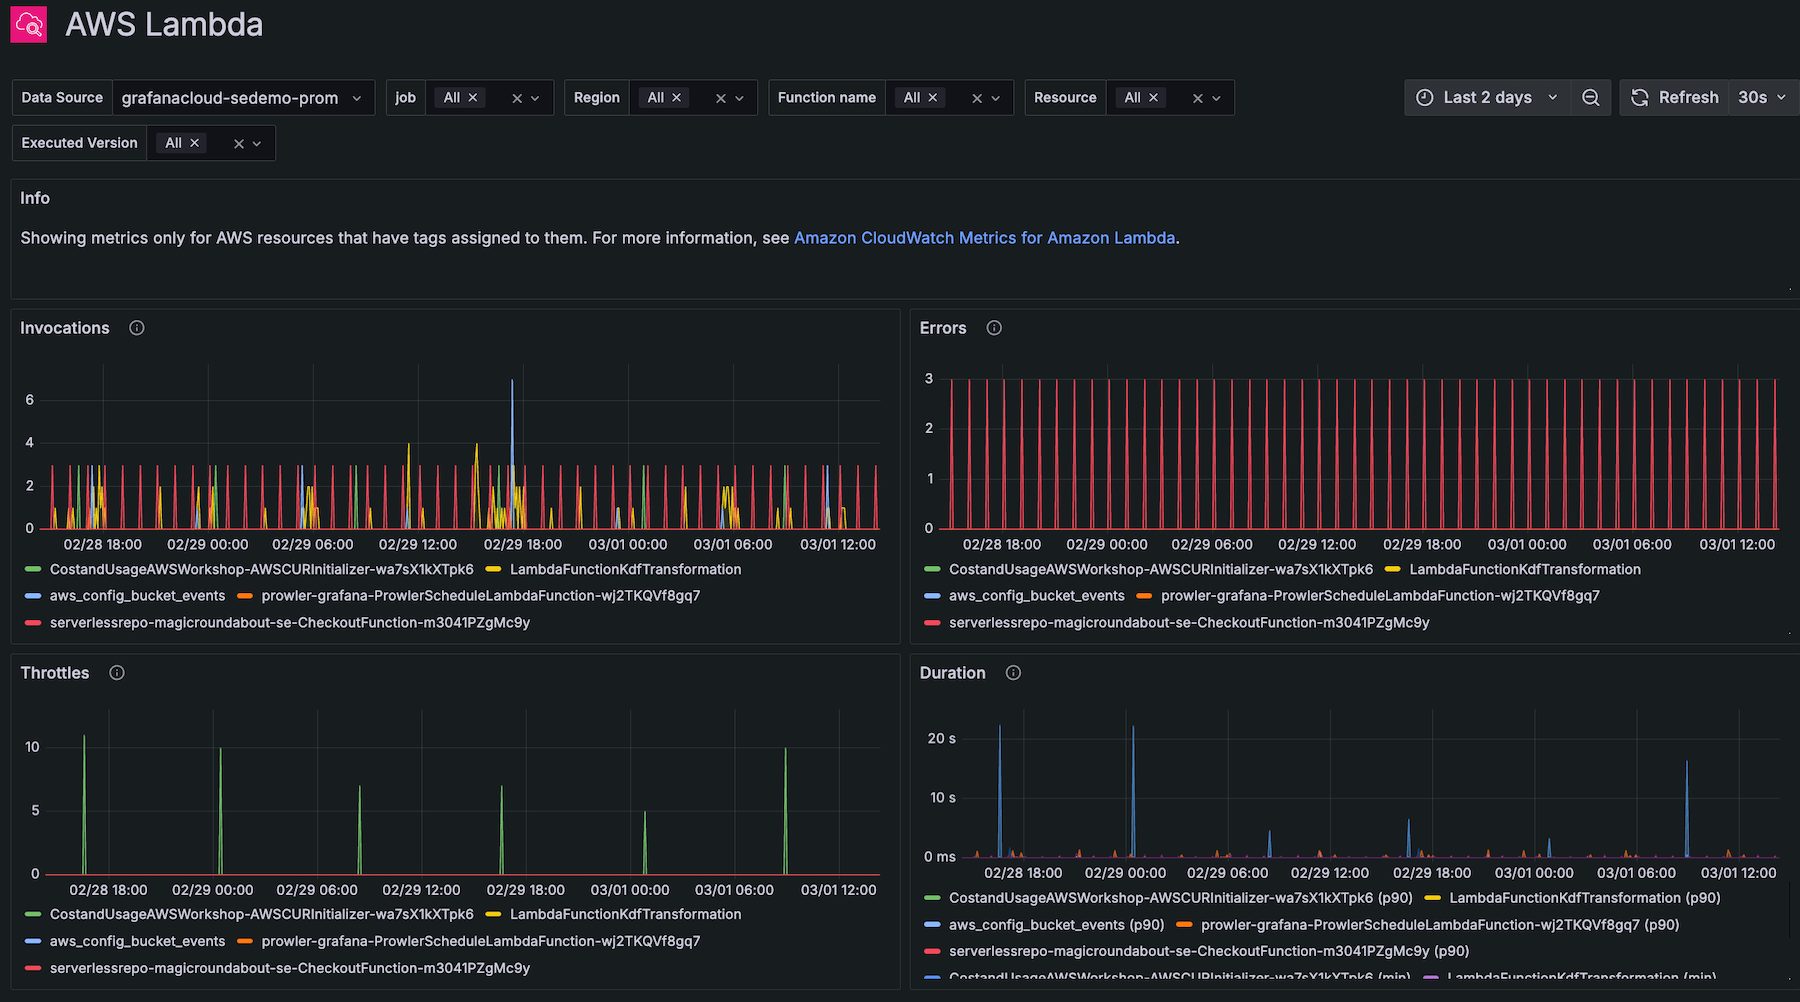
Prometheus + Grafana
Best open source for DIY and Kubernetes
While Prometheus and Grafana are separate tools, they go along and my favorite.
Prometheus acts as the engine, collecting metrics and storing them, while Grafana acts as the dashboard, visualizing that data.
I highly recommend this stack for AWS users because it is the de facto standard for monitoring Kubernetes (Amazon EKS). Unlike many tools that wait for agents to push data, Prometheus automatically pulls metrics from your services.
Note: AWS offers managed versions of these tools Amazon Managed Service for Prometheus and Amazon Managed Grafana.
Key Features
- Prometheus automatically discovers targets.
- PromQL is a powerful query language to slice metric data with extreme precision.
- Grafana can pull data from Prometheus, CloudWatch, and CloudTrail simultaneously to view AWS server health, and app performance on a single screen.
- Grafana handle the alerting.
- Because it is open source, you avoid vendor lock-in. You own your data and your configuration.
Limitations
- If you self-host, you are responsible for scaling and updates.
- Prometheus is designed for short-term data retention. For long-term history, you often need to add extensions like Thanos.
- Mastering PromQL takes time compared to readymade interface like New Relic.
Pricing
The pricing depends on how you deploy it:
- Self-Hosted: You only pay for the AWS EC2 instances and EBS storage required to run it.
- Amazon Managed Service: You pay based on metrics ingested ~$0.90 per 10 million samples.
- Amazon Managed Grafana: Charges roughly $9.00 per Editor licenses
Verdict
Choose Prometheus + Grafana if you are running containers on Amazon EKS. Or, you are looking for open source and DIY solution.
Splunk
Best for log analytics and security (SIEM)
Splunk is for logs and recommended for enterprise needing SIEM solution. It is the industry heavyweight for digesting massive amounts of logs from your AWS and turning it into searchable answers.
Splunk acts as a SIEM (Security Information and Event Management) system, ingesting CloudTrail logs, VPC Flow Logs, and application logs to detect security threats and compliance violations.
Splunk Limitations
- Splunk is expensive.
- It has a steep learning curve.
Verdict
Use Splunk if you are an enterprise and primary goal is SIEM.
Other AWS Monitoring Tools
Middleware
Motadata
Sematext
Elastic
Checkmk
Zabbix
LogicMonitor
Conclusion
AWS monitoring tools are essential for maintaining high availability and optimizing performance. While AWS-native tools like CloudWatch provide a good foundation for basic metrics, the third-party solutions listed above offers full-stack observability.
Your choice should depend on your specific infrastructure and budget:
- For simple cloud-native setups: Stick with AWS CloudWatch.
- For microservices architecture: Upgrade to Datadog or New Relic.
- For hybrid environments: Choose SolarWinds or PRTG.
- For Kubernetes & Open Source: Go with Prometheus + Grafana.
Happy monitoring ☺️