When your database lags, your business stops. Without robust database monitoring, your team lacks the real-time insights needed to keep the applications healthy.
Ask yourself:
- Can you proactively spot bottlenecks before they crash your app?
- How fast can you respond to security threats targeting sensitive data?
- Do you know the cost of downtime in lost productivity?
Database monitoring is more than just uptime; it’s about constantly tracking performance and resource usage. To do this effectively, you need the right stack. In this guide, we break down the best database monitoring tools to help you collect metrics, analyze logs and get notified when it goes down.
Note
To keep this guide highly relevant to database monitoring, I will not give details about common infra monitoring tool like New Relic, Paessler PRTG, Dynatrace, Netdata. These are all-in-one observability platform which are good at basic DB monitoring. But when you require serious DB monitoring, the following specialized tools are for you.
Top DB Monitoring Tools Review
1. Percona
Open Source Monitoring Tool for Open Source Databases.
Percona PMM is a open-source database management software to monitor the performance of MySQL, PostgreSQL, Amazon RDS, Amazon Aurora, ProxySQL, Percona XtraDB Cluster and MongoDB.
Identifying performance bottlenecks in open-source database often requires expensive knowledge and tool. Without them, teams struggle to correlate slow queries with resource spikes.
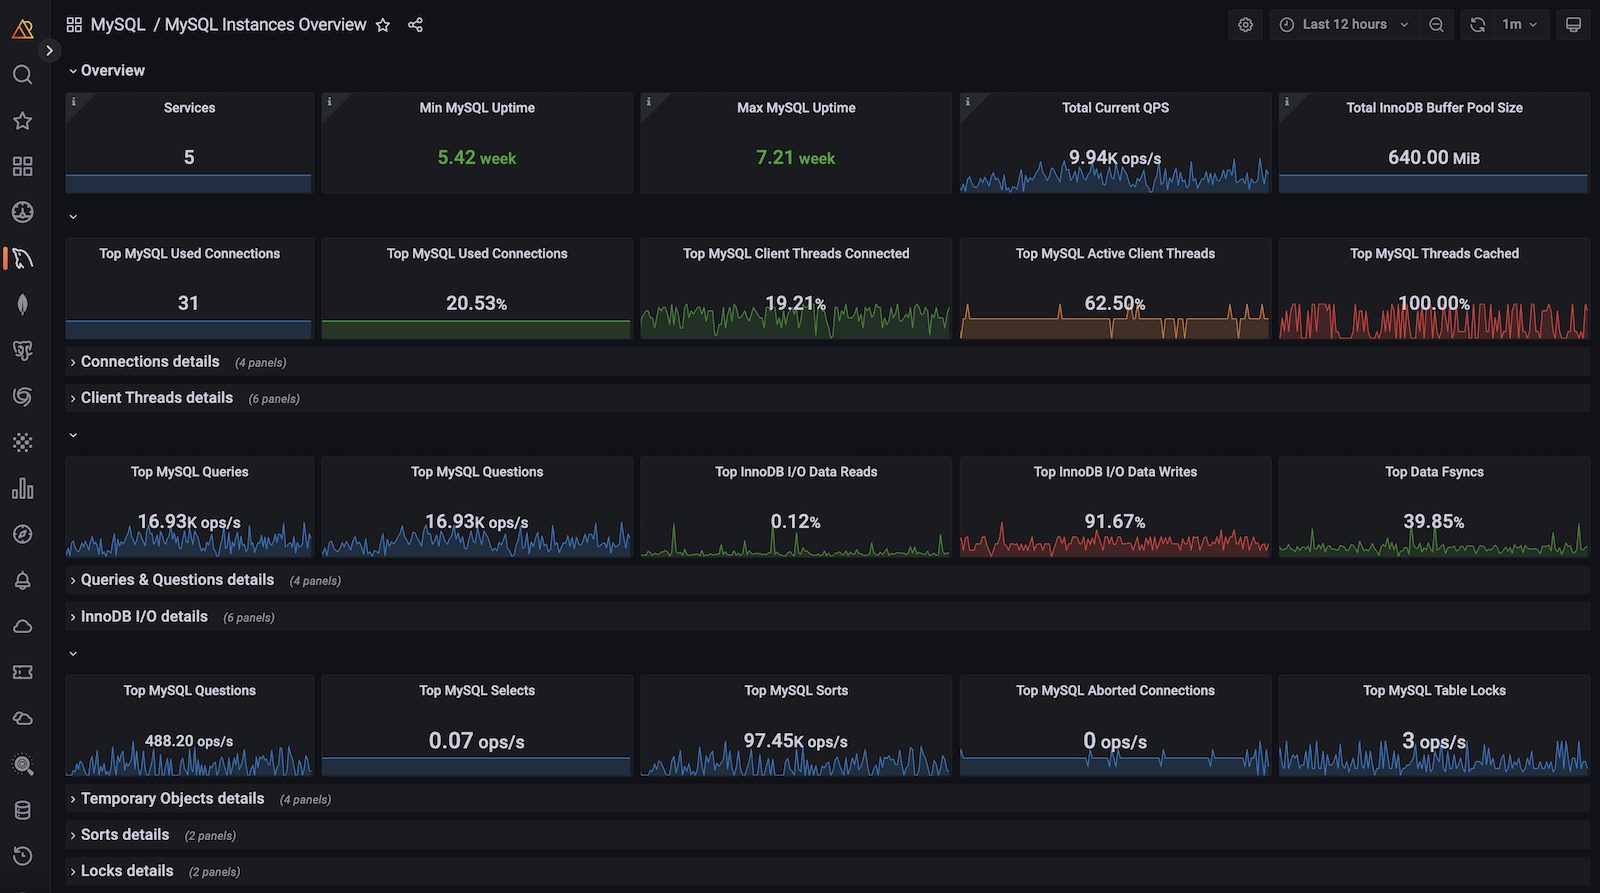
PMM solves this by bundling best-in-class tools like Grafana for visualization and Prometheus for metrics into one cohesive platform. It delivers real-time insights, allowing you to spot slow queries and analyze system resources.
Key Features
- Query Analytics (QAN) visualizes query execution times, allowing you to instantly identify and optimize the specific SQL queries.
- Monitor heterogeneous environments in one place.
- Comes with pre-built customizable dashboards.
- Proactively monitors your database for security gaps and audit log anomalies.
Pros & Cons
PROS
CONS
2. SolarWinds Observability
Best for enterprises managing hybrid environments.
SolarWinds Database Observability helps you to monitor, alert, and remediate database issues. It stands out by offering visibility across cloud-native, on-premises, and hybrid environments.
As infrastructure scale, we often end up having different tools for cloud and on-prem databases. This creates blind spots, making it difficult to pinpoint whether a bottleneck is caused by the infrastructure, application, or the database itself.
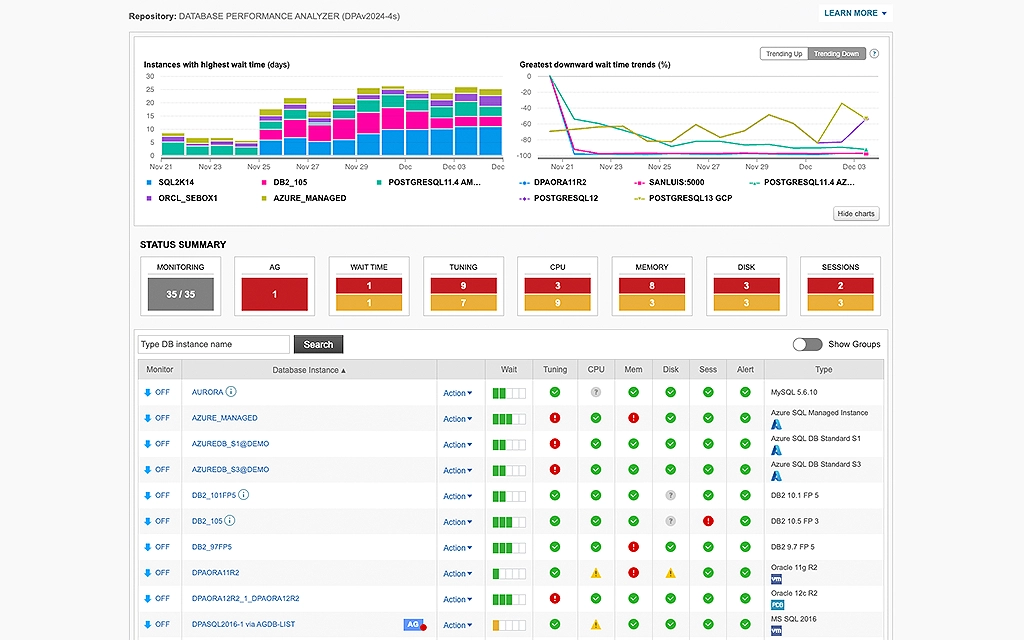
SolarWinds solves this by consolidating monitoring into a single platform. It moves beyond simple metrics by utilizing intelligent analytics to automate root cause analysis, allowing teams to diagnose issues visually without switching between multiple tabs.
Key Features
- AIOps to distinguish between normal anomalies and critical issues.
- Gain full visibility into major platforms including MySQL, PostgreSQL, MongoDB, and Azure SQL.
- Automated query analysis and bottleneck visualizations to tune performance.
- Proactively detects deviations in expected performance.
Pros & Cons
PROS
CONS
SolarWinds Database Observability Pricing
Multiple pricing options:
Self-Hosted – starts at $7.42/node/mo
SQL Sentry Self-Hosted – starts at $1999
Database Performance Analyzer Self-Hosted – starts at $1699
3. Quest
Best for large enterprises to manage database performance.
Quest Foglight offers end-to-end visibility for databases, applications, and the underlying infrastructure.
Managing performance in enterprise database like Oracle, IBM DB2 is not easy. Inbuilt administration is not enough and DBAs often struggle to know what exactly is causing the issue and takes more time to identify and fix the issues.
Quest goes beyond monitoring by integrating diagnostics with workload automation. It allows teams to standardize performance monitoring across platforms, automating routine tasks like index maintenance to free up DBA time.
Supported Databases
Key Features
- SQL Performance Investigator (PI) offers multidimensional analysis. It allows you to drill down into data to understand how server resources are being consumed by queries.
- SQL Optimizer analyzes problematic SQL statements and automatically suggests rewriting alternatives to improve performance.
- Foglight correlates database performance with the health of the underlying virtualization layer (VMware/Hyper-V).
Pros & Cons
PROS
CONS
You can download Quest 30-day free trial to test the software.
4. Datadog
All-in-one platform for Infrastructure, APM, and Data Quality.
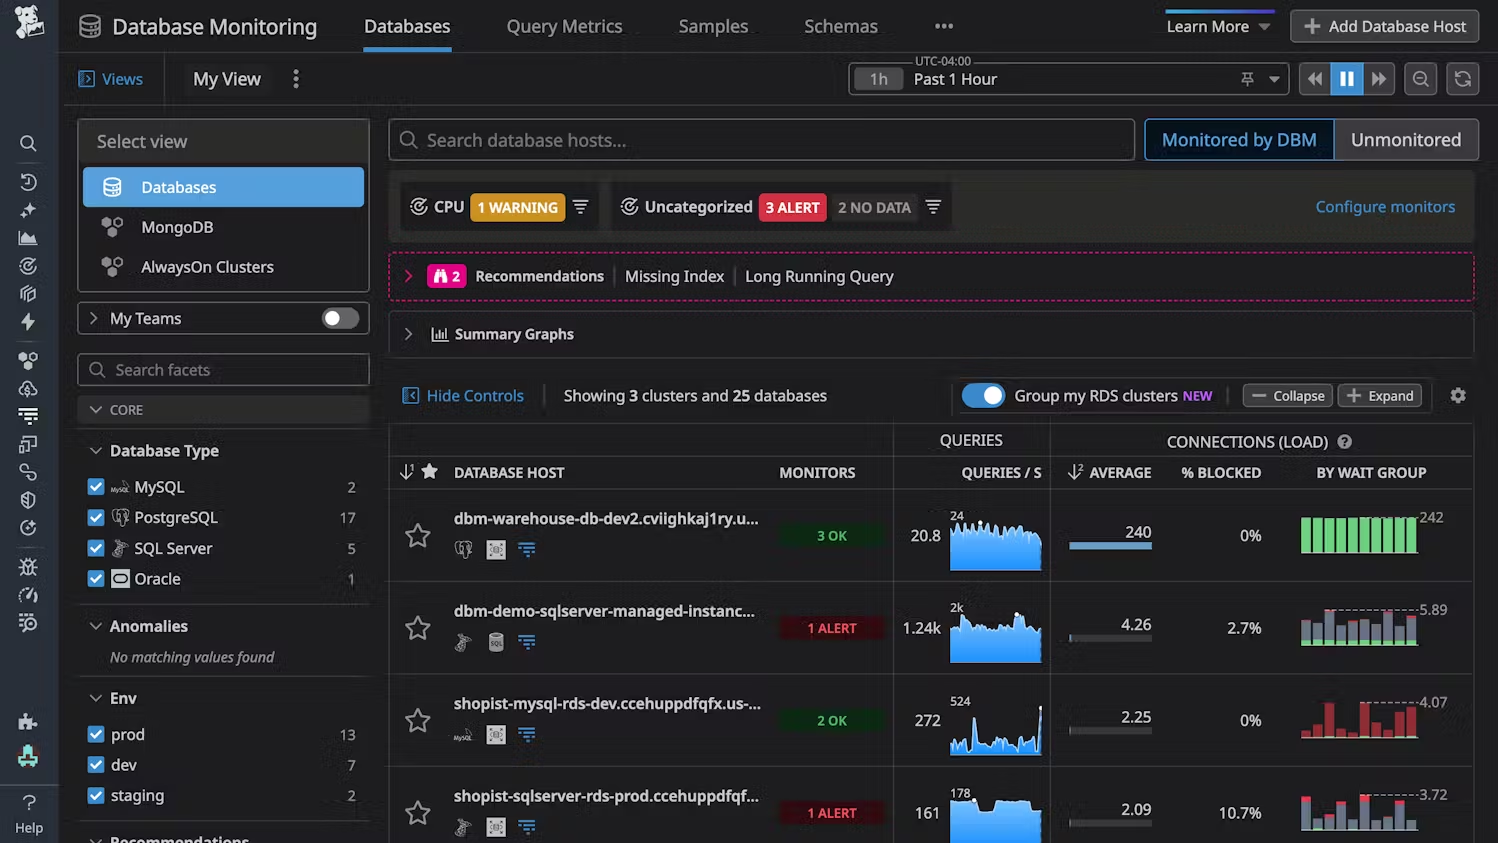
Datadog integrates infrastructure data, logs, and metrics into a single pane of glass. While it has long been a leader in cloud infrastructure monitoring, it is now much stronger with the Metaplane acquisition. Datadog has expanded its capabilities from standard DB Monitoring into Data Observability.
It correlates database performance with application traces and infrastructure logs, helping you to trace a bottleneck from the user’s click down to the disk I/O.
Key Features
- Identify the underline application that caused database slowness.
- Utilizes AI/ML to automatically detect anomalies.
- Proactively alerts you to root causes such as a sudden spike in query volume or error rates, reducing Mean Time to Resolution (MTTR).
- Full-stack security monitoring, detecting threats targeting your database and infrastructure.
Pros & Cons
PROS
CONS
DBM Pricing
Datadog database monitoring pricing starts at $70/host/month.
Metaplane is pay as you go.
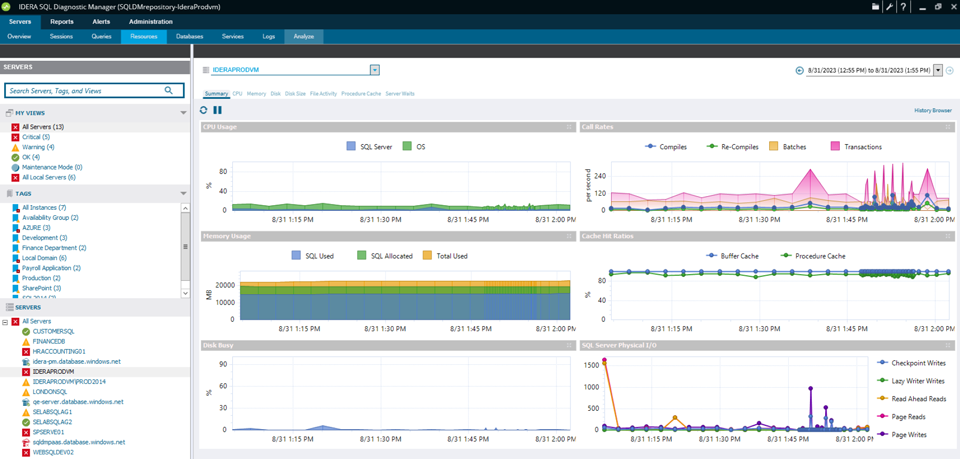
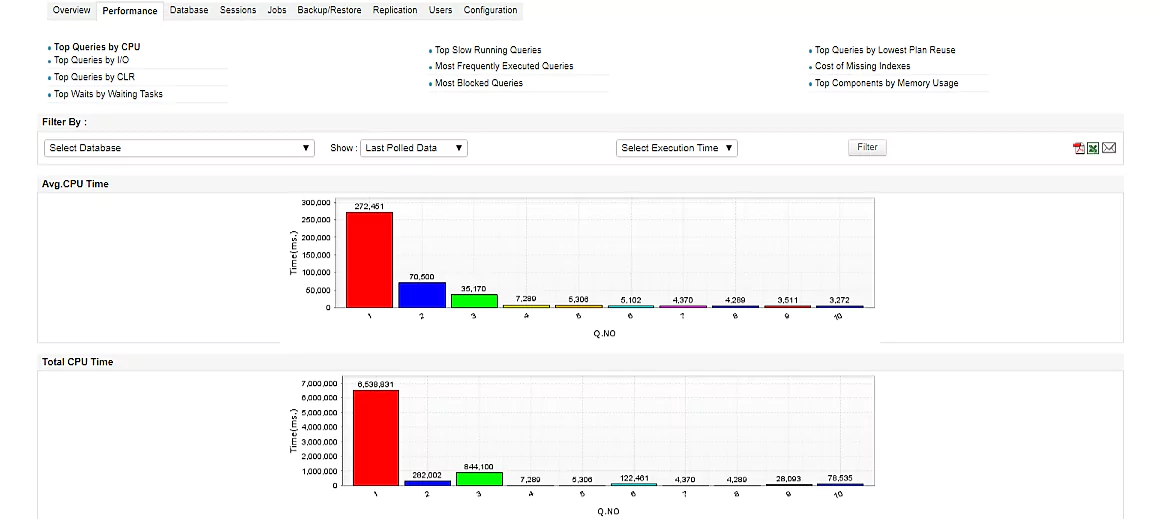
5. Idera
Best for Microsoft SQL Server ecosystem.
Idera SQL Diagnostic Manager is widely favored by DBAs for its ability to monitor database performance and administration efficiency.
DBAs often struggle to monitor hundreds of instances. Common issues like lock waits, fragmentation, and inefficient queries can degrade performance until the application crashes.
Idera moves you from reactive to proactive. It provides a comprehensive view of your entire SQL environment. By creating performance baselines, it helps you spot deviations and fix issues before it impacts.
It uses historical trend analysis to forecast future performance. This allows for effective capacity planning.
Pros & Cons
PROS
CONS
Pricing
Idera Diagnostic Manager for SQL Server pricing starts at $1247/instance.
6. ManageEngine Application Manager
Affordable solution for monitoring database and application.
ManageEngine Applications Manager is an all-in-one observability platform. It supports over 150 technologies and probably the largest number of databases.
It is ideal for SMEs that need to track databases, servers, cloud infra, and VMs in a single console.
Supported Databases
That’s a lot, isn’t it?
Key Features
- Monitors everything from the website to the disk.
- Instrumentation for Java, .NET, PHP, Node.js, and Python. This helps you identify memory leaks and code-level bottlenecks that impact database performance.
- Automatically discovers applications and maps their dependencies.
Pros & Cons
PROS
CONS
ManageEngine Application Manager Pricing
Free – monitor up to 5 things, including RDBMs.
Professional – starts at $395/year.
Enterprise – starts at $3995/year.
You can download the free edition or take a free 30-day trial.
7. dbWatch
Best for MSPs and large enterprises.
dbWatch Control Center is a database command center for your entire database across different platforms and locations.
You can monitor Microsoft SQL Server, Oracle, Sybase, Postgres, MariaDB, and MongoDB. By automating maintenance and reporting, it allows DBAs to effectively manage a massive database farms.

Key Features
- Cross platform support, which means you don’t have to buy multiple tools for multiple databases.
- Scale from a few servers to thousands of instances.
- Low-overhead agents which doesn’t impact the database performance.
- Script and automate routine tasks like backups or index rebuilding across hundreds of servers using templates.
dbWatch Pricing
dbWatch offer 90-day free trial and pricing depends on number of instances you want to monitor. Ex – 1 Oracle instance monitoring with professional support would cost $600/year.
I wouldn’t suggest dbWatch to a smaller team or infra due to its cost.
8. Redgate Monitor
Redgate Monitor offers real-time visibility into SQL Server, Oracle, MongoDB, MySQL, and PostgreSQL database. What I like about Redgate is the capabilities of automating repetitive tasks and problem diagnosis.
You can monitor cloud databases like Amazon Aurora, Azure SQL or on-premises hosted traditional DBs. It comes with preconfigured alerting which you can customize to fit your needs. You can configure to get notified through Slack, email, PagerDuty or your ticketing tool through webhooks.
Recently, they have introduced Monitor AI, which helps you find performance bottlenecks and gives insights to tune the queries.
Pros & Cons
PROS
CONS
Redgate Monitor Pricing
Redgate Monitor pricing depends on number of servers license you require. It starts at $1233/server for 1 to 4 servers requirements.
They offer 14-day free trial as well.
Other DB Monitoring Tools
Prometheus
Checkmk
DBmarlin
Paessler PRTG
Pganalyze
Top DB Monitoring Tools Comparison
| Tool | Best For | Deployment | Standout Feature |
|---|---|---|---|
| Percona PMM | Open-Source Environments | Self-Hosted | Query Analyticsfor deep MySQL/Postgres insights. |
| SolarWinds | Hybrid Enterprises | SaaS | AIOps specifically for hybrid visibility. |
| Quest Foglight | Deep SQL Tuning | On-Prem / Hybrid | SQL Optimizer that automatically suggests code fixes. |
| Datadog | Cloud-Native & DevOps | SaaS | Metaplane Integration for Data Observability + System Health. |
| Idera | SQL Server Specialists | On-Prem | Agentless Architecture with predictive capacity planning. |
| ManageEngine | Affordable, SMEs | On-Prem / Cloud | APM + DB Combo. |
| dbWatch | Scalability | On-Prem | License Management & handling 1,000+ instances. |
| Redgate | SQL Server DevOps | On-Prem | Deployment Tracking to correlate code releases with lag. |
| Prometheus + Grafana | DIY | Self-Hosted | Metrics and visualization. |
| Checkmk | SysAdmins & Infra | On-Prem | Performance with extremely low CPU overhead. |
| DBmarlin | Modern Multi-Platform | Self-Hosted | AI Co-pilot. |
| PRTG | General IT / Networks | On-Prem / SaaS | Sensor-Based monitoring for the entire network stack. |
| pganalyze | PostgreSQL Dedicated | SaaSe | EXPLAIN Visualization and index recommendations. |
Conclusion
Choosing the right database monitoring tool is a critical investment in your application’s reliability. With the variety of options listed above, the best choice depends on your infrastructure, team expertise, and budget.
- For budget & DIY teams, open-source solutions like Prometheus + Grafana or Percona PMM is a good option. If you prefer a paid tool, ManageEngine Applications Manager is an affordable choice.
- For cloud & all-in-one, Datadog is the superior option.
- For SQL server & enterprise, specialized tools like Redgate Monitor, Idera, or SolarWinds will provide the granular tuning capabilities.
The cost of a good monitoring tool is always lower than the cost of outage. I recommend shortlisting two or three options from this list and taking advantage of their free trials. Run them side-by-side in your NONPROD environment to see which one suits you