Organizations turn to virtualization to squeeze more out of their hardware resources, spin up new environments in minutes, isolate workloads for tighter security, and cut infrastructure costs.
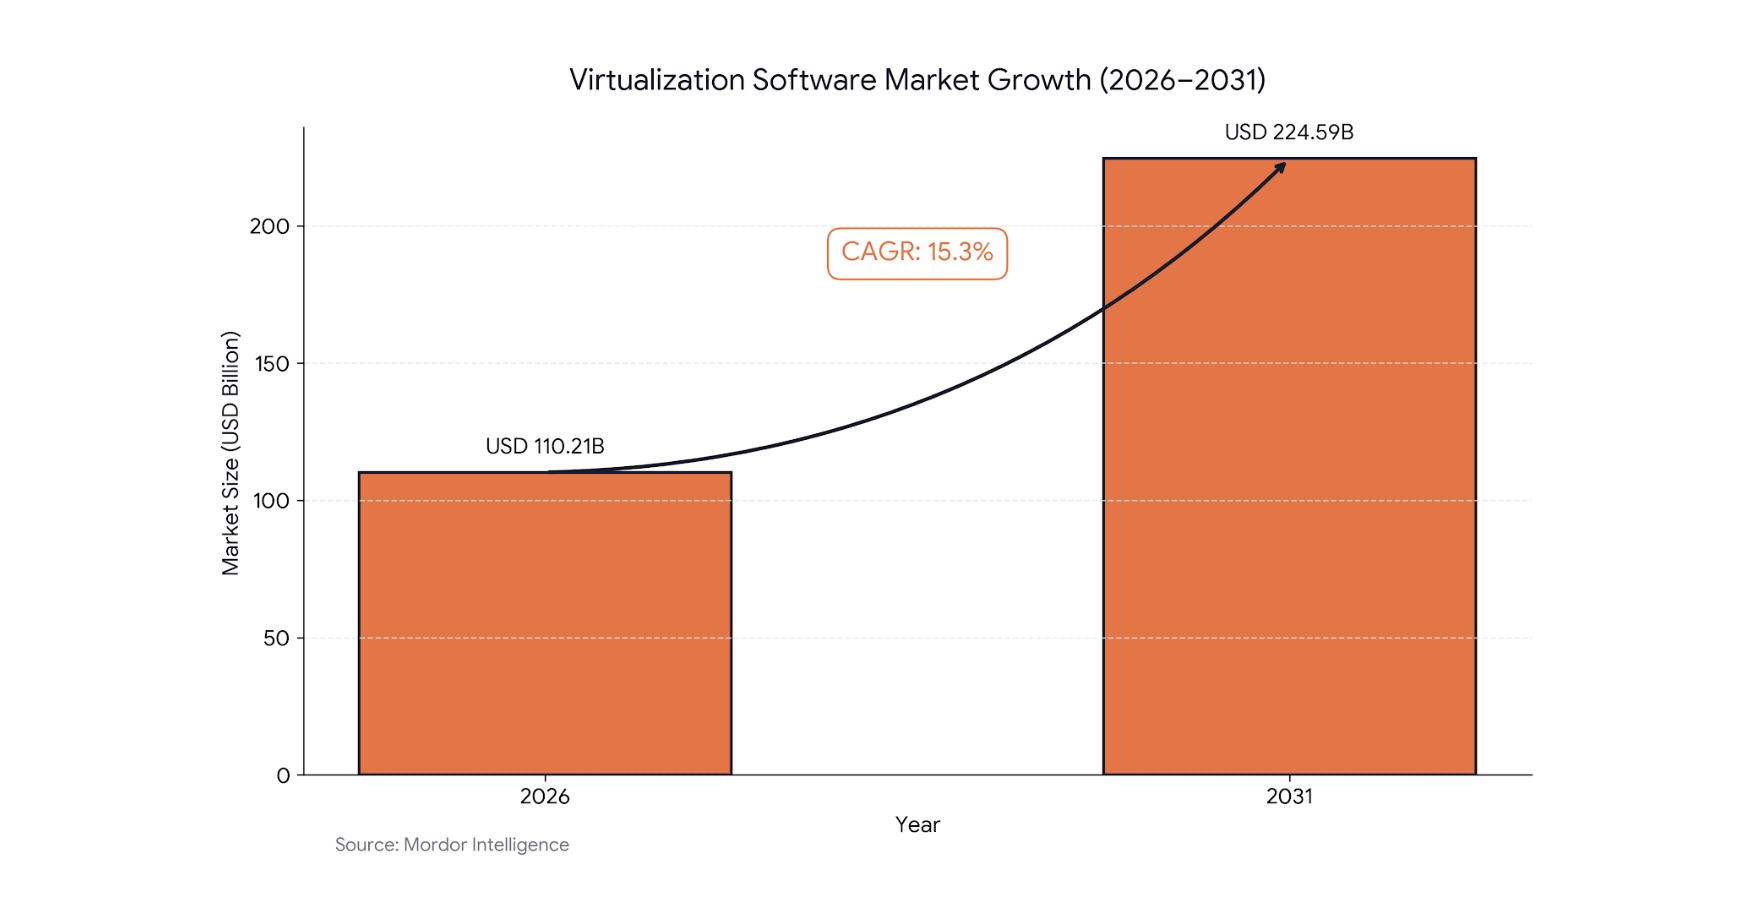
It’s no surprise that the virtualization software market is expected to double from over $110 billion to $225 billion in the next five years.
Among the hypervisors contributing to this growth, Microsoft Hyper-V has a unique advantage in Windows environments. It’s included out of the box with Windows Server, with no additional license fees.
But to get the most out of your Hyper-V, you need complete visibility. Otherwise, you risk facing issues such as hidden performance bottlenecks, unsafe over-commitment, poor capacity planning, and security blind spots.
Windows does include built-in tools like Task Manager, Performance Monitor, and Resource Monitor. But they fall short in complex, multi-host Hyper-V environments.
In this article, we will review the top third-party Hyper-V visibility tools, including SolarWinds, PRTG, and others, based on features, pricing, and usability.
What to Monitor in Hyper-V?
You need to keep tabs on the following core areas to monitor your Hyper-V effectively. Server virtualization monitoring involves more than just checking if a VM is ‘on’; it requires a deep dive into the relationship between virtual resources and physical hardware.
CPU Wait Time & Usage
It’s important to track how much Central Processing Unit (CPU) your host and virtual machines (VMs) are using. This will help you understand whether vCPUs are waiting on physical cores, often referred to as CPU Ready time or CPU Entitlement issues. You can also catch CPU bottlenecks before users can feel them.
Additionally, knowing historical CPU usage across hosts and clusters lets you understand how much real headroom you have and how consolidation changes over time.
As a result, you can determine:
- When to add hosts
- Where to place new VMs
- How aggressively you can consolidate without risking performance
Dynamic Memory
Dynamic Memory allows Hyper‑V to automatically adjust a VM’s RAM allocation based on its real‑time workload. So you must monitor it to avoid over-commitment.
It’s advisable to track host Available MBytes and Committed Bytes, plus Dynamic Memory Balancer Average Pressure. For per-VM granularity, also monitor Guest Visible Physical Memory under the Hyper-V Dynamic Memory VM counter.
If you find high pressure (near 100%), it means VMs are fighting for RAM, triggering paging and seriously degrading application performance.
Disk I/O Latency
Storage is often the silent killer in virtual environments. Monitor average read/write latency, Input/Output Operations Per Second (IOPS), and disk queue depth on both hosts and VMs.
Latency thresholds differ by storage type. Hard Disk Drives (HDDs) tolerate up to 10-20ms before trouble starts. Solid State Drives (SSDs) should stay under 3-5 ms, and Non-Volatile Memory Express (NVMe) drives expect less than one millisecond response.
Network Utilization
You need to monitor network utilization in Hyper‑V to catch two things mainly: congestion and contention. It allows you to pinpoint VMs that saturate bandwidth, slowing down peers on the same virtual switch.
By tracking metrics like output queue length, you can prevent packet drops and latency. You can also verify whether performance bottlenecks stem from physical hardware or virtual switch misconfigurations.
Snapshot/Checkpoint Health
Monitoring Hyper-V checkpoints helps you prevent storage exhaustion and performance degradation. While useful for temporary rollbacks, long-standing or overgrown snapshots consume significant disk space and complicate backup operations.
Effective monitoring should track the number, age, and total size of checkpoints per VM. It should also specifically alert on failed merge operations or orphaned .avhdx files that can silently deplete host resources.
Host/Cluster Health
Your VMs are only as healthy as the physical infrastructure running them. A failing power supply, an overheating CPU, or a degraded RAID array on the host can take down every VM on that machine in one go. So, it’s important to keep tabs on host/cluster health.
At the host level, you should monitor CPU temperature, fan speed, power supply status, and physical disk health. And keep an eye on node membership, quorum status, Cluster Shared Volume (CSV) availability, and failover events on the cluster level.
How We Ranked These Tools
In addition to core monitoring features, we’ve evaluated each tool based on the following five pillars:
- Ease of Deployment: We’ve measured how quickly a solution can be implemented using auto-discovery, pre-configured templates, and setup wizards for Hyper-V hosts, VMs, and clusters.
- Scalability: It’s a critical factor for long-term growth. We’ve checked product documents thoroughly to verify each tool’s ability to scale from a handful of hosts to large, distributed environments and multi-hypervisor setups.
- Alerting Capabilities: We’ve assessed the sophistication of notification systems, including threshold-based triggers, anomaly detection, and seamless integration with email, SMS, Microsoft Teams, and incident management platforms.
- Reporting and Dashboards: Our evaluation has prioritized tools that offer robust historical reporting, capacity planning, and customizable dashboards tailored for both operations teams and executive management.
- Pricing and Licensing: We’ve looked for transparency and flexibility, considering per-socket, per-device, per-sensor, and SaaS usage-based models to ensure a fit for both SMB and enterprise budgets.
Why Trust Our Guide
Top Hyper-V Monitoring Tools
Here are the top seven Hyper-V monitoring tools based on our research.
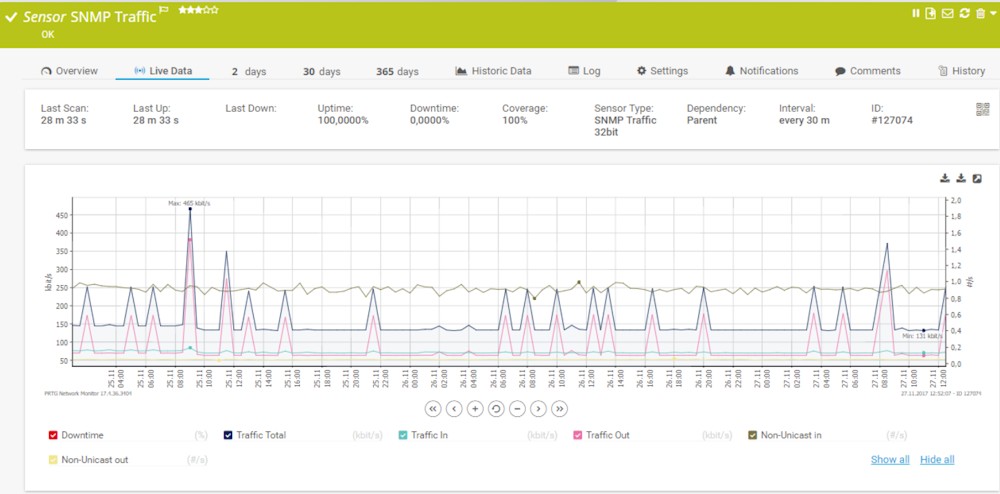
Paessler PRTG Network Monitor
Best for SMBs
Paessler PRTG Network Monitor offers a range of tools to help you monitor your IT infrastructure, including systems, devices, virtual machines, and applications. As it is an easy-to-use solution, businesses of all sizes can implement it with minimal effort.
In our opinion, it is the best choice for SMBs to monitor Hyper-V performance because it covers all layers of Hyper-V virtualization. The platform provides you with a centralized view of your monitoring data in easy-to-read dashboards.
What’s more, you also have the flexibility to design custom maps and dashboards using its drag-and-drop map editor.
What we liked most in our research is that Paessler PRTG Network Monitor doesn’t require you to be glued to your monitor to check whether your virtual environment is working properly.
The solution will alert you immediately via email, SMS, push notifications, Microsoft Teams, Slack, and more if an anomaly is detected in your Hyper-V environment. You have the full flexibility to customize these notifications.
Paessler PRTG Network Monitor Features
- Monitors Hyper-V hosts, virtual machines, and cluster-shared volumes.
- Prevents the outage of your VMs by optimizing their performance.
- Provides immediate alerts for anomalies.
- Offers flexibility to customize dashboards.
Pros & Cons
PROS
CONS
Pricing
Paessler PRTG Network Monitor uses device-based pricing, starting at $179/month (paid annually) for 50 devices and reaching $1,492/month for 10,000 devices. Custom plans are available via quote request. The company also offers a free trial.
SolarWinds Virtualization Manager (VMAN)
Best for medium to large enterprises
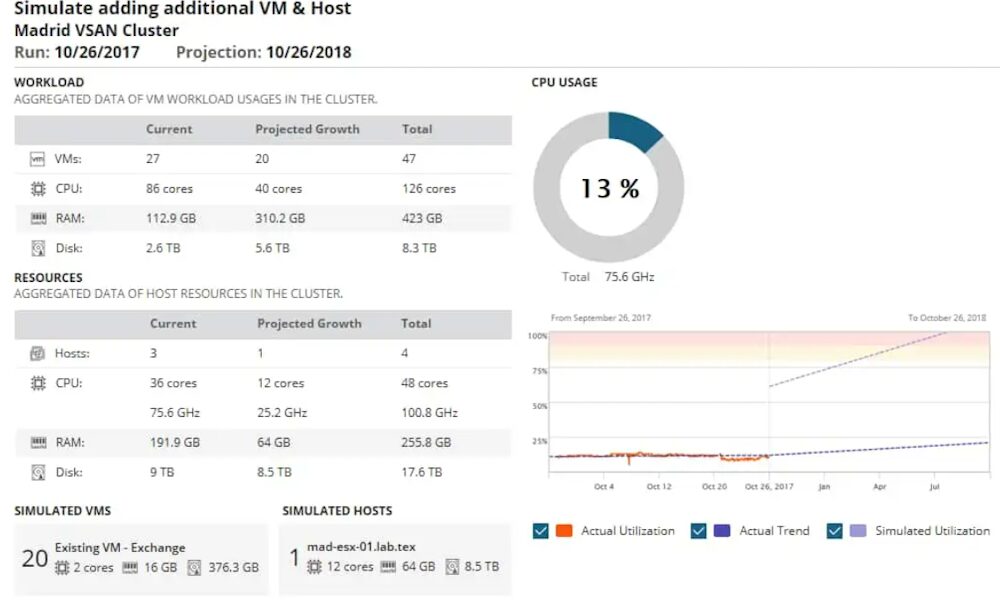
SolarWinds Virtualization Manager is part of the SolarWinds Observability Self-Hosted solution, which is designed to handle the scale, complexity, and extensive monitoring needs of large enterprises.
We’ve also reviewed its documentation and found that the platform offers several network-monitoring features suitable for large enterprises. These capabilities include, but are not limited to, network performance monitoring, server and application management, flow monitoring and analysis, IP address management, and network device configuration management.
That said, we believe SolarWinds Virtualization Manager is ideal for medium- to large-enterprise VM monitoring. With its intuitive solutions, the platform simplifies management of the virtual environment.
You can monitor virtual machine performance in real time to make smarter resource-allocation decisions and improve operational efficiency.
What’s more, the platform lets you forecast future VM and storage requirements by analyzing historical data. As a result, you can scale efficiently to avoid downtime.
👉 If you want a solid alternative to SolarWinds Virtualization Manager for monitoring Hyper-V, Progress WhatsUp Gold is worth considering.
SolarWinds Virtualization Manager Features
- Optimizes resource allocation for better efficiency of your VMs.
- Uses historical trends to predict future resource needs and prevent over-provisioning.
- Identifies and manages unused, underutilized VMs.
- Monitor CPU, memory, and I/O usage to prevent bottlenecks.
- Provides comprehensive visibility into Nutanix AHV to track VM performance.
Pros & Cons
PROS
CONS
Pricing
SolarWinds Observability Self-Hosted costs $7.42 per node per month with volume discounts available for larger deployments. You can get a free trial to explore its features.
ManageEngine OpManager
Best for IT teams on a limited budget
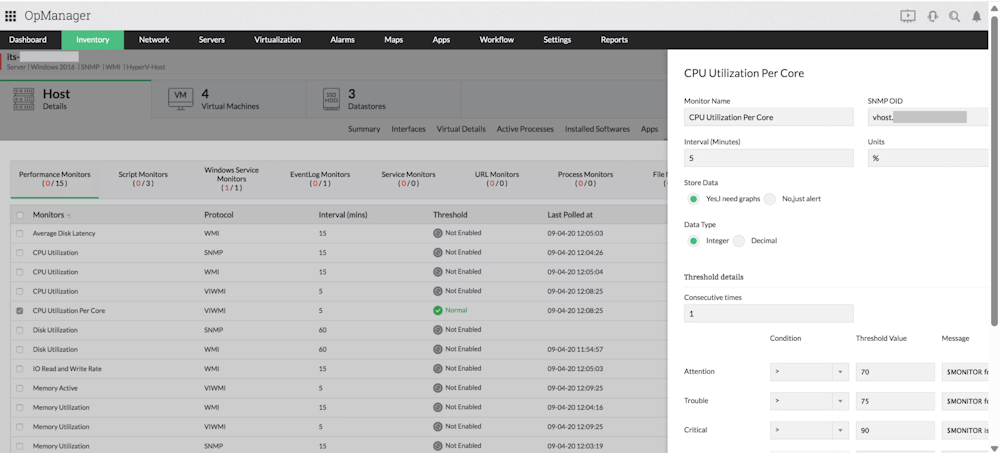
ManageEngine OpManager includes powerful Hyper-V monitoring capabilities that support up to 40 monitors. You can track CPU, memory, disk, and network performance.
In our research, we were impressed with its automated Hyper-V discovery and classification. The platform leverages Windows Management Instrumentation (WMI) to identify and classify Hyper-V hosts.
After discovering your Hyper-V devices, it classifies them as virtualization. And then it uses device templates to associate predefined monitoring.
ManageEngine OpManager can address sprawl and zombie VMs by actively tracking VMs per host and resource allocation for each VM. So, you can use it as an efficient Hyper-V inventory tool. It serves as a robust VM management software, helping administrators track inventory and prevent VM sprawl.
You can also explore the forever-free Hyper-V monitor from ManageEngine. In our assessment, we found it ideal for IT teams with limited budgets, given its generous forever-free plan and competitive paid plans.
Detailed Review
Check out our detailed review of ManageEngine OpManager.
ManageEngine OpManager Features
- Saves administrators significant setup time by automatically discovering and classifying Hyper-V hosts.
- Prevents sprawl and zombie VMs effectively by actively tracking VM lists and resource allocations per host.
- Offers comprehensive round-the-clock performance visibility for hosts and guests (40+ monitors).
- Helps you spot underutilized resources and plan virtual capacity efficiently with 70 built-in reports and intuitive dashboards.
Pros & Cons
PROS
CONS
Pricing
OpManager offers three editions: Standard, Professional, and Enterprise, with Hyper-V monitoring available exclusively in the Professional ($145 for 10 devices) and Enterprise ($4,495 for 250 devices) plans. It offers a 30-day free trial.
Datadog
Best for hybrid cloud setups
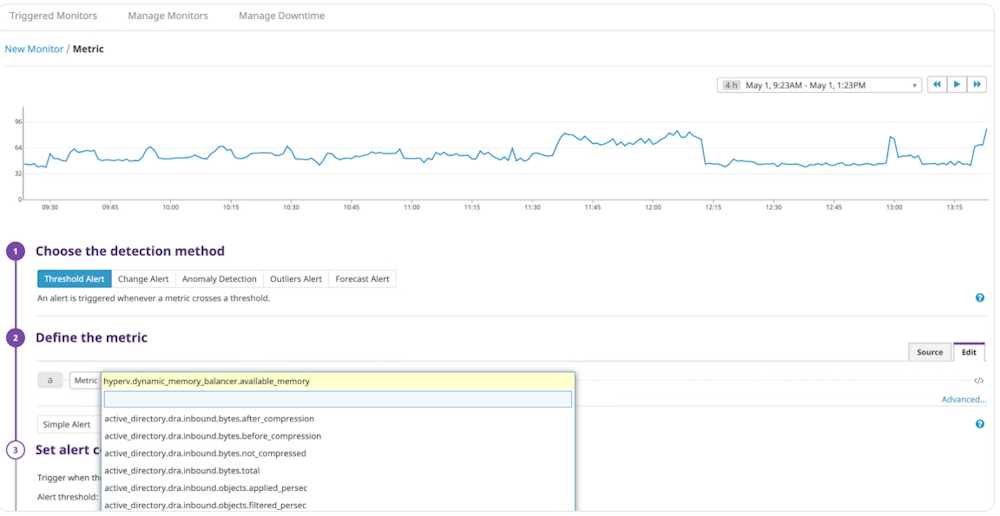
Datadog is an AI-powered observability and security platform that helps you monitor any tech stack, anywhere. It offers Hyper-V integration to monitor the health of every layer of the Hyper-V stack.
You can track the amount of memory left on the node, the average pressure in the VM, and the combined rate at which all processors on the computer switch between threads, and various other useful metrics.
During our in-depth evaluation of Datadog, we observed that it seamlessly integrates with public clouds (AWS, Azure, Google Cloud), private clouds, and virtualization platforms such as Hyper-V and VMware within minutes, thanks to its extensive library of vendor-backed integrations.
Datadog assigns detailed tags to every on-premises host, cloud instance, container, and datapoint, enabling you to easily filter, group, and correlate data across any environment.
This flexibility and cross-platform visibility make Datadog our best pick for monitoring cloud and hybrid infrastructures.
Datadog Key Features
- Monitors the health of every layer of your Hyper-V stack.
- Sends alerts when a Hyper-V host’s available memory drops below a set threshold to avoid excessive paging and performance impairment.
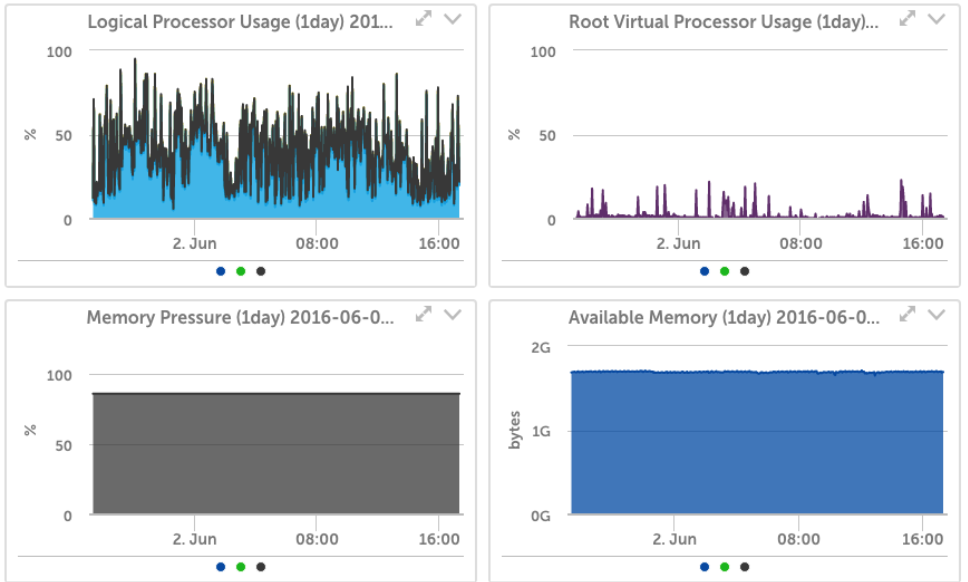
- Provides deep visibility into workloads running on both logical and virtual processors, with real-time CPU usage graphs broken down by physical host.
- Provides granular, process-level resource usage views for Hyper-V virtual machines, updated every 2 seconds, with historical data back 48 hours.
Pros & Cons
PROS
CONS
Pricing
Datadog’s Infrastructure plan starts at $15 per host/month and includes Hyper-V monitoring. A free trial is available for users who want to explore its features before committing.
Dynatrace
Best for large enterprises to monitor infrastructure uptime
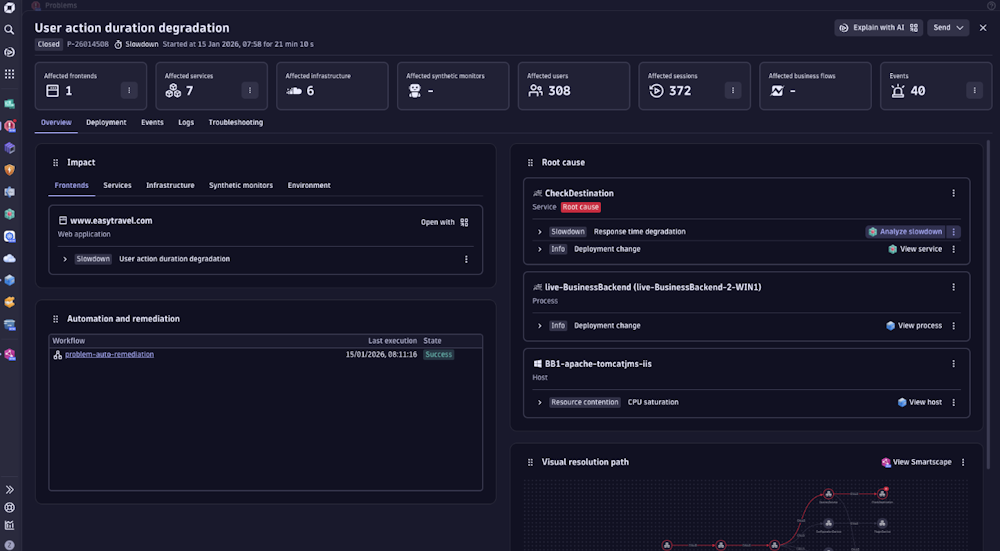
Dynatrace offers a dedicated Hyper-V Infrastructure extension that monitors the health and performance of Hyper-V clusters, hosts, and VMs.
It employs PowerShell cmdlets and WMI queries to gather data from the Windows hypervisor. It also follows Microsoft’s best practices and drawing on real-life scenarios from Dynatrace customers who contributed to the extension.
The extension provides built-in analysis screens and easy-to-navigate dashboards for complete visibility into your virtualized environment.
It can help you monitor Hyper-V clusters, detect issues before they create an impact, and find issues in the virtualization and application layer, such as processor bottlenecks, memory or storage issues, or network overload.
With OneAgent integration, you can directly correlate application performance issues to the underlying Hyper-V resources allocated to each VM.
Dynatrace Features
- Tracks over 50 metrics across CPU, memory, disk, and network for both Hyper-V hosts and virtual machines.
- Monitors Hyper-V failover clusters, including cluster-shared volumes, with metrics for total space, used space, available space, read rate, and write rate.
- Proactively detects processor bottlenecks, memory shortages, network overloads, storage shortages, and application slowness.
- Gives AI-Powered Analytics for complete performance characterization of monitored guest OS instances.
Pros & Cons
PROS
CONS
Pricing
Dynatrace pricing starts at $29 per month per host, billed at $0.04 per hour per host.
LogicMonitor
Best for MSPs
LogicMonitor stands out as an essential Hyper-V monitoring solution for MSPs thanks to its comprehensive, automated approach to infrastructure visibility.
It helps automatically discover and monitor everything from hypervisors and virtual machines to network switches and physical hardware, enabling MSPs to manage multiple client environments efficiently without manual configuration.
We also liked its predefined alerts, presented in plain English. So it doesn’t require having deep technical expertise to know what’s going on in any IT infrastructure.
What’s more, dynamic thresholds in LogicMonitor can proactively detect anomalies. As a result, MSPs can resolve issues before clients notice them.
LogicMonitor automatically discovers your entire Hyper-V setup. You just provide the server hostname, and it handles the rest.
Beyond traditional Hyper-V, LogicMonitor also supports monitoring of Azure Stack HCI, giving visibility into hyperconverged environments as clients modernize their infrastructure.
👉You can explore Turbo 360 if you require Azure Stack HCI monitoring.
LogicMonitor Features
- Automatically discovers and monitors all Microsoft Hyper‑V virtual machines.
- Provides pre‑defined and dynamic alerting for Hyper‑V metrics, using historical baselines.
- Monitors underlying server hardware health—such as fans, power supplies, and chassis temperature for supported Dell, HP, and other hardware platforms when integrated.
- Tracks VM‑level CPU, memory, network, and storage performance over time.
Pros & Cons
PROS
CONS
Pricing
LogicMonitor pricing starts at $16 per hybrid unit per month, with add‑ons billed separately depending on your plan.
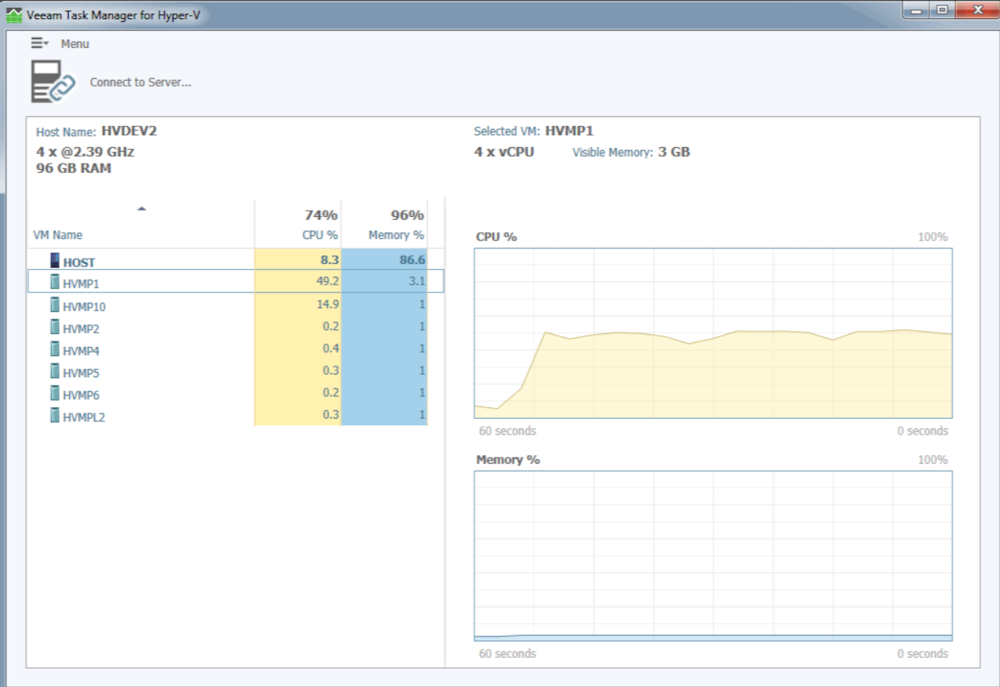
Veeam Task Manager
Best for Portability
Veeam Task Manager for Hyper-V is an excellent free monitoring tool that every Hyper-V administrator should have in their toolkit.
Unlike Windows Task Manager, which only shows host-level data, Veeam Task Manager provides real-time visibility into CPU and memory usage at the individual VM level. You can use it to pinpoint resource-hungry virtual machines instantly.
Its lightweight, portable design requires zero installation. You can simply run it from any USB device for on-the-go troubleshooting. This makes it perfect for quick diagnostics and ad hoc performance checks.
However, the free tool lacks many advanced features, such as AI-powered monitoring and smart alerting, which are often required in a business setting.
Veeam Task Manager Features
- Offers instant, live visibility into CPU and memory usage at the individual virtual machine level.
- Quickly identifies host resource usage by VM.
- Runs directly from any USB device with no installation required.
- Operates with minimal system overhead to ensure accurate monitoring without impacting server performance.
Pros & Cons
PROS
CONS
Pricing
Veeam Task Manager is free to use.
When to use PerfMon and SCVMM?
Microsoft provides several built-in tools for monitoring Hyper-V, and each one has its own role.
- SCVMM lets you manage virtual hosts and VMs from one place, taking care of provisioning and basic performance monitoring
- Performance Monitor (PerfMon) tracks real-time counters such as CPU, memory, and disk usage for both hosts and VMs
- Event Viewer captures system logs and errors, which helps with diagnosing issues after they happen.
- PowerShell allows you to set up scripted monitoring and automate health checks
- Resource Monitor gives you quick snapshots of real-time resource usage
These tools are useful for quick troubleshooting and day-to-day management, but they lack features such as historical reporting, trend analysis, automated alerts, and unified dashboards, which are important in larger setups.
For example, PerfMon mainly displays real-time data and needs a lot of manual work to save and review long-term trends.
In the same way, SCVMM is good at managing infrastructure, but does not provide detailed performance analytics or smart alerts based on thresholds like specialized monitoring tools do.
That’s why many organizations turn to dedicated third-party monitoring solutions that deliver the deep analytics, proactive alerting, and centralized visibility these native tools lack.
FAQs
Yes, there are free Hyper-V monitoring tools. Here are the top ones:
Veeam Task Manager: A free, lightweight Hyper-V monitoring tool that provides real-time CPU and memory views. It requires no installation and runs directly from any USB device.
ManageEngine Free Hyper-V Performance Monitor: A free tool that monitors Hyper-V servers and VMs for CPU, memory, disk read/write, and network Rx/Tx traffic, with the ability to monitor up to two Hyper-V servers simultaneously.
Zabbix: A universal, open-source observability solution for IT and OT that monitors everything, including cloud, networks, services, and IoT, available both on-premise and in the cloud, anytime and anywhere.
Paessler PRTG Network Monitor, SolarWinds Virtualization Manager (VMAN), and ManageEngine OpManager are hypervisor-agnostic and offer unified monitoring for Hyper-V and VMware.
Conclusion
As you have seen, each Hyper-V monitoring tool serves a different purpose. For dedicated virtualization management in a medium to large enterprise, SolarWinds Virtualization Manager offers the scale and diverse monitoring capabilities.
If you’re looking for versatile network and VM monitoring at a reasonable price, PRTG or ManageEngine OpManager are strong choices, especially for SMBs and budget-conscious IT teams.
And for hybrid or multi-cloud environments, Datadog’s cross-platform visibility and seamless integrations make it the clear frontrunner.
Before committing to any Hyper-V monitoring solution, it’s always better to assess your requirements and explore various tools to find the one that best suits them.
We recommend trying as many tools as possible to find the best value for your money. Since most tools offer a free trial, it wouldn’t be an issue to try one before buying a license.