In this guide, we will explore the top Kubernetes monitoring tools, including open-source, free, and premium options. These tools are essentials when default Kubernetes dashboard is not enough.
Please note that this guide focuses on specialized cloud-native solutions with Kubernetes at their core. We have intentionally excluded general-purpose APM platforms such as New Relic or Datadog that offer Kubernetes features as an add-on, in order to focus on tools built specifically for container orchestration.
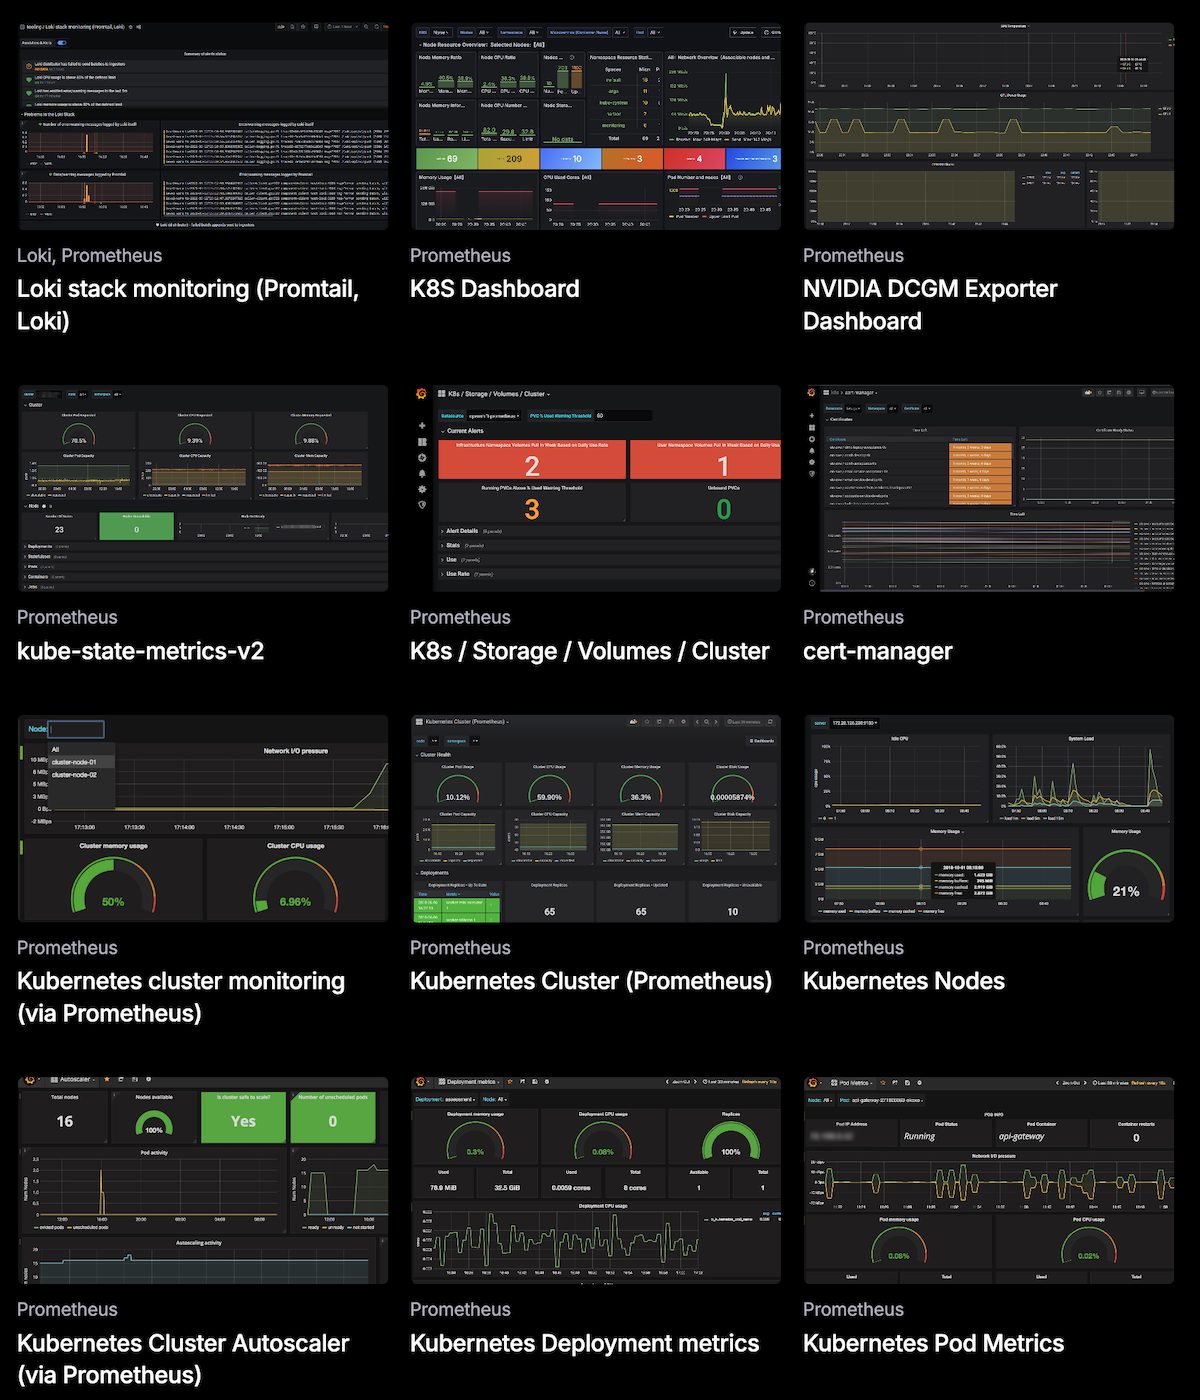
Prometheus + Grafana
Industry favorites, open source for Kubernetes metrics.
This should be inbuilt Kubernetes monitoring stack. As a CNCF project, Prometheus has become the industry standard for cloud native monitoring. Unlike traditional monitoring that waits for agents to push data, Prometheus uses a pull model.
I would suggest deploying the following stack:
- Prometheus to collects and stores time-series metrics.
- Alertmanager for grouping, and routing alerts.
- Grafana to visualizes the metrics data.
Key Features
- Because pods are ephemeral, they die and restart constantly. Prometheus automatically discovers new pods via the Kubernetes API.
- Define monitoring configurations as Kubernetes Custom Resource Definitions (CRDs) in YAML.
- PromQL to query time-series data.
- Pre-built Grafana dashboards for Kubernetes clusters or create one as needed.
Pros & Cons
PROS
CONS
Should you use this?
Use this stack if you want the open source, highly customizable solution and have the engineering resources to manage the infrastructure.
Caroot
Zero-instrumentation and eBPF-powered.
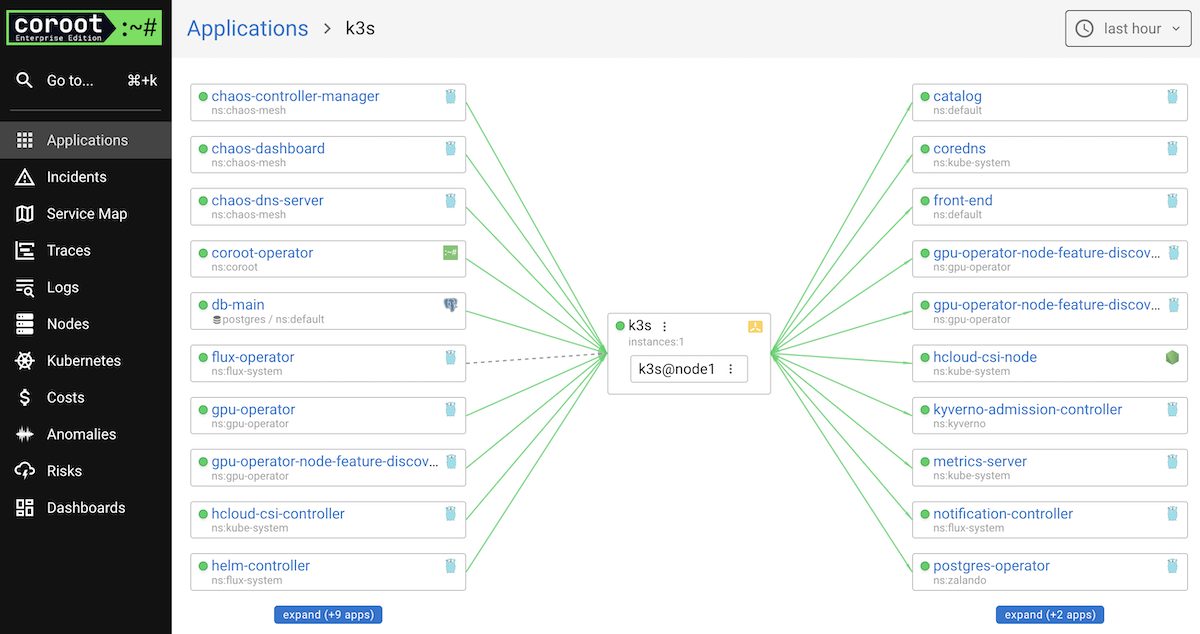
While Prometheus collects data, Coroot turns that data into actionable answers. It is an open-source observability tool for microservices running on Kubernetes.
Coroot distinguishes itself by using eBPF (Extended Berkeley Packet Filter). This allows it to listen to network traffic and system calls at the kernel level. It automatically builds a complete service map of your Kubernetes cluster without requiring you to add a single line of code.
Key Features
- It identifies every service and map them, showing you exactly who is talking to whom and where the latency lies.
- You don’t need to manually instrument your code to get Golden Signals.
- Track reliability based on user experience rather than just CPU usage.
Pros & Cons
PROS
CONS
When to use Caroot?
Use Caroot if you are running microservices in K8S and looking for self-hosted solution for quick service map visualization and event logs.
Pixie
Scriptable observability powered by eBPF.
While Prometheus tells you that CPU usage is high, Pixie allows you to inspect the actual code execution and requests to understand why.
Like Coroot, Pixie utilizes eBPF to automatically capture telemetry data. However, Pixie’s superpower is its scriptability. It allows developers to treat their Kubernetes cluster like a database, running scripts to debug specific problems in real-time.
You can use Pixie to profile DB queries, check health of K8s infra, trace requests, analyze canary, monitor Kafka, and continuous app profiling.
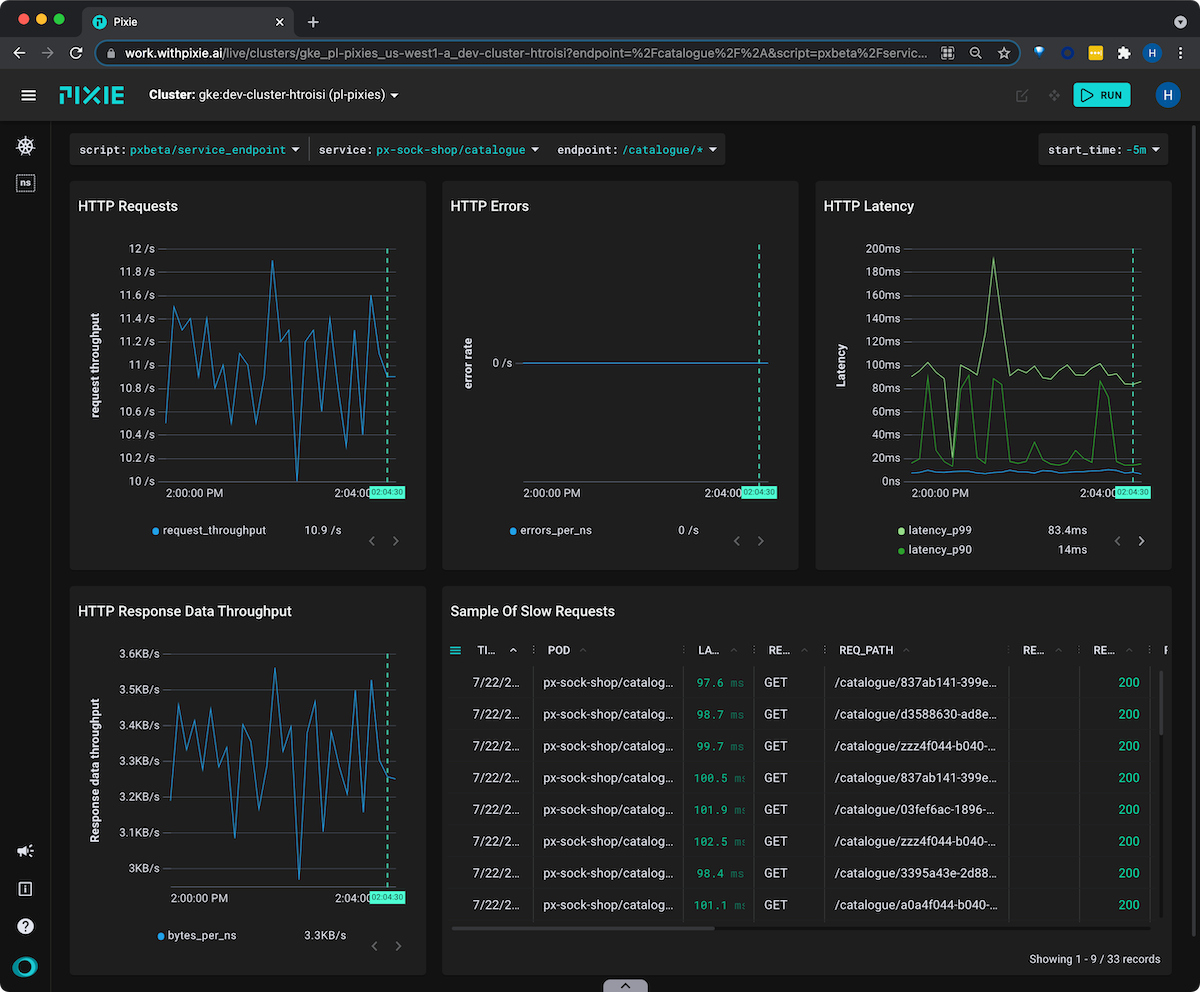
Key Features
- It recognizes and parses protocols like HTTP, gRPC, DNS, MySQL, Postgres, Redis, and Kafka.
- Pixie uses a Pythonic query language called PxL. This allows you to write custom scripts to query the metrics.
- Automatically collects CPU profiles for performance debugging.
- Works with GKE, EKS, Minikube and AKS.
Pros & Cons
PROS
CONS
When to use Pixie?
Use Pixie for debugging Kubernetes application performance. I would suggest using as companion to Prometheus.
VictoriaMetrics
Scalable Prometheus alternative for enterprise.
VictoriaMetrics is an open source monitoring solution for enterprise. It has over 1 billion Docker pulls, which shows the credibility.
When your Kubernetes clusters grow, standard Prometheus setup often become challenging with long-term storage. VictoriaMetrics Time Series Database (TSDB) is here to solve exactly that problem.
It is a drop-in replacement or a long-term storage backend for Prometheus. You can use PromQL but for greater compatibility, better to learn native MetricsQL.
Based on public reviews, I see many engineering teams switch to VictoriaMetrics when their Kubernetes metric volume becomes unstable for Prometheus to handle.
To manage monitoring stack deployment, you can use vmoperator. It works in Kubernetes and OpenShift clusters.
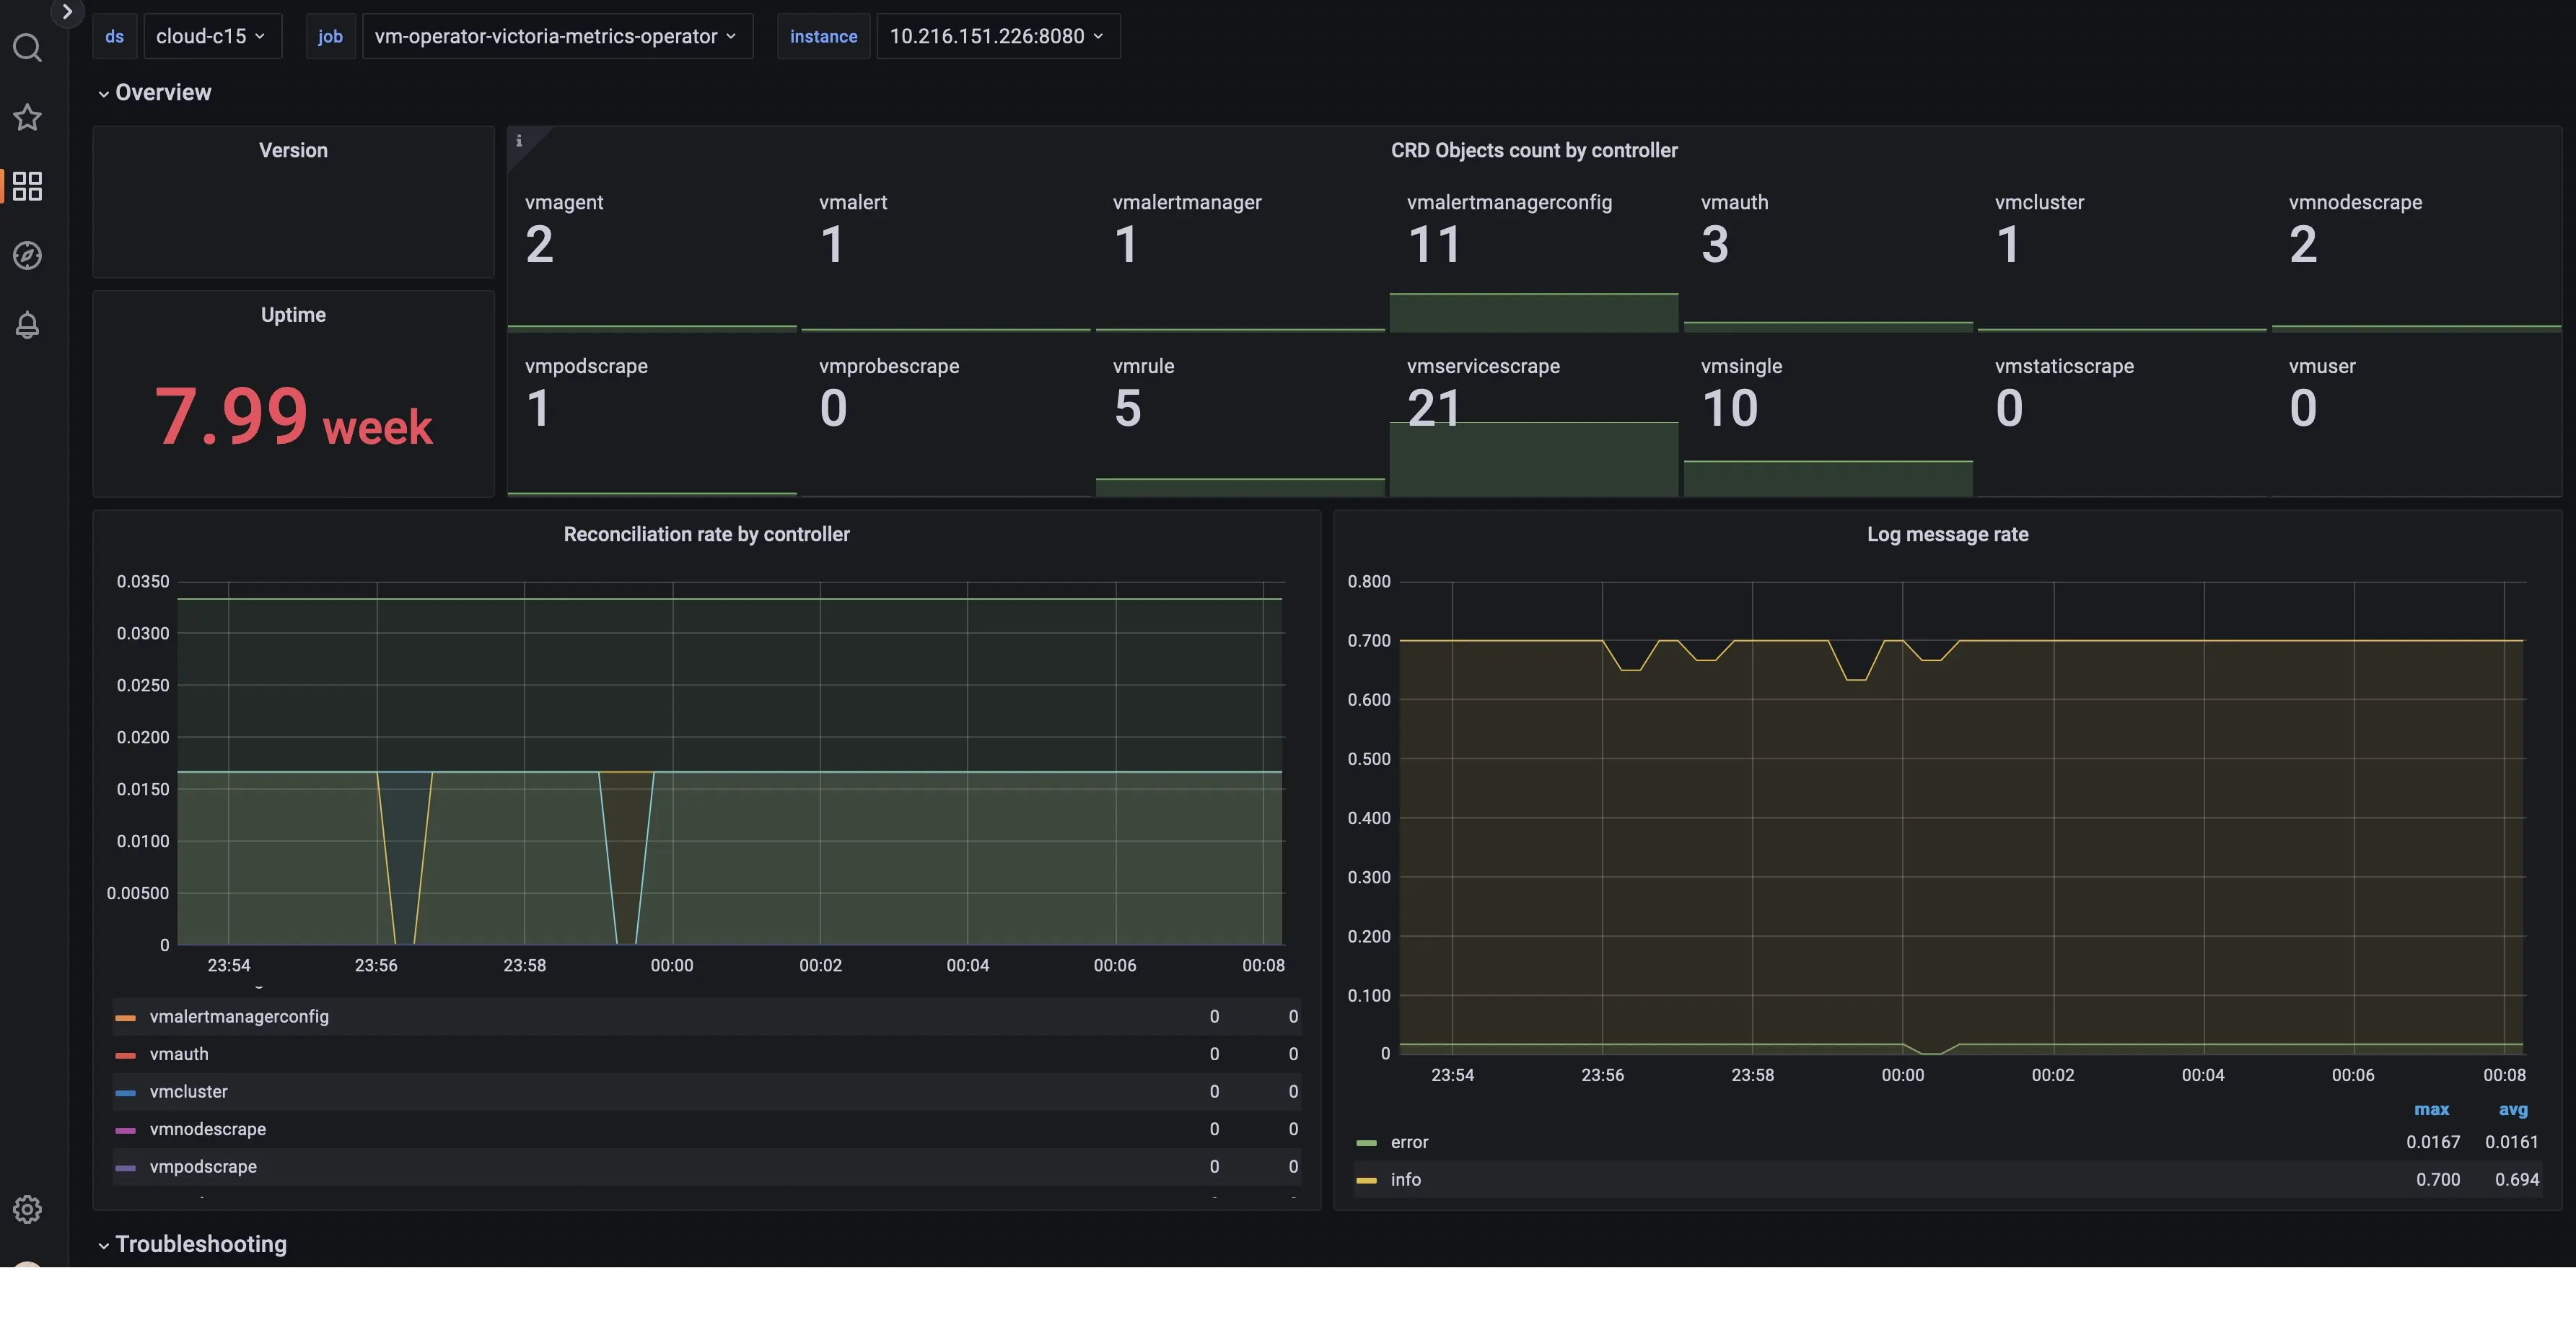
As you can notice above, it relies on Grafana for dashboard.
Thanos
Open-source long-term storage for Prometheus.
Prometheus struggles with two things: High Availability and long-term data retention. Thanos solves these limitations by extending your existing Prometheus setup rather than replacing it.
Thanos runs as a sidecar alongside your Prometheus. It intercepts data and uploads it to cheap object storage like AWS S3 or Google Cloud Storage.
Key Features
- Query metrics from multiple Prometheus servers and clusters.
- Offload storage to cloud object storage at cheap.
- Supports high-availability.
- Merge data from a replicate to ensure a continuous history.
Thanos consists of several components like Sidecar, Query, Compact, Stote Gateway, Query, Ruler which requires learning and DevOps expertise.
Sysdig
Enterprise Kubernetes monitoring solution.
Sysdig was founded by the creator of Wireshark. It is a commercial platform for Kubernetes and OpenShift that inspects the system at the kernel level. It takes the guesswork out of scaling by showing exactly how much capacity remains in your control plane and worker nodes.
Sysdig Advisor acts as an automated expert in your cluster. Instead of just alerting you that a pod is down, it provides a list of issues with remediation steps and logs so you can solve issues, faster.
It comes pre-configured with dashboards for Kubernetes and workloads. Sysdig has a partnership with Red Hat, making it arguably one of the best premium monitoring choice for OpenShift environments.
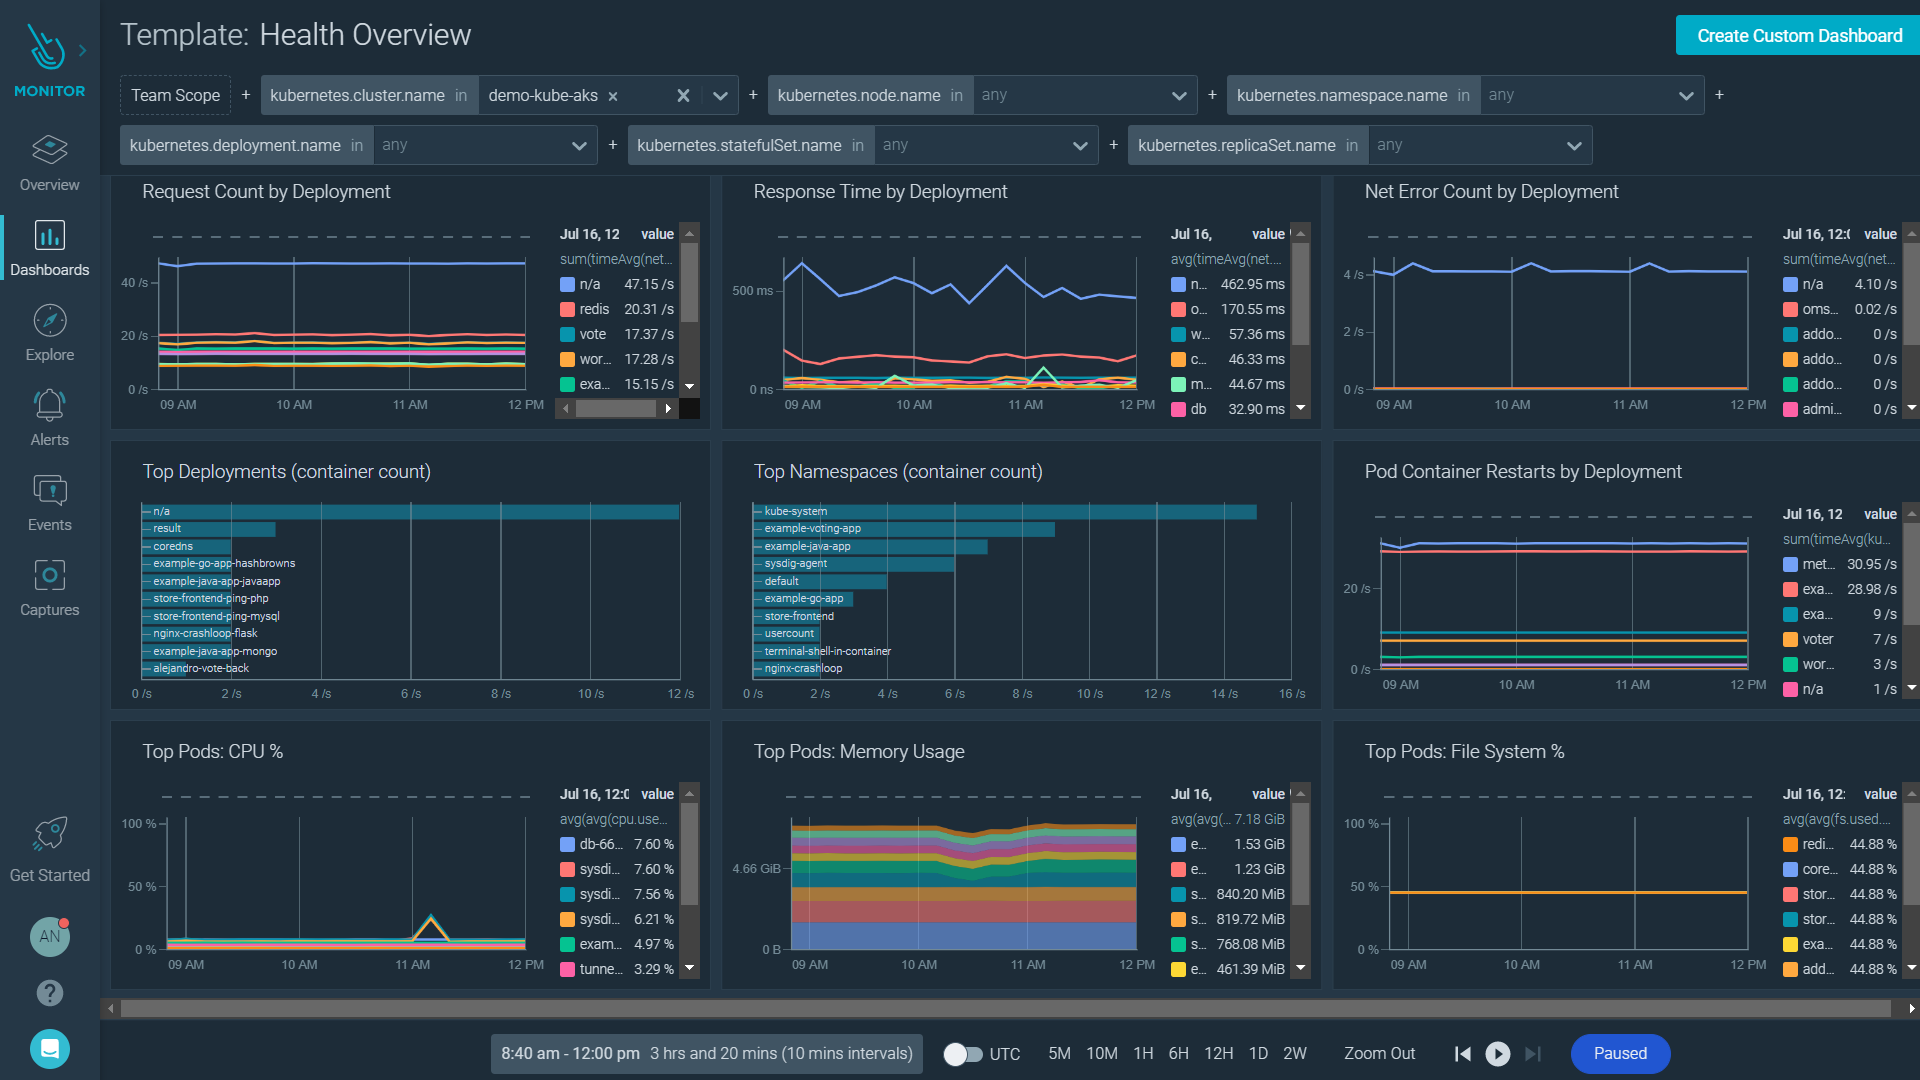
Since it captures a massive amount of monitoring data, it can be overwhelming for smaller teams. And, it can be expensive as well.
I would suggest Sysdig if you are an enterprise and want to combine security insights and monitoring into one platform.
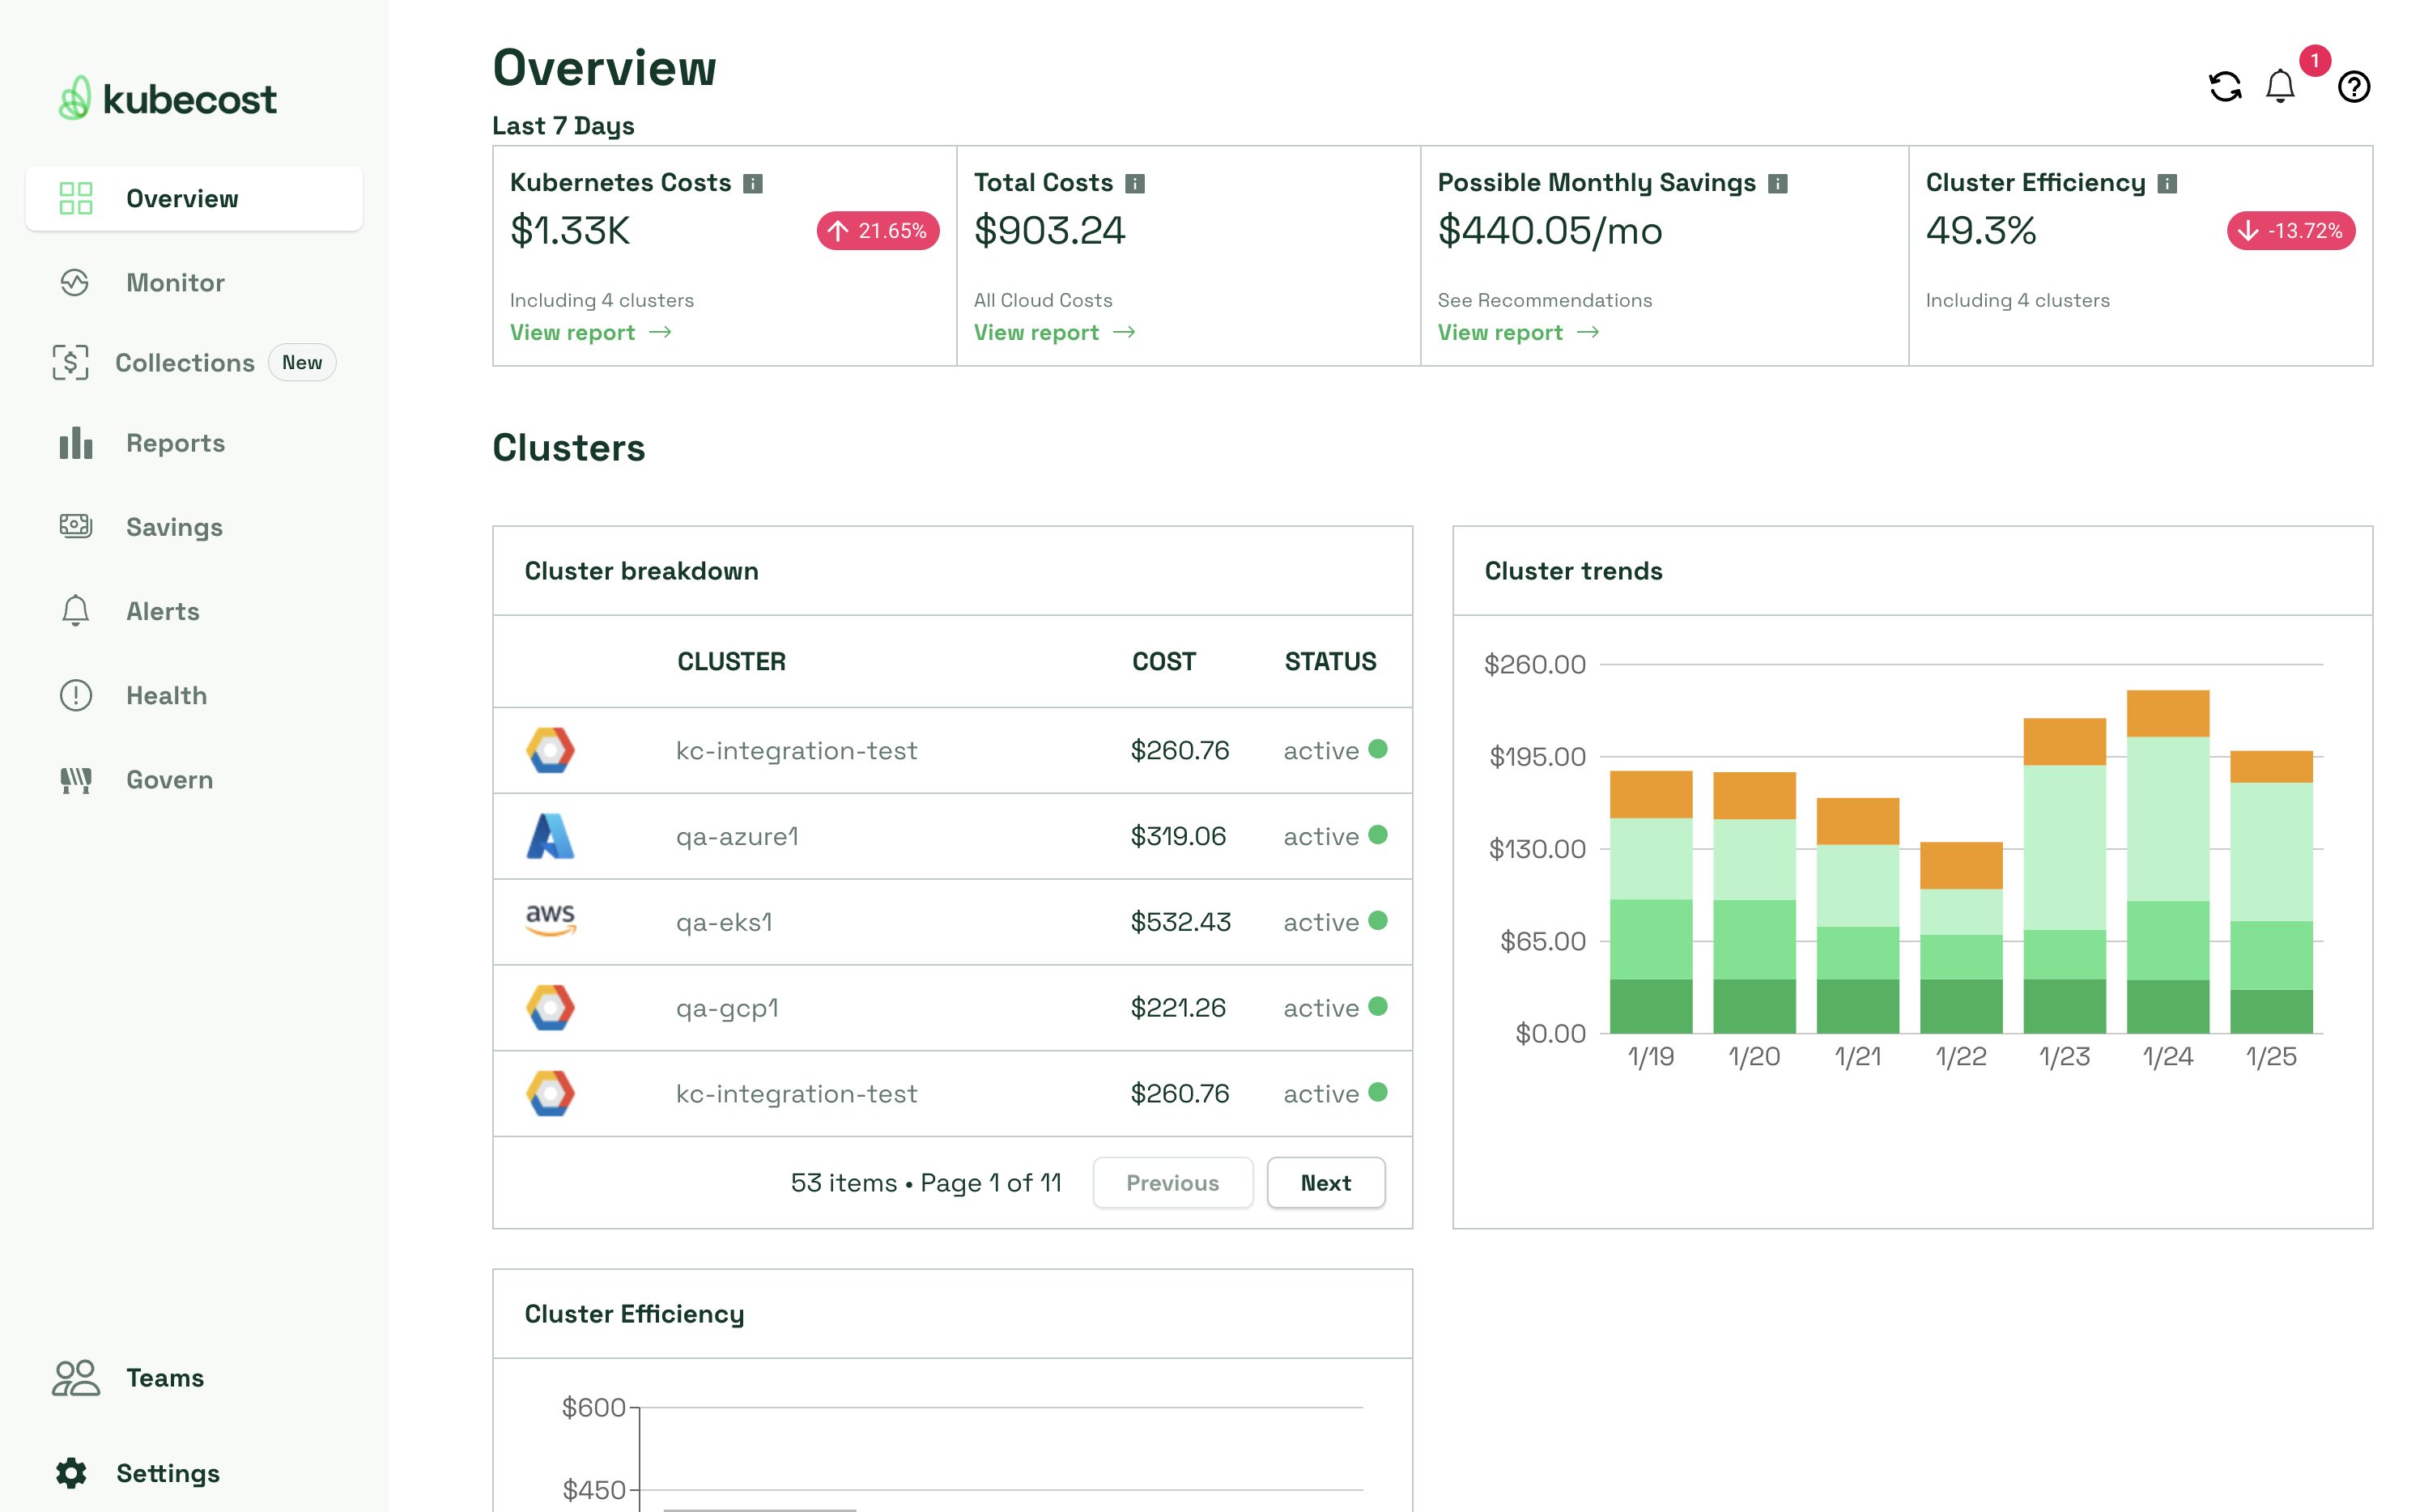
IBM Kubecost
Best for Kubernetes cost monitoring and FinOps.
Kubecost is recently acquired by IBM (via the Apptio acquisition).
You get a single invoice from AWS or Google Cloud, but you have no idea which team or microservice drove up the cost. Kubecost solves this by tapping into your Kubernetes API and billing data to break down costs in real-time.
Kubecost breaks down your cluster costs by Namespace, Deployment, Service, Label, or Pod. It analyzes your historical usage patterns and recommends specific changes to your resources to save money.
You can set real-time thresholds to alert on usage cost. Ex, you can configure to alert me when LLM Inference namespace burns more than $100/day.
You must note – this is cost monitoring tool rather infra. And, if you need an alternative open source tool for K8S cost monitoring, try OpenCost.
Other K8S Monitoring Software
Lens
Cilium
LogicMonitor
Calico
Jaeger
Conclusion
Kubernetes monitoring is more critical than ever with the increasing complexity of cloud applications. The tools highlighted in this article offer a range of features from real-time metrics and log aggregation to security and resource optimization.
By leveraging these tools, organizations can ensure their Kubernetes environments are secure and scalable for success in the rapidly evolving IT landscape.