Server monitoring tools are essential for ensuring optimal performance and getting notified when things go wrong.
Inbuilt commands like top, free, netstat, df, etc. gives you basic metrics and good for on-demand checks. What you need is real-time visibility into critical resources like CPU usage, memory utilization, disk I/O, and network traffic with historical records and alerting systems.
Not having adequate monitoring strategies often leads to blind spots. This can result in performance bottlenecks caused by memory leaks, unexpected outages, or security vulnerabilities that expose sensitive data.
To make it easy to pick for you, we have researched and made this list of server monitoring tools based on easy to set up, real-time alerting, scalability, integration, and cost-effectiveness.
Tools for SMBs & Startups
As an SMB, you need a tool that is easy to deploy, cost-effective and provide ready-made dashboards.
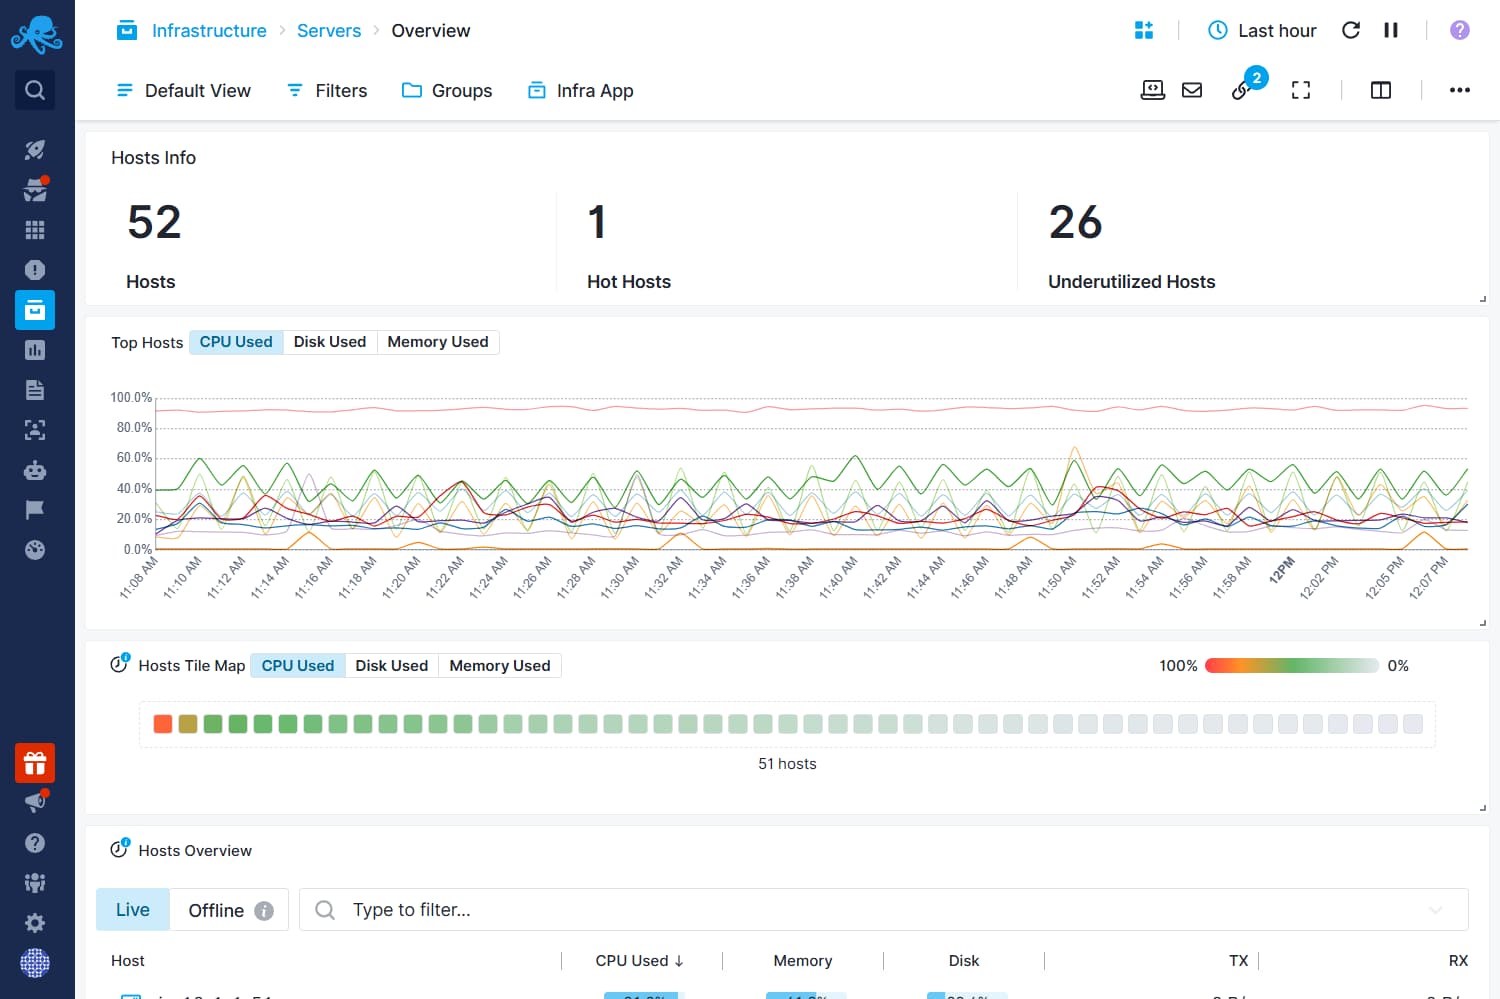
New Relic
Best to monitor cloud servers with application performance.
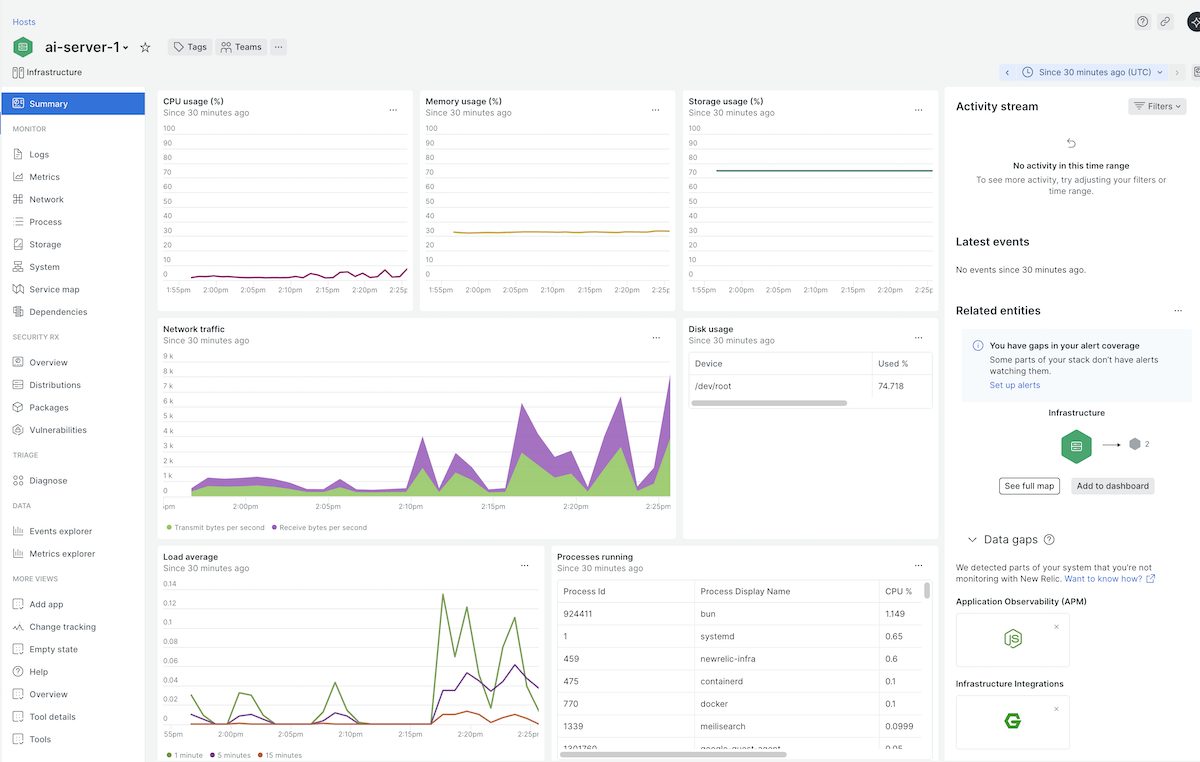
While New Relic is famous for Application Performance Monitoring (APM), its Infrastructure Monitoring capabilities are equally robust. You can drill down into performance of individual hosts and containers.
New Relic monitoring is agent-based, means, you need to install their newrelic-infra monitoring agent on your server to start monitoring. Once agent is installed, you get all the essential metrics like:
- Usage – CPU, Memory, Storage
- Runnnig processes
- Load average
- Network traffic
- Related entities – discovered containers or processes
It creates service map automatically which is great for troubleshooting issues and visualizing infrastructure.
You can configure alerting for individual or group of metrics to get notified on Slack, email, ServiceNow, PagerDuty, Mobile push, AWS EventBridge, Microsoft Teams, Jira, etc.
Key Features
- Monitor on-premises servers, cloud VMS like AWS EC2, GCP Compute, Azure VM, containers.
- Observability for popular applications like Apache, NGINX, MySQL, Redis, PHP, Node.js, and Kafka without lengthy configuration.
- Automatically tracks the four golden signals of server health – Latency, Traffic, Errors, and Saturation.
- Correlates server performance drops with recent configuration changes or deployments to identify root causes.
Pros & Cons
PROS
CONS
New Relic Pricing
New Relic pricing is based on usage.
Free: Includes 100 GB of free data ingest per month and 1 full-platform user.
Standard & Pro: Based on the amount of data ingested beyond the free limit and the number of full-platform users.
I picked up New Relic for quick deployment and one of the best free plans with 100 GB/month data ingestion. If you are having less than 10 servers and don’t intend to send application logs, free plan should be sufficient for you.
Paessler PRTG
Best for SMBs preferring a Windows-based monitoring suite.
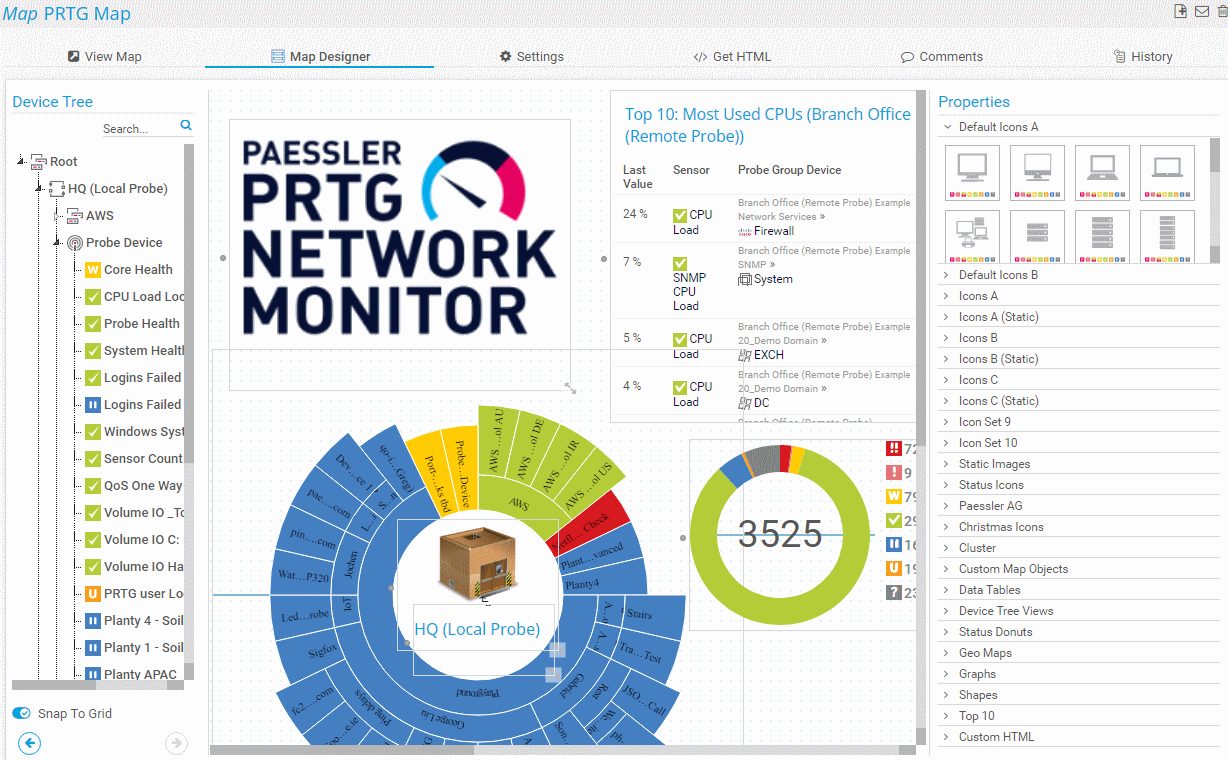
Paessler PRTG monitor many types of servers and relies on agentless monitoring techniques like SNMP, WMI, HTTP, Ping, and SSH to track server health.
One of PRTG’s strongest points is its flexibility in deployment. You can download to host on-premises on Windows servers or choose cloud-based implementation PRTG Hosted Monitor. Hosting on-premises make sense if you need total control over data.
PRTG goes beyond basic CPU and RAM metrics. It is good at physical hardware monitoring like Dell, HP, IBM, and Cisco to track fan speeds, temperature, power supply status, and disk health, helping to prevent physical failures before they occur.
Key Features
- Monitors critical environmental factors like chassis temperature, fan RPM, and voltage on physical servers via SNMP and IPMI.
- Preconfigured sensors for specific server types like Windows IIS, Linux, Exchange, SQL, and Virtualization hosts like VMware/Hyper-V.
- Drag-and-drop map editor to visualize server racks and status lights.
- Create a failover cluster to keep monitoring up even if the primary server goes down.
Monitor pretty much everything!
Pros & Cons
PROS
CONS
Don’t get confused about sensor. One sensor is not equal to one server. Sensor is a monitoring element and one monitored value counts to one sensor. You can estimate to consume 10 sensors per server, but this can go up or down depending on number of metrics you want to monitor.
PRTG Pricing
PRTG offers pricing based on the number of sensors.
Free: Free for up to 100 sensors.
PRTG Network Monitor (On-Prem): Starts $179/mo for 500 sensors.
PRTG Hosted Monitor (Cloud): Starts $179/mo for 500 sensors.
I picked PRTG for flexibility in deployment and extensive prebuilt sensors to satisfy the majority of the infra monitoring needs.
ManageEngine OpManager
Best for enterprise teams needing server and network management.
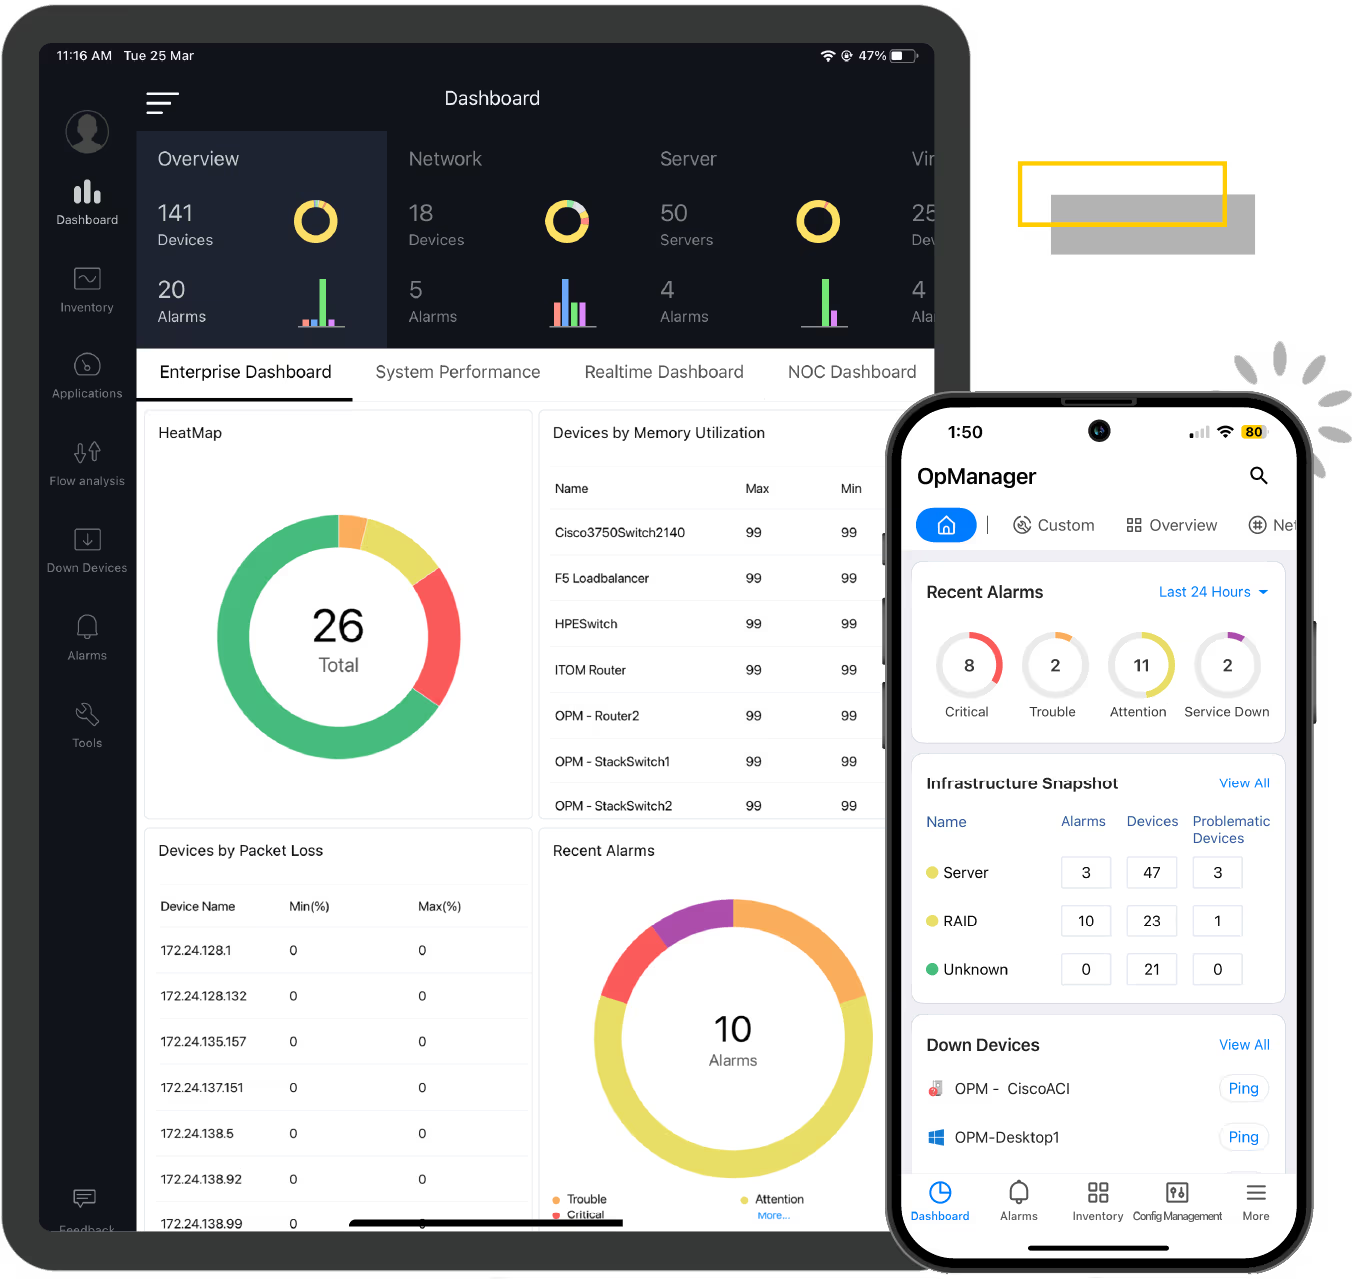
ManageEngine OpManager is an ideal choice for businesses seeking a single tool to monitor servers and networks, both. You can monitor routers, wireless LAN controllers, servers, load balancers, storage devices, firewalls, printers, switches and more.
OpManager uses standard protocols like SNMP, WMI, and CLI to monitor servers across multiple vendors Dell, HP, Cisco and operating systems Windows, Linux. It dives deep into virtualization monitoring for VMware, Hyper-V, and Citrix XenServer. This allows you to track host resource allocation and identify zombie VMs that are draining resources. Useful when you have fleet of servers.
If you’re managing physical servers, OpManager also monitors hardware health metrics, such as temperature, fan speed, and power supply status.
Key Features
- Prebuilt dashboards for VMware and Hyper-V that track CPU/Memory allocation, datastore usage, and VM sprawl.
- Monitors Windows services and background processes with the ability to auto-restart stopped services via scripts.
- Color-coded alarms and automated workflows to reduce manual intervention.
Pros & Cons
PROS
CONS
OpManager Pricing
ManageEngine follows a device-based licensing model.
Free: Monitors up to 3 devices for free.
Standard: Starts $95 for 10 devices.
Professional: Starts $145 for 10 devices.
How about Site24x7?
ManageEngine has another product called Site24x7 which is good for small businesses and startups. I would suggest Site24x7 if you have small number of servers and on a budget. You can monitor 2 servers for $9/month.
Sematext
Best full-stack observability for smaller teams.
Sematext is a cloud-based monitoring solution which provides real-time Linux monitoring. With Sematext, you can monitor Linux metrics, events, and logs, which leads to minimal downtime, predictable resource usage, and effective scalability on loads.
Sematext agent is lightweight and uses 1-2% of single CPU core. It collects OS metrics, processes, disks, system load and network traffic.
Key Features
- Enriched Logs help find issues better and make troubleshooting easy.
- Set up and get notified for threshold alters, anomaly detection, metrics, and operating system metrics via PagerDuty, Slack, custom webhooks, email, etc.
- Get access to a pre-built dashboard. You can add/remove components, add new report pages, and combine logs and metrics.
- Monitor container workloads in Docker, Kubernetes, Rancher, Portainer.
Sematext Infra Pricing
Server monitoring is part of Infrastructure subscription which starts at $2.8/host/month.
You can start 14-day free trial without a credit card.
I picked Sematext because it gives flexibility to monitor entire infra, apps, digital experience and logs on a single platform while paying for what you use.
Other options for SMBs
Middleware
Checkmk
Enterprise Solutions
These enterprise-grade tools offer advanced automation, AI capabilities, and support.
Datadog
Full-stack observability platform for hybrid and DevOps.
Datadog is an all-in-one observability platform. It helps you collect, monitor and correlate server metrics on the cloud or physical servers. It measures and optimizes server performance by monitoring CPU, identifying underutilized machines, improving app performance using trends and optimizing overprovisioned resources.
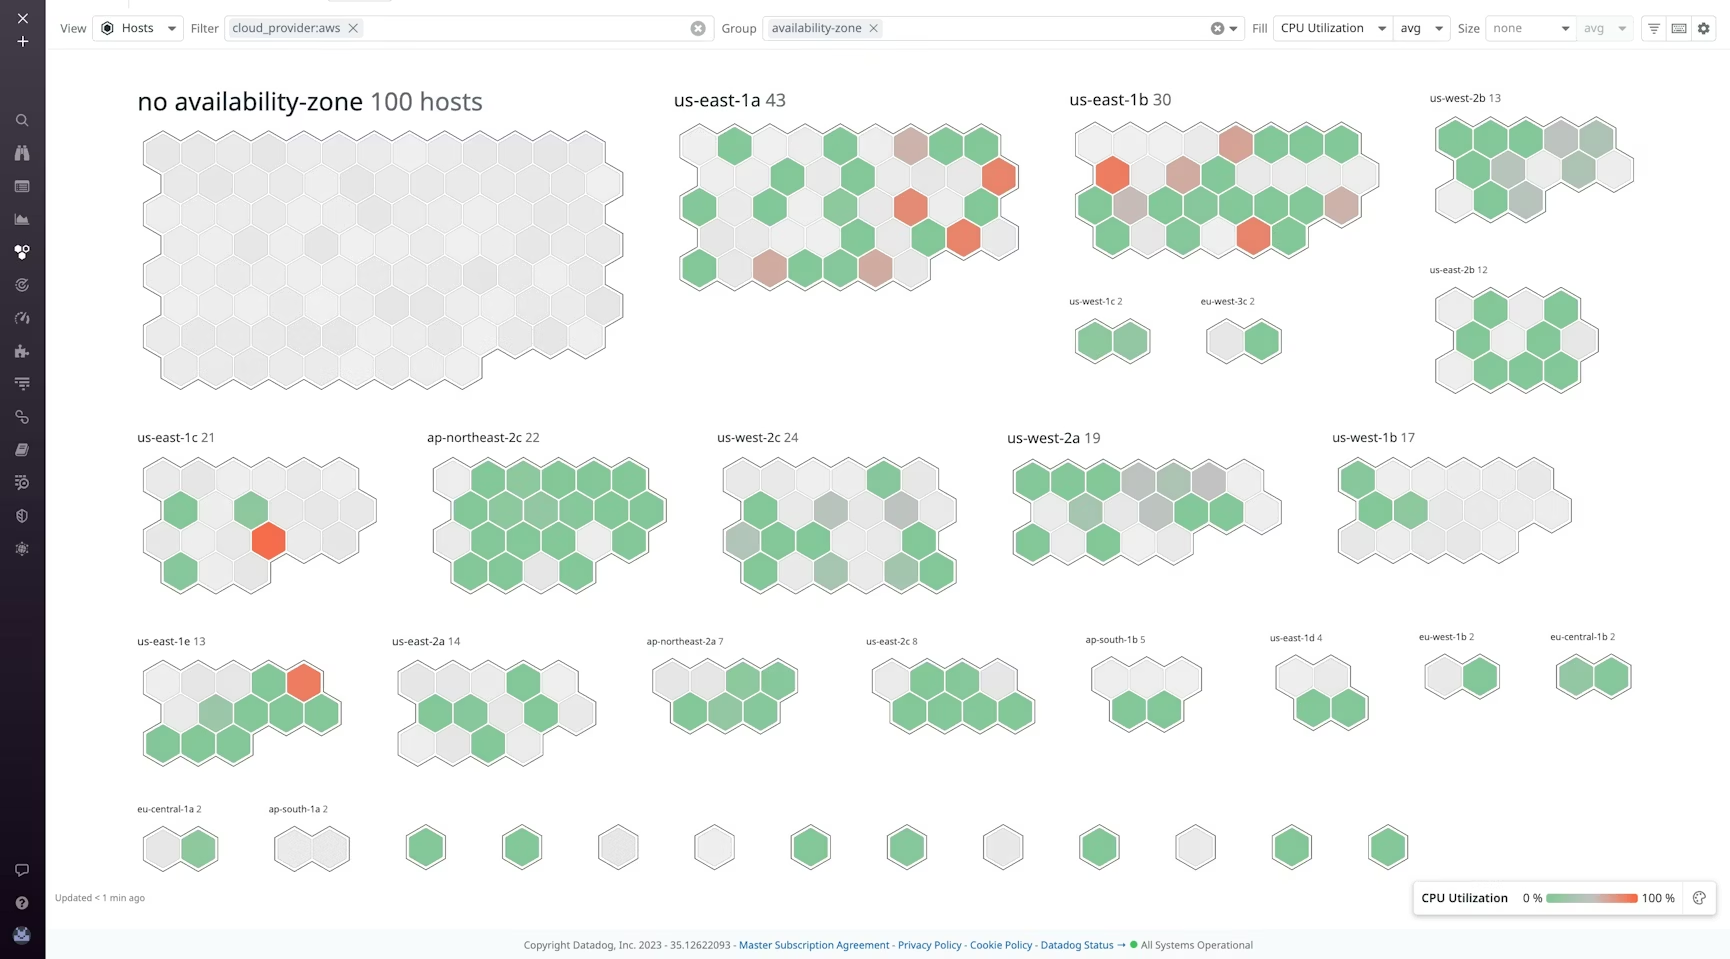
For infrastructure, Datadog provides Host Map – a bird’s-eye view that visualizes your thousands of hosts as hexagonal cells. This allows you to spot a single problematic server in a cluster of hundreds instantly by color alone. It covers everything from bare-metal legacy servers to serverless functions.
Datadog provides real-time server status, ensuring that the application runs smoothly. It can look for high latency and its causes, such as overloaded hosts, by monitoring both application data and server metrics.
Key Features
- Group hosts by tags like availability zone or team.
- Metrics with 15-second granularity to catch brief CPU spikes that other tools miss.
- Watchdog AI learns your infrastructure’s behavior and proactively alerts you to anomalies.
Pros & Cons
PROS
CONS
Datadog Infra Pricing
Free – monitor up to 5 hosts
Pro – starts $15/mo/host
Enterprise – $23/mo.host
For enterprise running critical business apps, I would suggest Enterprise plan which offers governance console, AI-based alerting and dedicated support.
SolarWinds SAM
Best for large enterprises with complex hybrid environments.
If Datadog is the choice for modern DevOps teams, SolarWinds SAM is the gold standard for traditional sysadmins. It does heavy lifting in large corporate environments where you need to monitor hundreds of physical servers alongside cloud instances in GCP, Azure or AWS.
It has a massive library of pre-built monitoring templates and if needed, you can creaet a new one. SolarWinds SAM is self-hosted observability solution and you can monitor almost everything in your infrastrucutre, like:
- Hardware, VMs, Hardware
- Active Directory, Domain Controller, Exchange Server, IIS, SharePoint, Office 365
- Files, RabbitMQ, Tomcat, Web servers
Specific to server monitoring, some of the features are:
- Historical trends for capacity planning.
- Real-time process explorer to get detailed statistics.
- Manage processes like stop services or reboot servers.
- Visualize server and application relationship.
Since it does auto discovery, you can also use as inventory management and IT assets tracking. This could be another reasons to consider.
Pros & Cons
PROS
CONS
SolarWinds SAM Pricing
SolarWinds SAM subscription starts at $2900 for on-premises deployment.
Dynatrace
Automatic discovery and mapping of the entire stack with OneAgent.
Dynatrace is built on the philosophy of automation first. It is recommended for large infrastructure where manually setting up monitoring is impossible.
The magic behind this automation is OneAgent.
Unlike other tools like New Relic, where you need separate agents for PHP, Python, Java, and the .NET, Dynatrace’s OneAgent is a single binary installation. Once installed on a host, it automatically discovers the running stack from the physical hardware up to the virtualization layer, container platform, and the applications.
Dynatrace’s AI engine, Davis, continuously analyzes dependencies and give you exact reason why something is abnormal.
Key Features
- Automatically detects and instruments new containers and processes as they spin up with OneAgent.
- Pinpoint the precise root cause of an issue.
- See exactly which process is consuming resources and network metrics.
- It analyzes the quality of network between processes and hosts to spot if a server issue is due to network latency or packet loss.
Pros & Cons
PROS
CONS
Dynatrace Pricing
Infrastructure Monitoring: Starts at $29 per month per host.
Full-Stack Monitoring: Starts at $58 per month per host.
Other options for Enterprises
LogicMonitor
WhatsUp Gold
Open-Source Tools
If you require complete control over your data or zero licensing costs, open-source is the way to go. These tools are powerful but require sysadmin skills to setup and maintain.
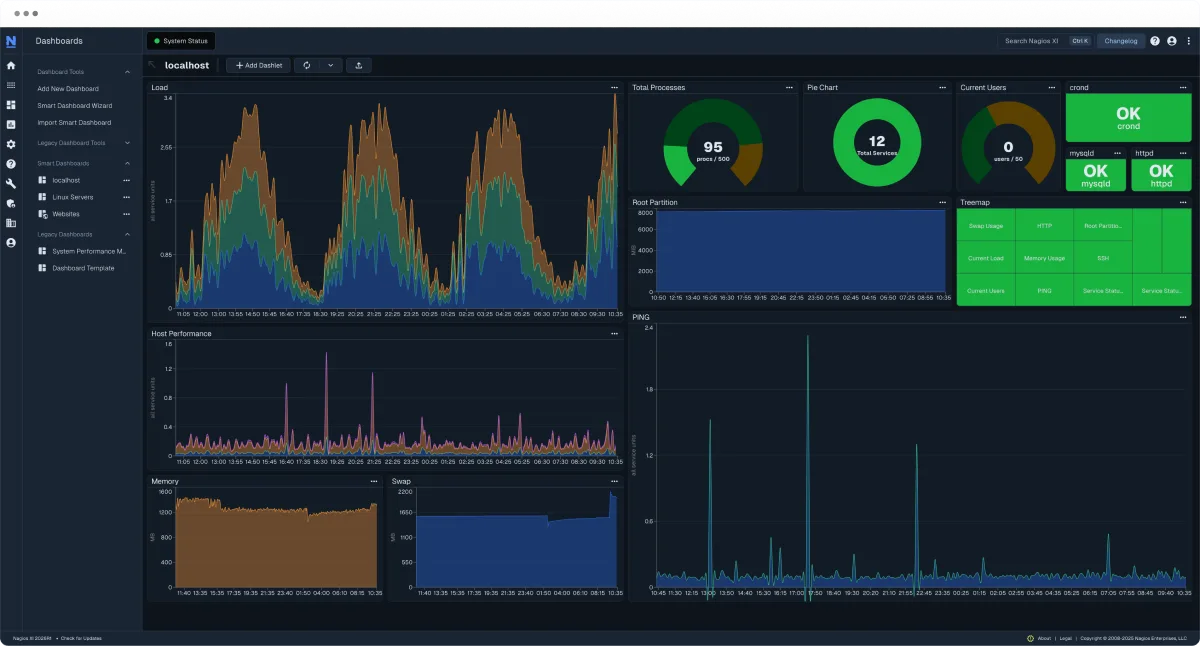
Nagios Core
Best for compliance requirement and budget friendly.
Nagios Core is the big daddy of server monitoring. Despite the rise of modern tool, Nagios remains a staple in the industry for two main reasons: Cost and Control.
If your organization has strict compliance or regulatory requirements such as HIPAA, GDPR, or financial regulations that prevent you from sending server data to a cloud provider, Nagios is the answer.
It is completely self-hosted, meaning your infrastructure data never leaves your internal network. You have 100% ownership of your monitoring logs. It lacks the modern UI like New Relic but compensate that with flexibility and data contorl.
Do It Yourself nature makes it the ultimate tool for sysadmins who want to build a monitoring solution tailored to their specific needs without spending on licensing.
Pros & Cons
PROS
CONS
I picked Nagios because it gives complete control on data which can be crucial for compliance and regulatory requirement. Another reason is its free and gives essential monitoring with alerting.
Note: Nagios Core is free but they also offer a paid commercial called Nagios XI which has better UI and support.
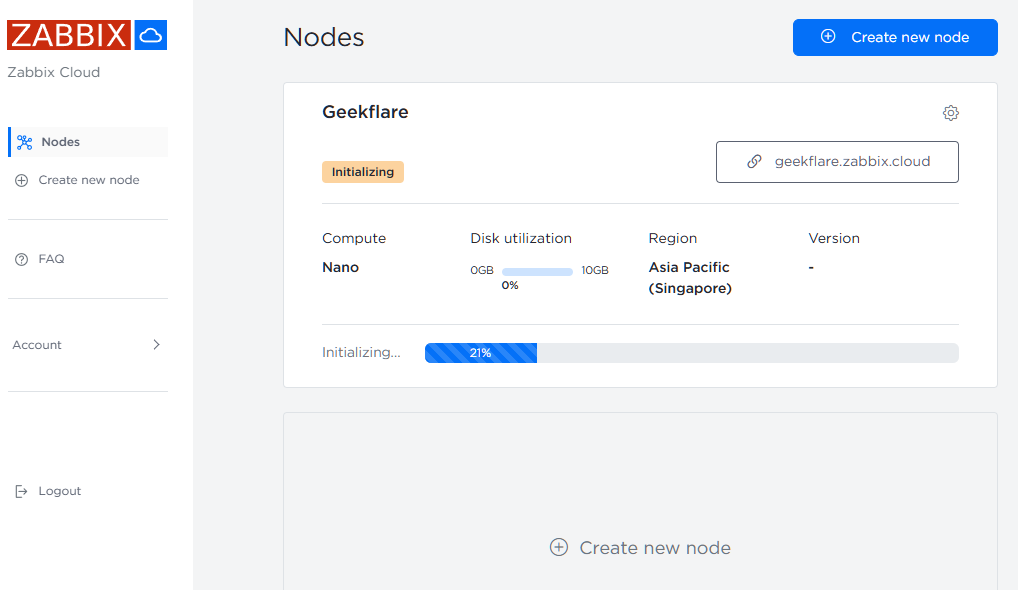
Zabbix
Better UI than Nagios Core.
If Nagios Core UI doesn’t please you, go for Zabbix. It is an open source and there are no limits on the number of servers or data retention as you need to host on your on-premises and everything depends on your server capacity.
It uses a lightweight agent to pull OS metrics from Linux and Windows servers. However, it also offer agentless monitoring via SNMP.
For global organizations, Zabbix supports Distributed Monitoring via Zabbix Proxies. This lets you monitor servers in different data centers while centralizing all the data into one main dashboard.
If you don’t like to manage Zabbix monitoring servers yourself, you can try Zabbix Cloud which is fully-managed SaaS offering.
Pros & Cons
PROS
CONS
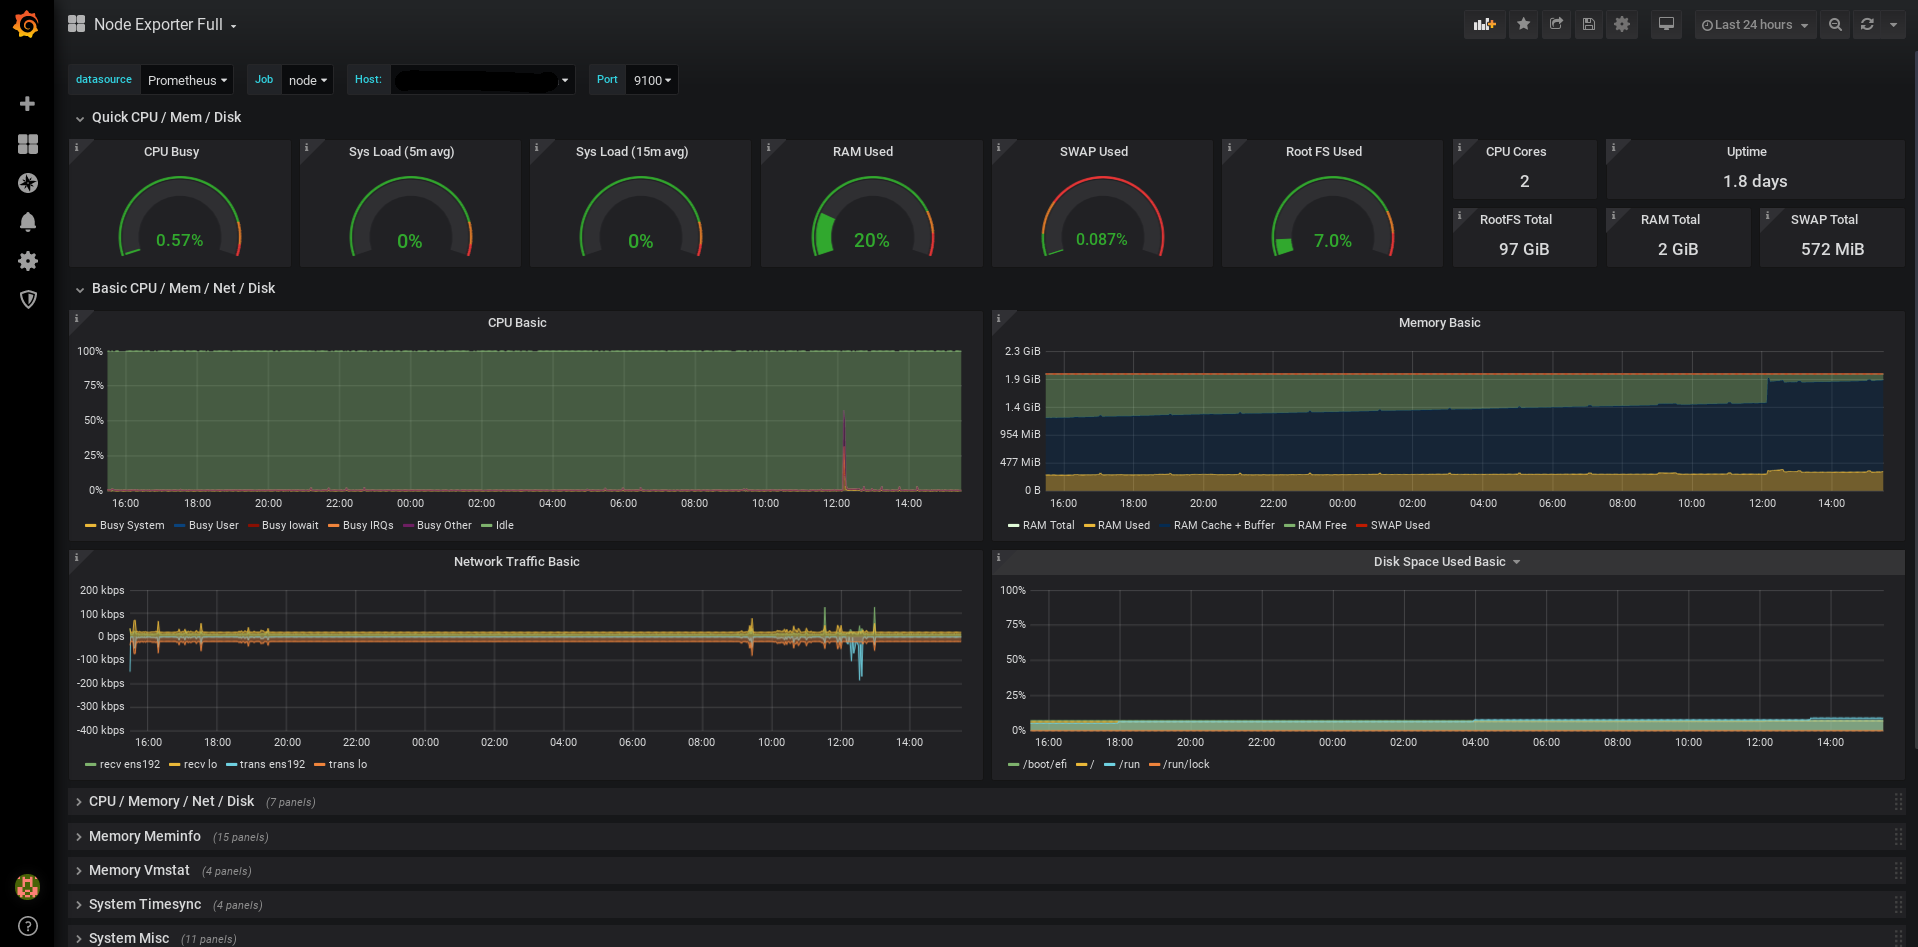
Prometheus + Grafana
Best for time-series data and visualization.
Technically, both are two separate tools but Prometheus and Grafana are almost used together. This stack is very popular among DevOps teams to monitor containerized and VMs environment.
Prometheus is a time-series database that collects metrics, while Grafana is the visualization platform that turns those metrics into insightful dashboards.
For Linxu server monitoring, you need node_exporter and windows_exporter for Windows servers. It is lightweight process which you need to install on server you wish to monitor. It collects hardware and OS metrics lik CPU usage, memory availability, disk I/O, network statistics.
Once Prometheus steup is done, you can connect the time-series database to Grafana to visualize the data. You can use community dashboard template or create one from scratch to add the metrics you need to monitor.
Pros & Cons
PROS
CONS
Other Open Souce Tools
Netdata
Glances
Uptime Kuma
Cockpit
Icinga
Why we didn’t include NinjaOne and Auvik?
If you are browsing other “Best Monitoring Tools” lists, you might have noticed NinjaOne and Auvik mentinoed. We chose not to include them in this list of Server Monitoring Software.
Here is why:
- NinjaOne is primarily endpoint management (RMM) tool for MSPs and larger organizations to manage employees desktop and laptops.
- Auvik is primarily network monitoring software to visualize network topology and manage network devices.
FAQs
Agent-based involves installing a binary/process on the server you want to monitor. This usually provides deeper insights.
Agentless monitoring communicates with the server using standard protocols like SNMP, WMI, or SSH without installing software. It is easier to deploy but may offer less metrics than an agent.
Every system administrator should alert on the “Four Golden Signals” of server health:
1. CPU Usage
2. Memory
3. Disk Space
4. Network Traffic
5. Hardware Health
Yes, tools like Zabbix and Prometheus are used by many large organizations.