A user-friendly interface and seamless features are what attract users to your app, but frequent errors are what drive them away. Even tech giants like Google, Microsoft, and Salesforce encounter bugs; the difference lies in how quickly they detect and resolve them.
Unfortunately, many SaaS companies overlook the importance of frontend error monitoring. They view it as an unnecessary expense, failing to realize the long-term cost of churn.
The stakes are higher than you think. According to PwC, 32% of customers will walk away from a brand they love after just one bad experience. – PWC
Don’t leave your revenue to chance. To help you protect your user experience, I’ve curated a list of the best frontend monitoring tools for your SaaS, website, or mobile app.
Top Frontend Monitoring Tools Comparison
| Tool | Free Plan | Self-Hosted | AI Features | Starting Price (mo)* |
|---|---|---|---|---|
| Sentry | ✅ | ✅ | ✅ | $40 |
| LogRocket | ✅ | ✅ (paid) | ✅ | $69 |
| Raygun | ❌ | ❌ | ✅ | $40 |
| Zipy | ✅ | ❌ | ✅ | $39 |
| FullStory | ✅ | ❌ | ✅ | Custom Quote |
| AppSignal | ❌ | ❌ | ✅ | $23 |
| TrackJS | ✅ | ❌ | ✅ | $49 |
| PostHog | ✅ | ✅ | ✅ | Custom / Usage |
| Rollbar | ✅ | ✅ | ✅ | $15.83 |
| Insight Hub | ✅ | ❌ | ✅ | $20 |
| Airbrake | ✅ | ✅ | ✅ | $17 |
| Noibu | ❌ | ✅ | ✅ | Custom Quote |
Below, I review the top frontend monitoring solutions in detail, covering their strengths, weaknesses, deployment methods, and pricing to help you pick the right tool for your web applications.
1. Sentry
Used by 4 Million Developers
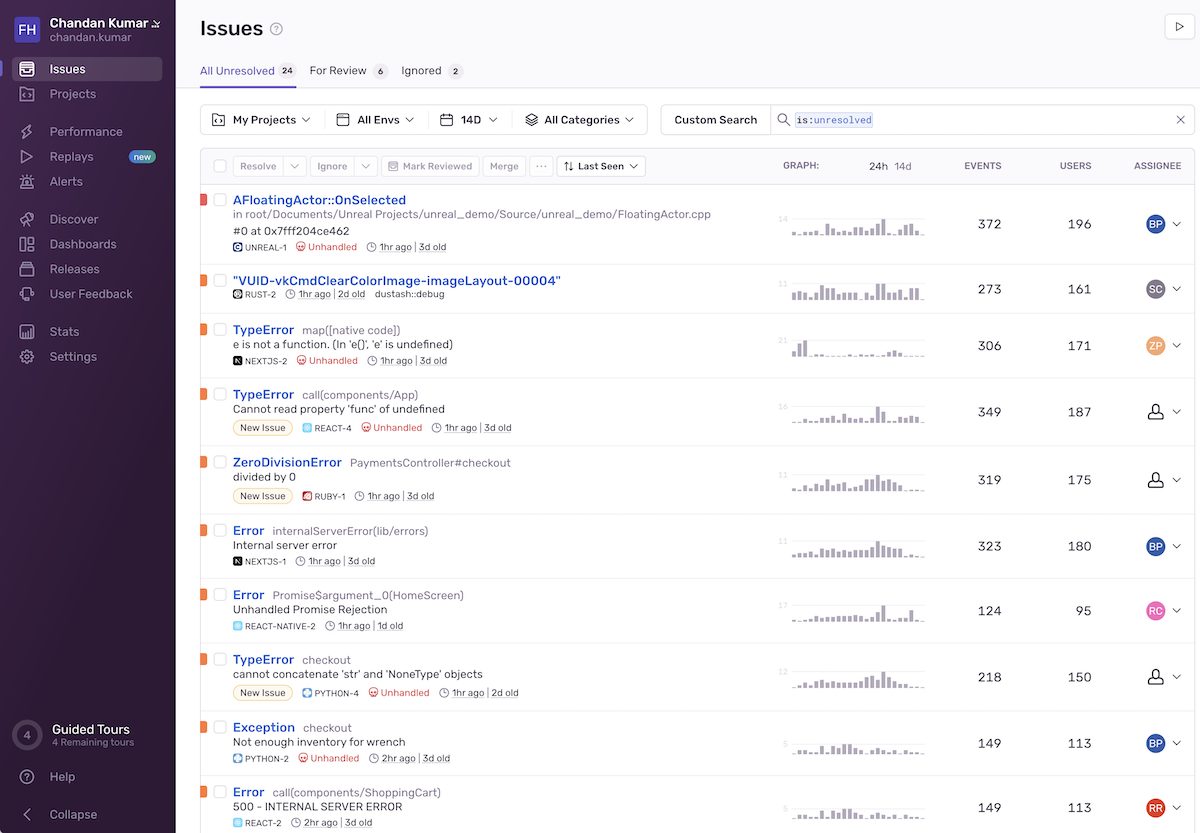
Sentry is a pioneer in application monitoring and a “go-to” choice for developers worldwide. While it started as an error logging tool, it has evolved into a comprehensive platform that bridges the gap between code health and user experience.
Sentry Key Features
- Error Monitoring: This is Sentry’s bread and butter. It tracks frontend errors in real-time, offering deep insights on how to resolve them. You can measure user impact, spot trends, and prioritize bugs based on how many users are affected.
- Session Replay: Debugging is faster when you can see exactly what the user saw. Sentry captures user sessions to help you identify unresponsive clicks, hydration errors, and UI glitches.
- End-to-End Tracing: Troubleshooting distributed systems is difficult, but Sentry simplifies it. You can track requests across your entire stack to identify exactly where an error occurred, visualizing dependencies in a clear timeline.
- Performance Profiling: As your app scales, speed matters. Sentry profiles your code to help you optimize resources, uncover performance bottlenecks, and identify slow database queries.
- Availability Monitoring: You don’t need a separate uptime tool. Sentry monitors your critical endpoints and pages to detect downtime immediately.
- Cron Job Monitoring: A unique feature that allows you to monitor scheduled tasks, alerting you immediately if a cron job fails or disappears.
Sentry Integration
Languages: Python, JavaScript, Java, PHP, Go, Ruby, .NET, Elixir, and more.
Frameworks: NextJS, React Native, Laravel, Flutter, Android, Cocoa, Unity, Unreal Engine.
Integrations: Connects seamlessly with Jira, Slack, GitHub, Datadog, Supabase, and 50+ others.
Who Uses Sentry?
More than 100,000 organizations use Sentry globally. Some popular companies using Sentry are Airtable, Disney, GitHub, monday.com, Miro, Autodesk, Cloudflare, and Cisco Meraki.
Sentry Pricing
Developer, you can start for FREE, which allows you 5000 error monitoring/month.
Team is $26/month, this is suitable for startups and micro business.
Business is $80/month, this is suitable for business with multiple teams.
Sentry Ratings
- G2 – 4.5/5 (110+ reviews)
- TrustRadius – 8.9/10 (50+ reviews)
When Not to Use Sentry
While Sentry is powerful, it isn’t a “one-size-fits-all” tool. I wouldn’t recommend it if your sole requirement is Session Replay or Cron Monitoring. Dedicated tools often handle those specific niches with more depth (like Hotjar for replays).
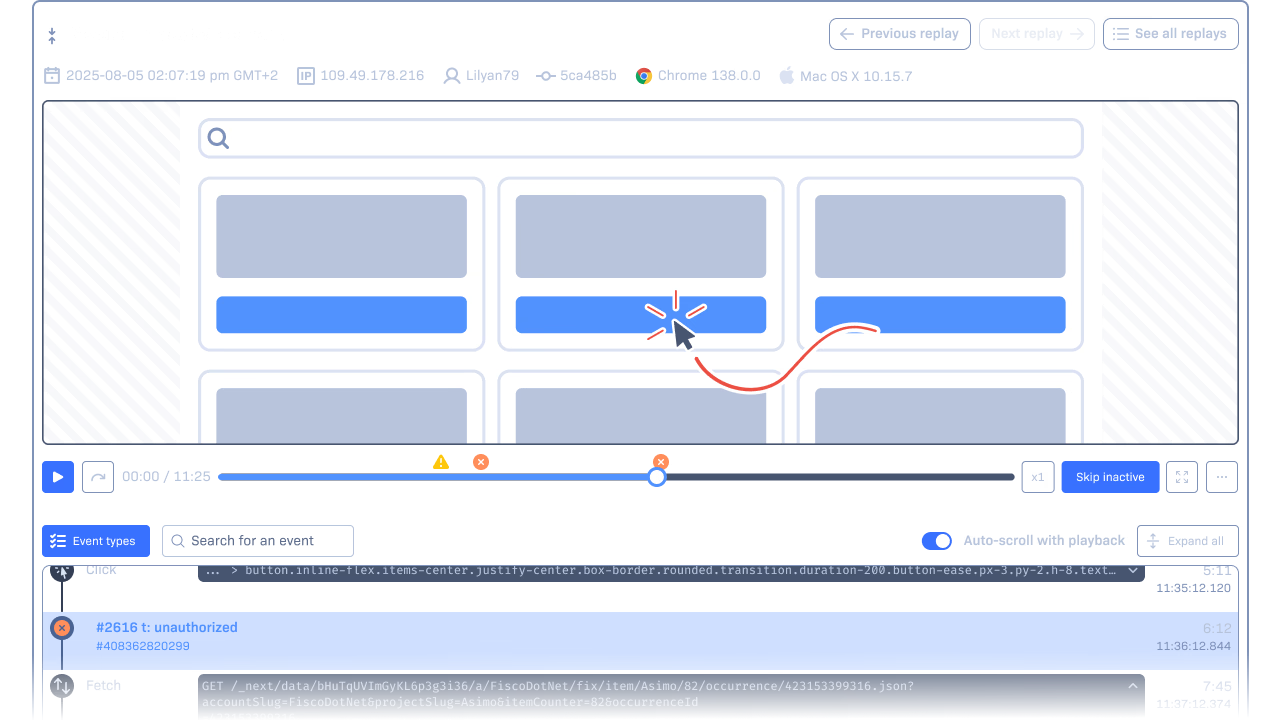
2. LogRocket
AI-powered Session Replay and Analytics
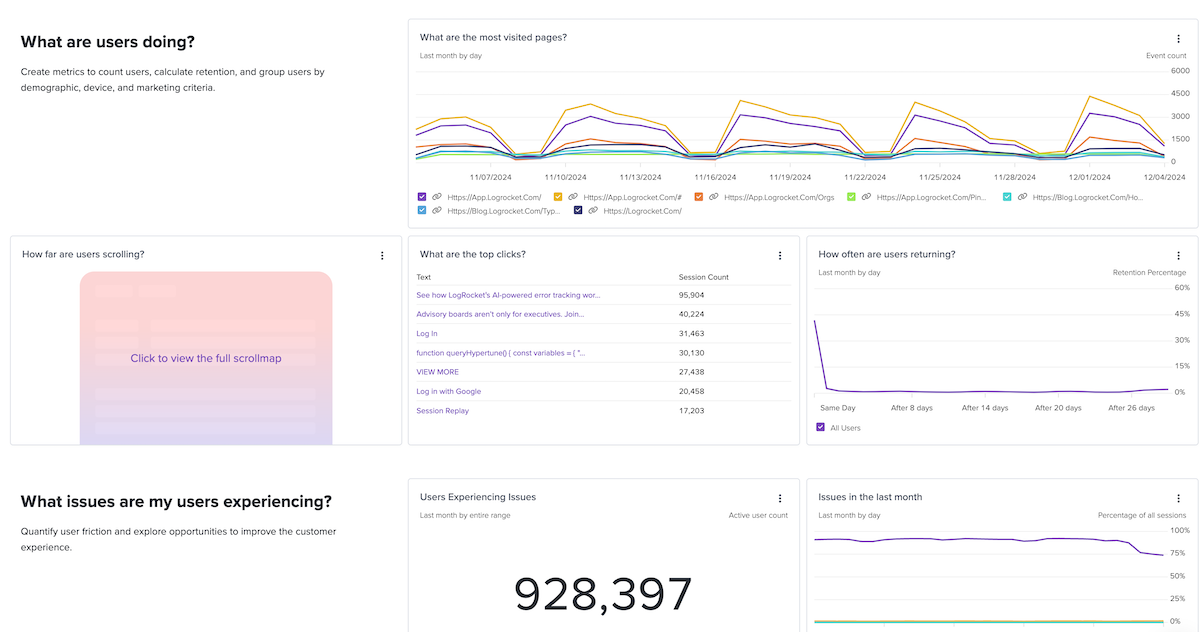
LogRocket focuses on the user experience. It bridges the gap between engineering and product teams, making it an excellent choice for eCommerce stores and SaaS platforms where every click counts. It combines session replay with technical telemetry to show you not just what broke, but how it impacted the user’s journey.
LogRocket Key Features
- Galileo AI: Instead of manually watching hundreds of session replays, Galileo AI analyzes them for you. It automatically identifies patterns where customers are struggling, surfacing critical UX issues that are negatively impacting sales.
- Advanced Analytics: LogRocket provides deep product analytics, including conversion funnels, path analysis, and visual heatmaps to understand user behavior.
- Performance Monitoring: Keep a close eye on your Core Web Vitals. Track metrics like Page Load Time, CLS (Cumulative Layout Shift), TTFB (Time to First Byte), and FID (First Input Delay).
- Frontend Logging: It captures console logs, network requests, and Redux state context.
LogRocket Integration
Frameworks: React, Redux, Vue.js, NextJS, Angular, Expo, Android, and iOS.
Workflow: Export data for observability, manage tickets in Jira, or perform A/B testing via Google Optimize.
Who Uses LogRocket?
Since its launch in 2016, LogRocket has been adopted by over 3,000 brands. It is currently trusted by industry leaders like IKEA, Brex, ShipStation, and CoStar.
LogRocket Pricing
Free Plan: Includes 1,000 sessions/month (great for testing).
Team Plan: Starts at $69/month.
Professional Plan: Starts at $295/month.
LogRocket Ratings
- G2 – 4.6 out of 5 (1700+ reviews)
- TrustRadius – 9.2/10 (10+ reviews)
When Not to Use LogRocket
- If you are on a tight budget – the paid plans start at $69/month, which is higher than competitors like Sentry.
- If you need simple self-hosting – LogRocket’s self-hosted option is geared towards Enterprise users.
💡 LogRocket Alternative If you like the idea of session replay but need an open-source or self-hostable option, check out Highlight.io.
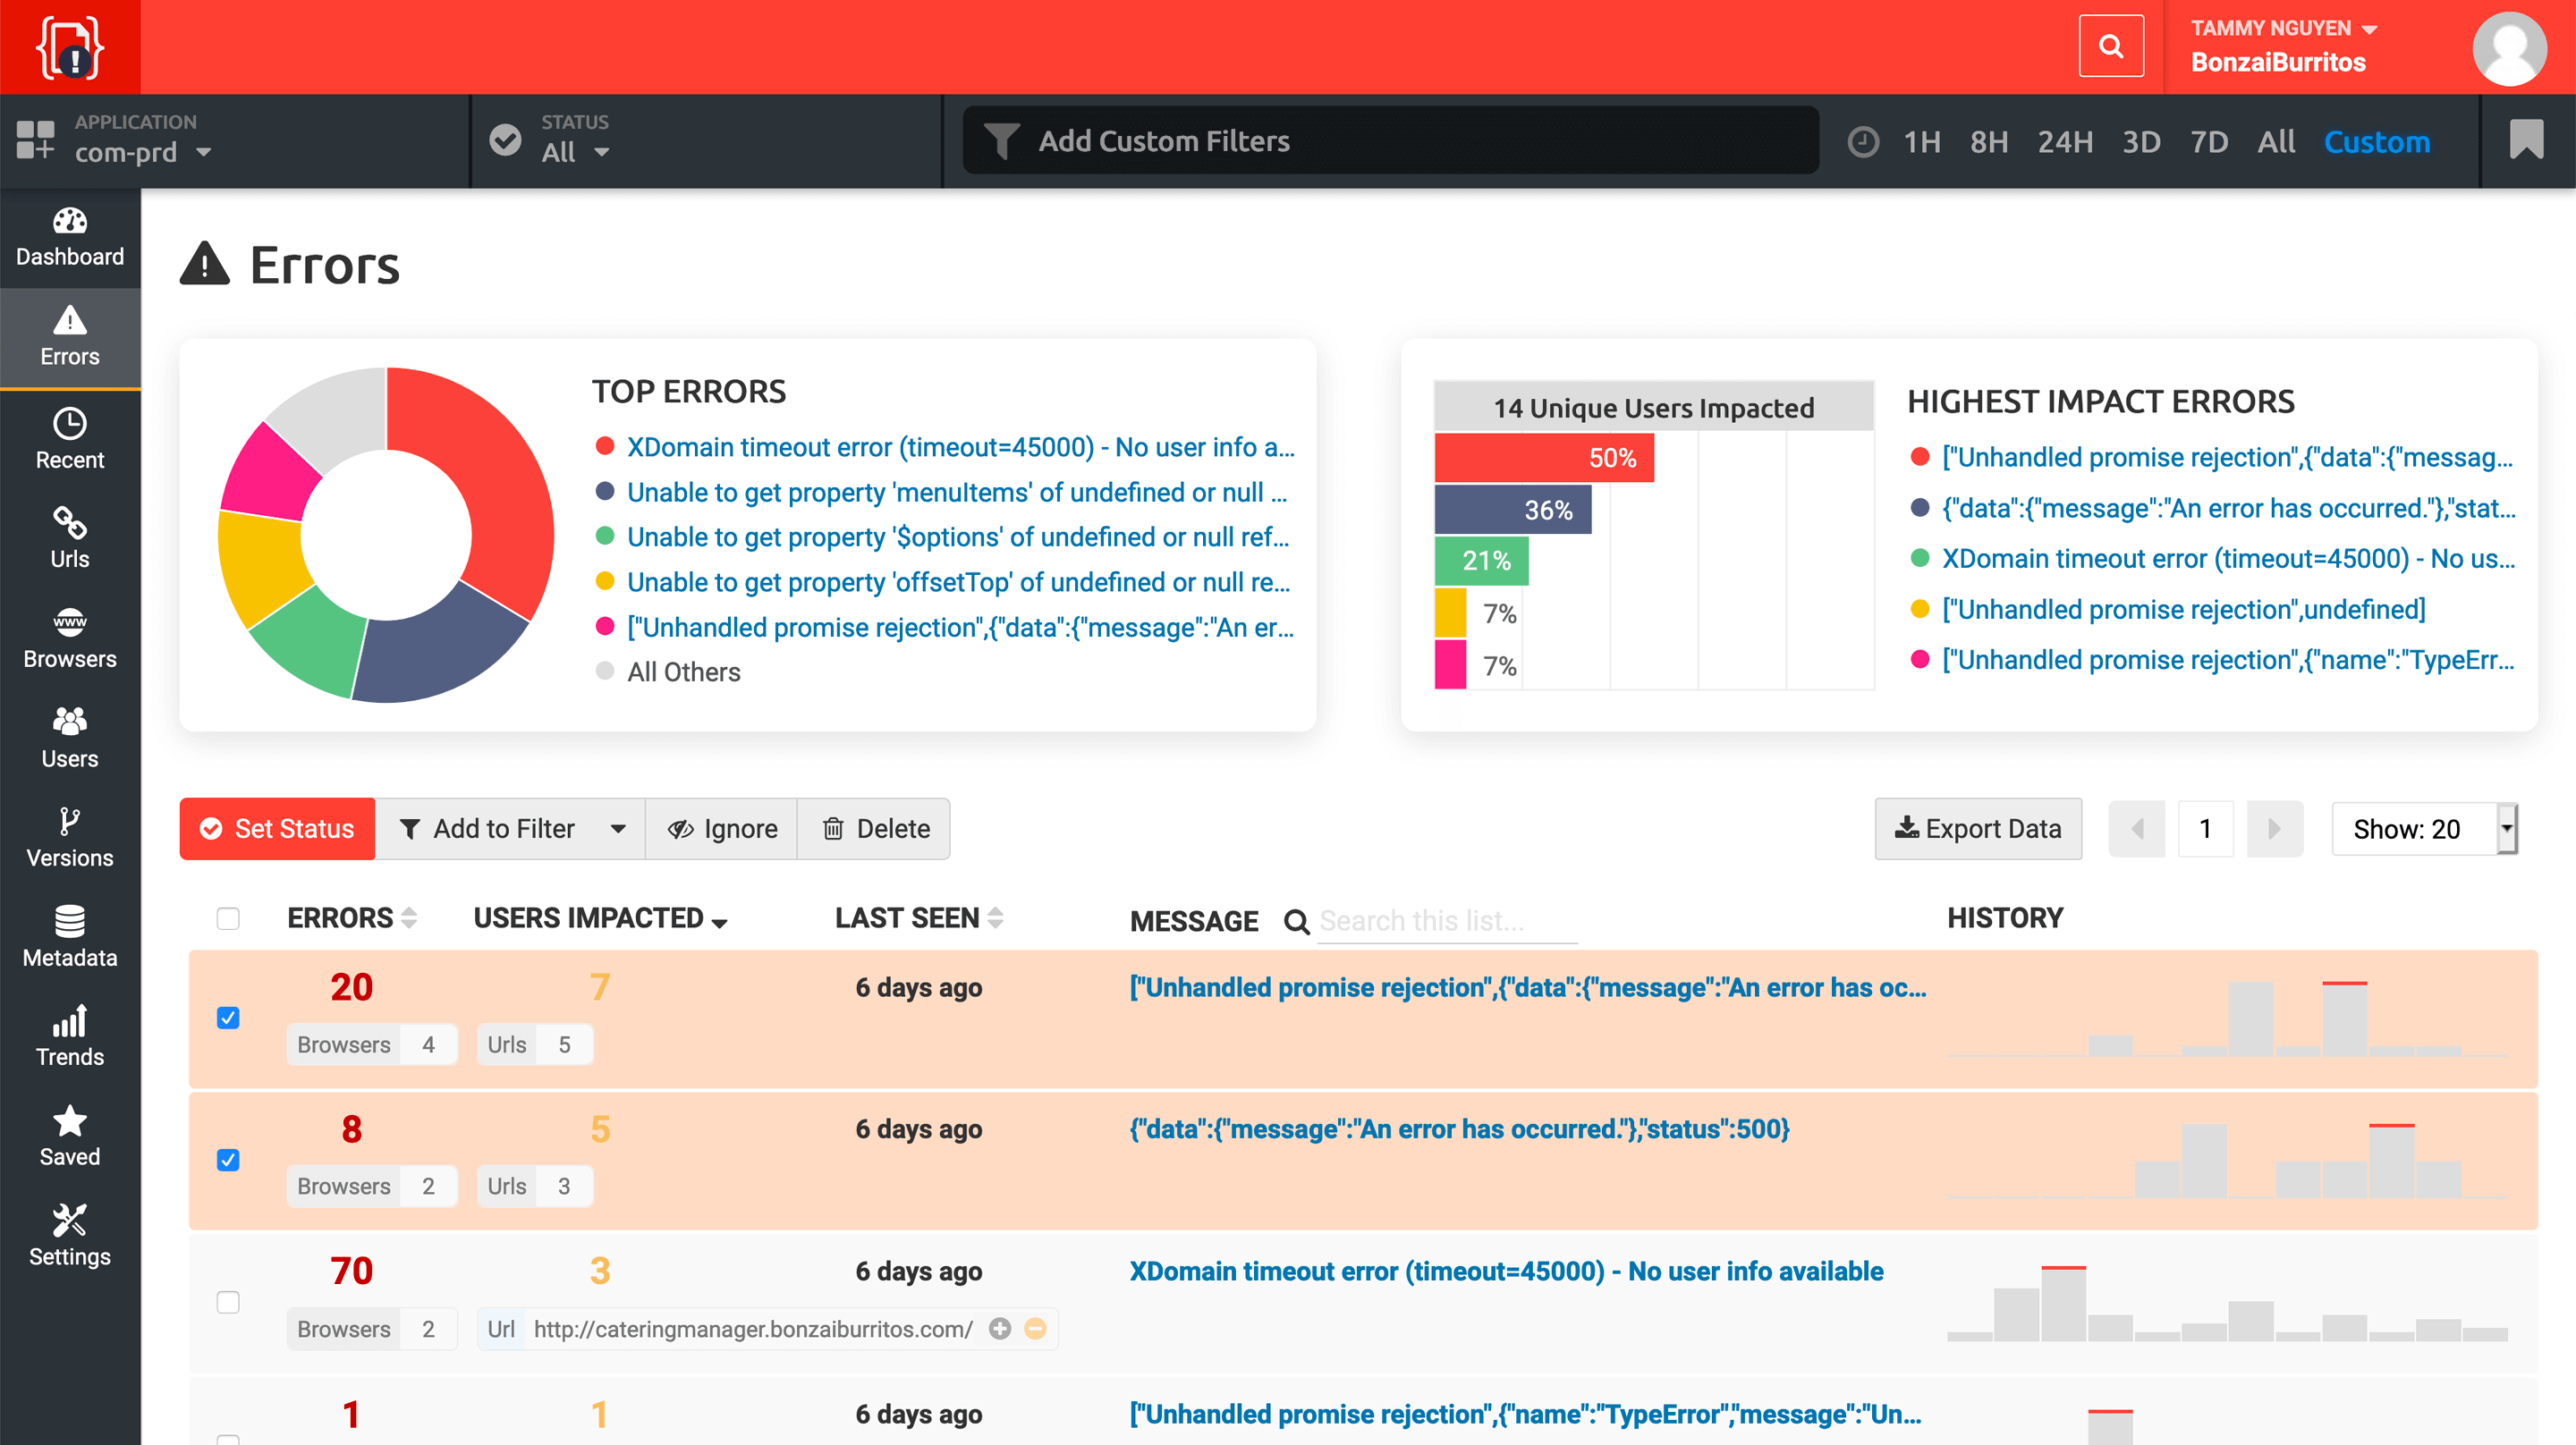
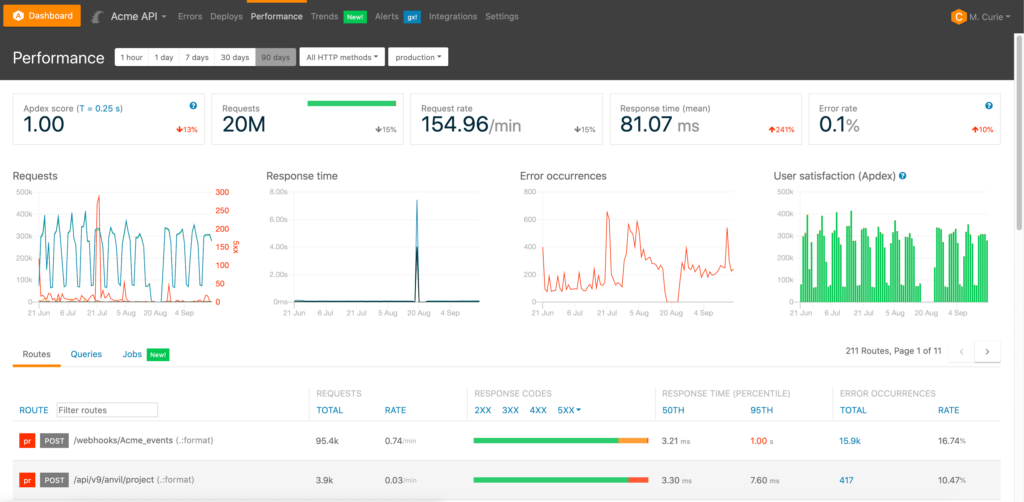
3. Raygun
Intelligent Error Grouping & Deployment Tracking
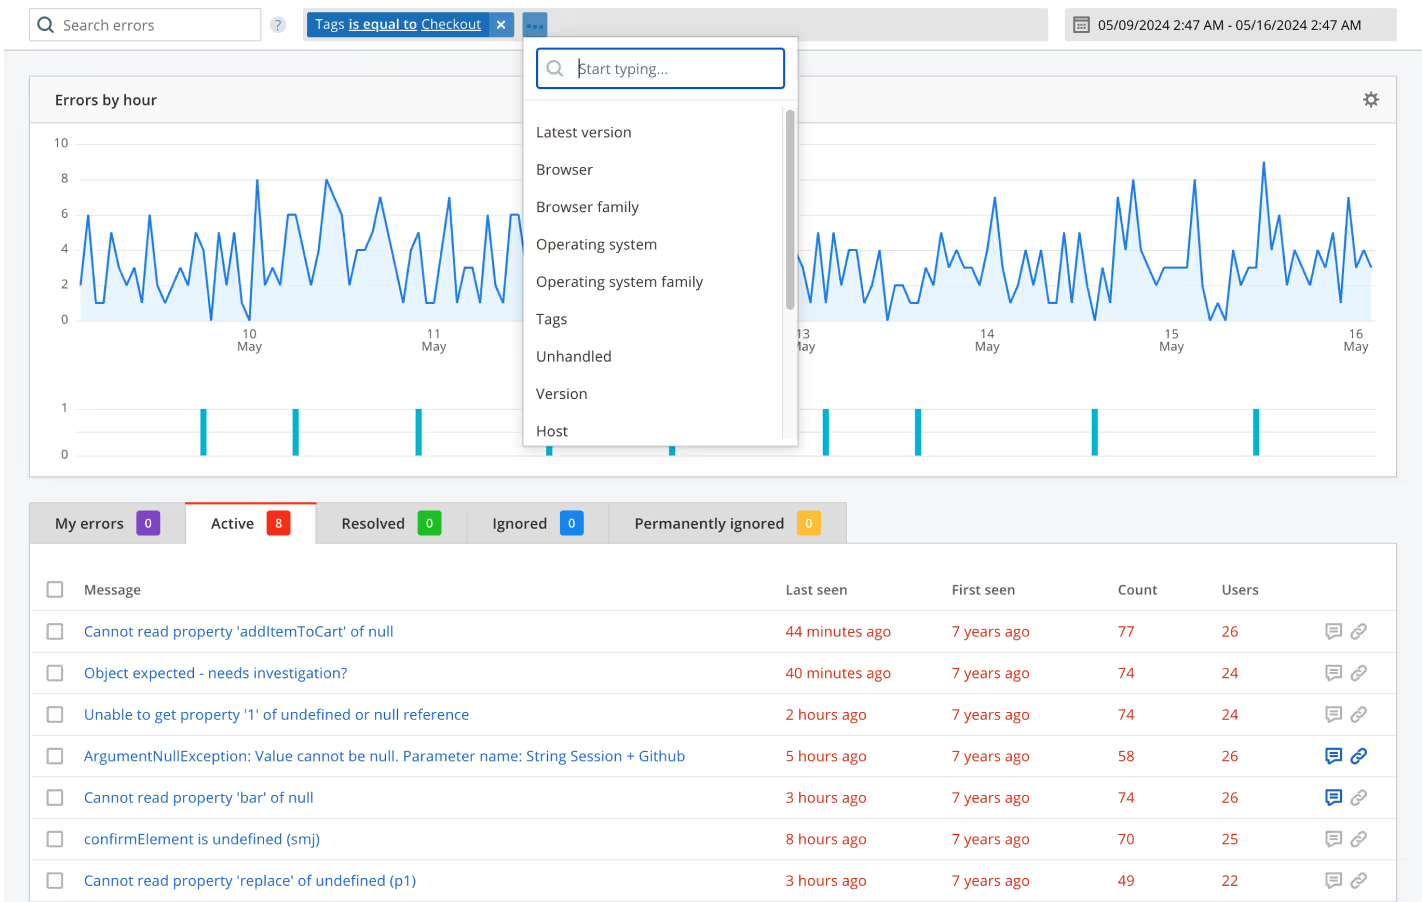
Raygun is a powerhouse in the monitoring space. It excels at cutting through the clutter of error logs to give you actionable insights. If you are tired of alerts spamming your inbox for the same recurring bug, Raygun’s grouping logic will delight you.
Raygun Key Features
- Intelligent Error Grouping: This is arguably Raygun’s strongest asset. Unlike traditional logs that list every single instance of a bug, Raygun automatically clusters similar errors.
- User Impact Analysis: Raygun helps you prioritize fixes by showing you exactly how many users are affected by a specific error.
- Deployment Tracking: A critical feature for DevOps. Raygun tracks how new code releases affect your application’s stability, allowing you to catch regressions immediately after a deployment.
- Slow API & Query Detection: It doesn’t just look at the frontend; it identifies backend requests and database queries that are causing UI delays, giving you a full picture of app latency.
- Raygun AI: This feature uses advanced LLMs to not only identify errors but suggest the actual code fix, significantly reducing debugging time.
Raygun is known for its ease of use. I found the setup incredibly straightforward. Integrating the SDK takes just a few lines of code. It supports a wide range of environments including JavaScript, .NET, Java, Ruby, Python, and mobile frameworks like Xamarin and Maui.
Who Uses Raygun?
Launched in 2013, Raygun is trusted by over 10,000 teams, including major enterprises like Coca-Cola, Domino’s, Microsoft, Avis, and Schneider Electric.
Raygun Pricing
Crash reporting starts at $40/month for 100,000 events
Real user monitoring starts at $80/month for 100,000 traces
Raygun Ratings
- G2 – 4.3/5 (120+ reviews)
- TrustRadius – 7.1/10 (5+ reviews)
When Not to Use Raygun
The biggest drawback is the lack of visual Session Replay. Unlike LogRocket or Sentry, you cannot watch a video of the user’s session to see exactly what they clicked before the crash. If visual debugging is part of your workflow, you will need to pair Raygun with another tool.
Did you know?
Raygun’s AI Error Resolution feature can explain complex error stack traces and suggest the exact code patch to fix it.
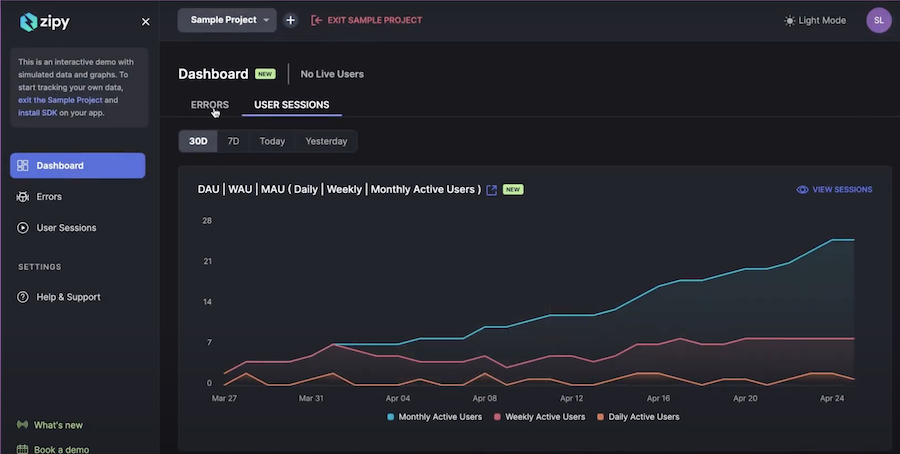
4. Zipy
AI-Powered Session Replay and Error Tracking
With AI-powered session replays, Zipy captures user interactions to help teams pinpoint errors before they impact the experience. These features include:
- Console & network logs – Displays console errors, network requests, and API failures alongside session replays for quick troubleshooting.
- AI-driven root cause analysis – Automatically detects trends in recurring errors and suggests possible fixes.
- Customizable alerts – Get notified about critical errors in real time, ensuring immediate action.
You can easily integrate Zipy into your web and mobile applications without any hassle. It supports a wide range of JavaScript frameworks and libraries, including ReactJS, Next.js, Angular, Svelte, AngularJS, Vue.js, jQuery, and Ember, making it a flexible choice for any tech stack.
Who Uses Zipy?
Zipy was launched in 2020 and is used by fast-scaling startups and SaaS companies looking for in-depth session insights and frontend monitoring.
You can use Zipy for:
- JavaScript error monitoring
- UX, mobile app and product analytics
- Bug and real user monitoring
- Optimize conversion
- Session capturing
Zipy Pricing
Free plan available
Pro plan starts at $39/month
When Not to Use Zipy?
I would not suggest you, If you are doing backend monitoring alongside frontend insights, Zipy may not be the best fit. Additionally, tools like Raygun or FullStory might offer more in-depth insights for AI-driven performance anomaly detection.
Zipy Alternative?
A practical alternative to Zipy is Hotjar for session replay and Smartlook for product analytics.
5. FullStory
UX-Focused Frontend Monitoring
FullStory is a digital experience analytics tool designed to help teams understand user behavior, detect frontend issues, and optimize UX. It offers:
- Session replay – Record and replay user sessions to visualize how users navigate your site, spot frustration signals, and uncover usability issues.
- Frustration detection – Automatically detects rage clicks, dead clicks, and abandoned interactions, helping you optimize UX.
- AI-powered insights – It uses machine learning to highlight anomalies, user struggles, and key drop-off points in conversion funnels.
- Heatmaps and user journey tracking – Visualizes where users engage most, what elements they ignore, and how they interact with your frontend.
FullStory supports JavaScript, React, Angular, Vue.js, and other frontend frameworks, making it a powerful choice for product teams, designers, and developers looking to refine user experience.

Who Uses FullStory?
FullStory is widely adopted by e-commerce brands, SaaS companies, and enterprises that prioritize customer experience optimization. Notable companies using FullStory include Peloton, Marriott, and The Home Depot.
You can use LogRocket for:
- Session replay and UX optimization
- Frontend error tracking
- Conversion funnel analysis
- Heatmaps and interaction tracking
- AI-powered anomaly detection
FullStory Ratings
- G2: 4.5/5 (750+ reviews)
- TrustRadius – 8.9/10 (150+ reviews)
Did you know?
FullStory’s AI-powered auto-insights can automatically detect and categorize UX issues based on real user behavior, helping teams fix problems before they impact revenue.
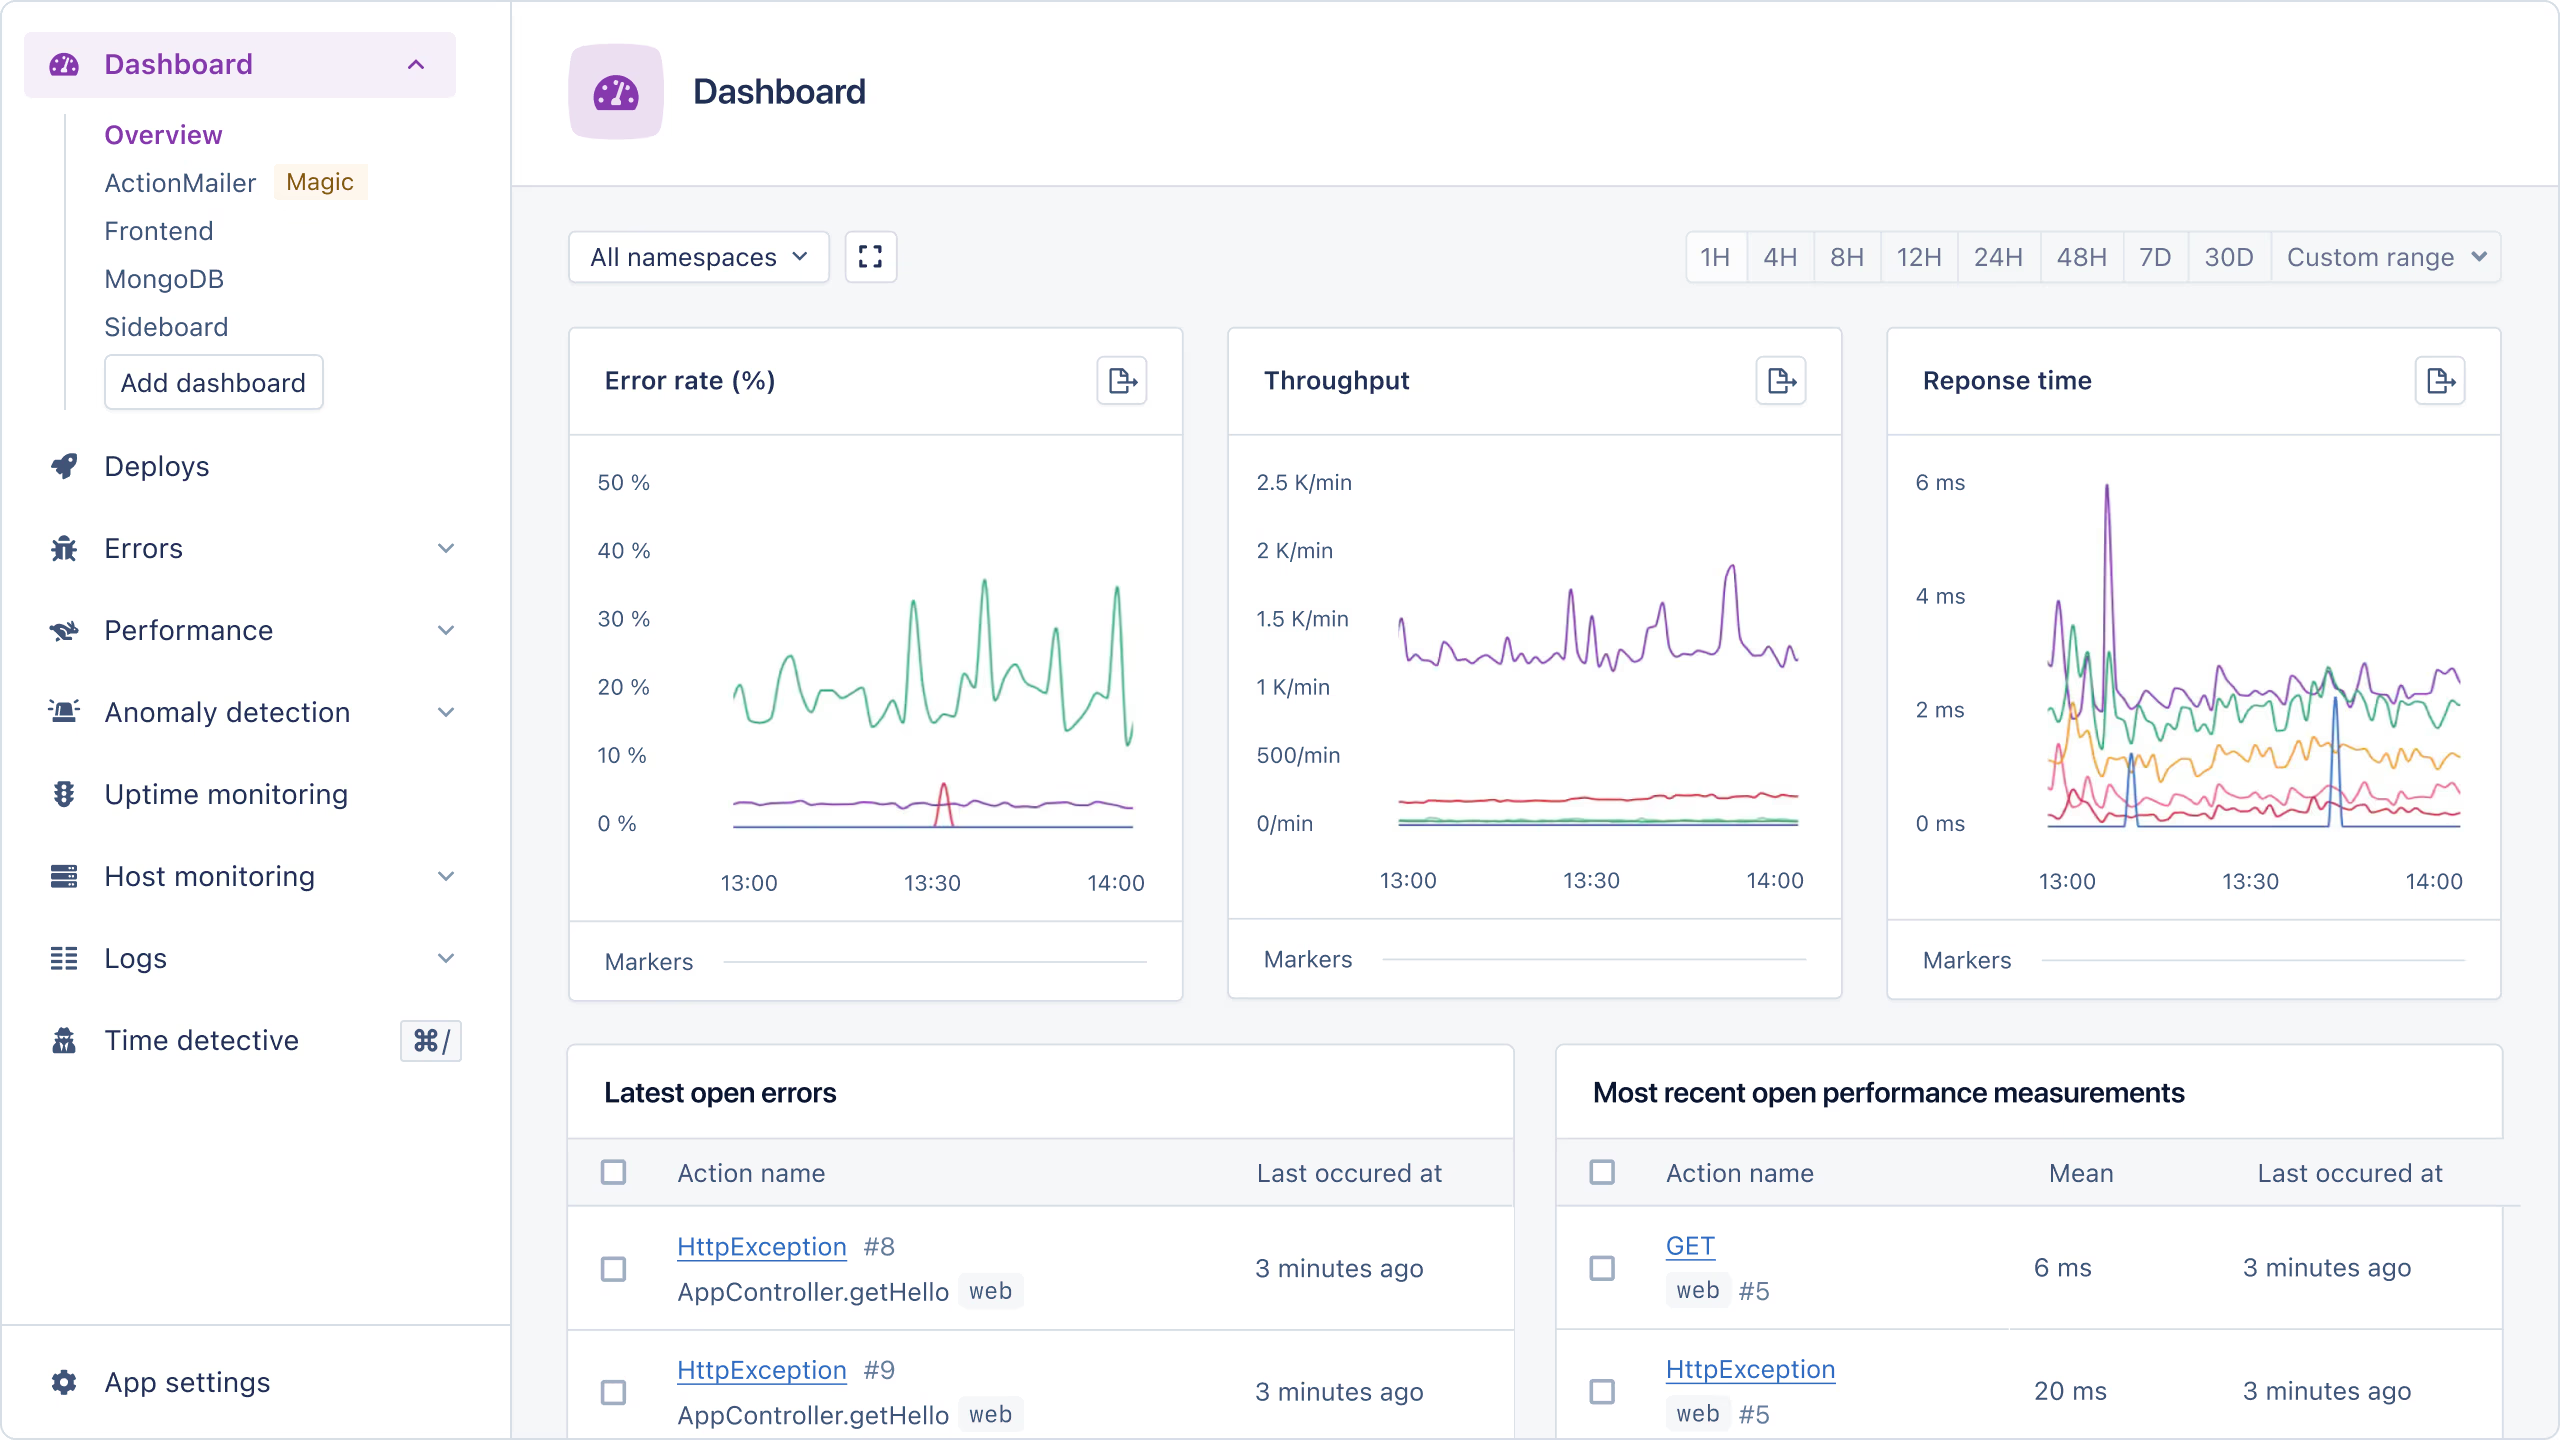
6. AppSignal
Lightweight Frontend and Backend Monitoring
AppSignal prioritizes simplicity without sacrificing power. Best for developers, it offers:
- Full-stack observability – Monitors both client-side and server-side performance, providing a holistic view of application health.
- Custom metrics and dashboards – Allows teams to track custom events, such as API latency, memory usage, and UI response times, all from an intuitive dashboard.
- Anomaly detection and smart alerts – Automatically detects unusual performance spikes or error rates and alerts developers before users are affected.
AppSignal’s one-click integrations with tools like Slack, GitHub, and Jira make it easy for teams to collaborate on issue resolution and performance tuning.
Who Uses AppSignal?
AppSignal is ideal for startups, SaaS companies, and development teams that need affordable yet powerful monitoring without the overhead of configuring complex observability tools.
AppSignal Pricing
Free plan covers 50K requess
Starter at $23.25/month covers 250K requests
7. TrackJS
Simple and Powerful JavaScript Error Tracking
TrackJS is a lightweight frontend monitoring tool designed to detect and debug JavaScript errors quickly. Its features include:
- Automatic error tracking – Captures JavaScript runtime errors, console warnings, and network failures in real time, helping developers resolve issues faster.
- User impact analysis – This one is my personal favorite because it allows teams to prioritize fixes that improve retention and usability.
- Context-rich error reports – Logs detailed error metadata, including browser type, user actions, and stack traces, ensuring developers have all the necessary information.
- Minimal configuration – Simple one-line script installation makes it fast and easy to integrate with any frontend application.
TrackJS is particularly useful for small teams and solo developers who need a dedicated JavaScript error-monitoring solution without unnecessary complexity.
TrackJS Pricing
Start at $45/month
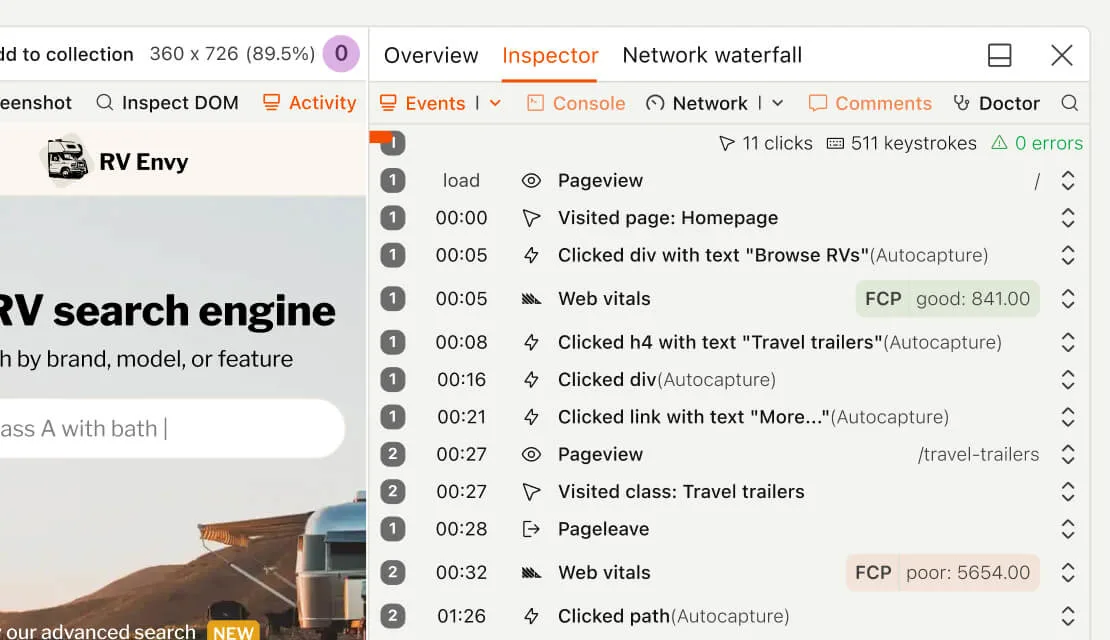
8. PostHog
Open-Source Product Analytics and Monitoring
PostHog is an open-source product analytics and monitoring tool. It is not like traditional error monitoring tools, PostHog provides deeper insights into user behavior. It offers various features including:
- JavaScript error tracking – Detects frontend crashes, failed API requests, and JavaScript runtime errors, ensuring applications run smoothly.
- Session recording – Replays user interactions to identify UI issues, rage clicks, and unexpected navigation patterns.
- Feature flags and A/B testing – Enables controlled rollouts of new features and experiment tracking to prevent performance regressions.
- Product analytics – Tracks conversion funnels, retention rates, and user journeys to help teams make data-driven product decisions.
PostHog is a unique hybrid of error monitoring, product analytics, and session replay, making it a great fit for growth-focused startups and engineering teams that want full control over their monitoring stack.
You can use PostHog as self-hosted or cloud. Your choice! It is rated as 4.5/5 on G2 with over 670 reviews.
PostHog Pricing
PostHot free plan should be sufficient for small app and you can upgrade to Pay-as-you-go plan as you grow.
9. Rollbar
AI-Powered Error Monitoring
Developers looking for faster error detection and resolution can rely on Rollbar, a real-time error monitoring and debugging platform. This tool offers many great features including:
- Real-time error tracking – One of the best. It monitors frontend and backend errors with detailed stack traces, user impact analysis, and code context.
- AI-assisted error grouping – Automatically clusters similar errors, reducing noise and making it easier to focus on critical issues.
- Automated issue resolution – Integrates with Jira, Slack, and GitHub to assign errors to developers and track progress seamlessly.
- Telemetry and replays – Captures console logs, network requests, and recent user actions to help teams reproduce issues quickly.
- Advanced deployment tracking – Monitors how new releases impact frontend stability and alerts teams if errors spike after deployment.
Rollbar supports JavaScript, React, Angular, Vue.js, Node.js, and various backend frameworks, making it a great full-stack monitoring tool.
Who Uses Rollbar?
Rollbar is trusted by engineering teams at SaaS companies, startups, and enterprises that need proactive error detection and automated debugging workflows. Some notable companies using Rollbar include Twitch, Salesforce, and Twilio.
You can use Rollbar for:
- Automated issue resolution with AI
- Error prioritization and grouping
- Frontend and backend observability
- Tracking release stability and regressions
Rollbar Pricing
Free plan: Includes 5,000 error events/month
Essentials plan: Starts at $15.38/month which includes 25K events and 90 days data retention
10. Airbrake
Real-Time Error Monitoring for Faster Debugging
Airbrake is a lightweight yet powerful error monitoring tool to help developers catch and fix JavaScript errors before they impact users. Notable features includes:
- Real-time error tracking – Captures JavaScript errors, unhandled exceptions, and failed API requests with detailed stack traces.
- Smart error grouping – Automatically clusters related errors, reducing redundant alerts and allowing developers to focus on high-impact issues.
- Customizable alerting – Sends real-time notifications via Slack, Jira, and email to ensure teams respond to errors instantly.
- Deployment tracking – Monitors how code changes impact frontend stability, helping teams identify regressions after new releases.
Airbrake integrates with React, Angular, Vue.js, JavaScript, Node.js, and various backend frameworks, making it a versatile choice for full-stack teams.
You can use Airbrake for:
- Fix deployment issues
- Frontend and backend error detection
- JavaScript error tracking and debugging
- Integration with issue tracking tools
Airbrake Pricing
Dev: best for single person team, it costs $17/mo on yearly plan
Basic: good for team, $34/mo
Pro: best for team who needs unlimited users and audit logs, $68/mo
Airbrake Alternative
Honeybadger is the best alternative to Airbrake.
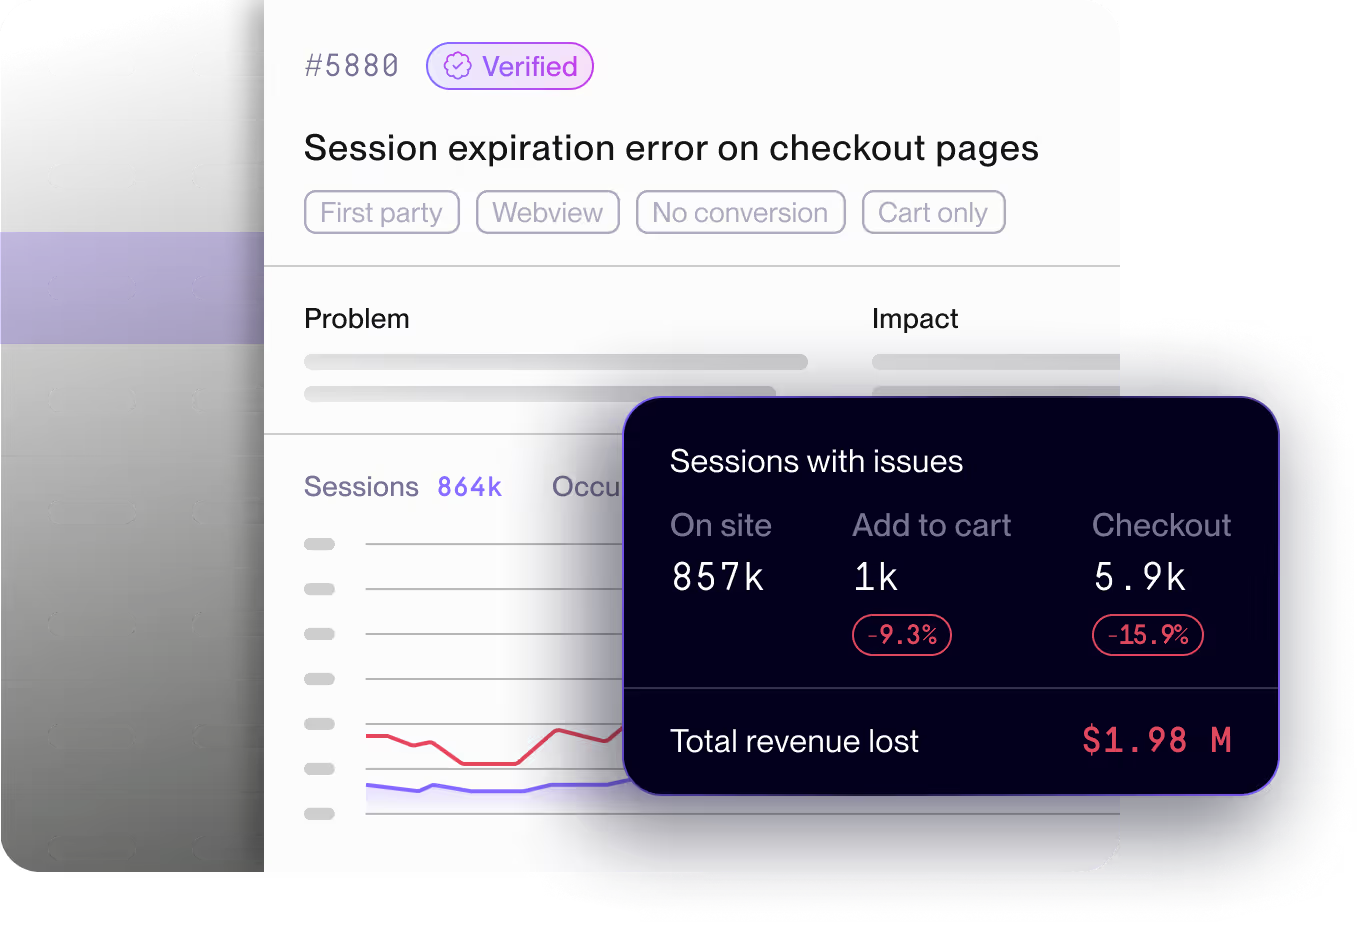
11. Noibu
E-Commerce Focused Frontend Error Monitoring
Noibu is a frontend monitoring platform specifically for e-commerce websites. It helps online retailers detect, diagnose, and resolve revenue-impacting errors that disrupt user experience and cause abandoned transactions. It features includes:
- Error detection with revenue impact analysis – Identifies JavaScript errors, checkout failures, and API disruptions, prioritizing those that directly affect sales.
- AI-powered root cause analysis – Automatically analyzes error patterns and suggests fixes, reducing developer workload.
- Conversion tracking and funnel analytics – Monitors cart abandonment, failed payments, and broken forms to help businesses recover lost sales.
- Compliance and data security – Noibu is GDPR-compliant and ensures sensitive customer data remains protected.
Noibu integrates with Shopify, Magento, BigCommerce, and custom e-commerce platforms, making it a must-have tool for online retailers looking to optimize checkout performance.
You can use Noibu for:
- JavaScript error monitoring for e-commerce sites
- Checkout failure detection and debugging
- Revenue-impact analysis of frontend issues
- Cart abandonment tracking and conversion optimization
Noibu Alternative
Check out Glassbox. It offers same features as Noibu offers.
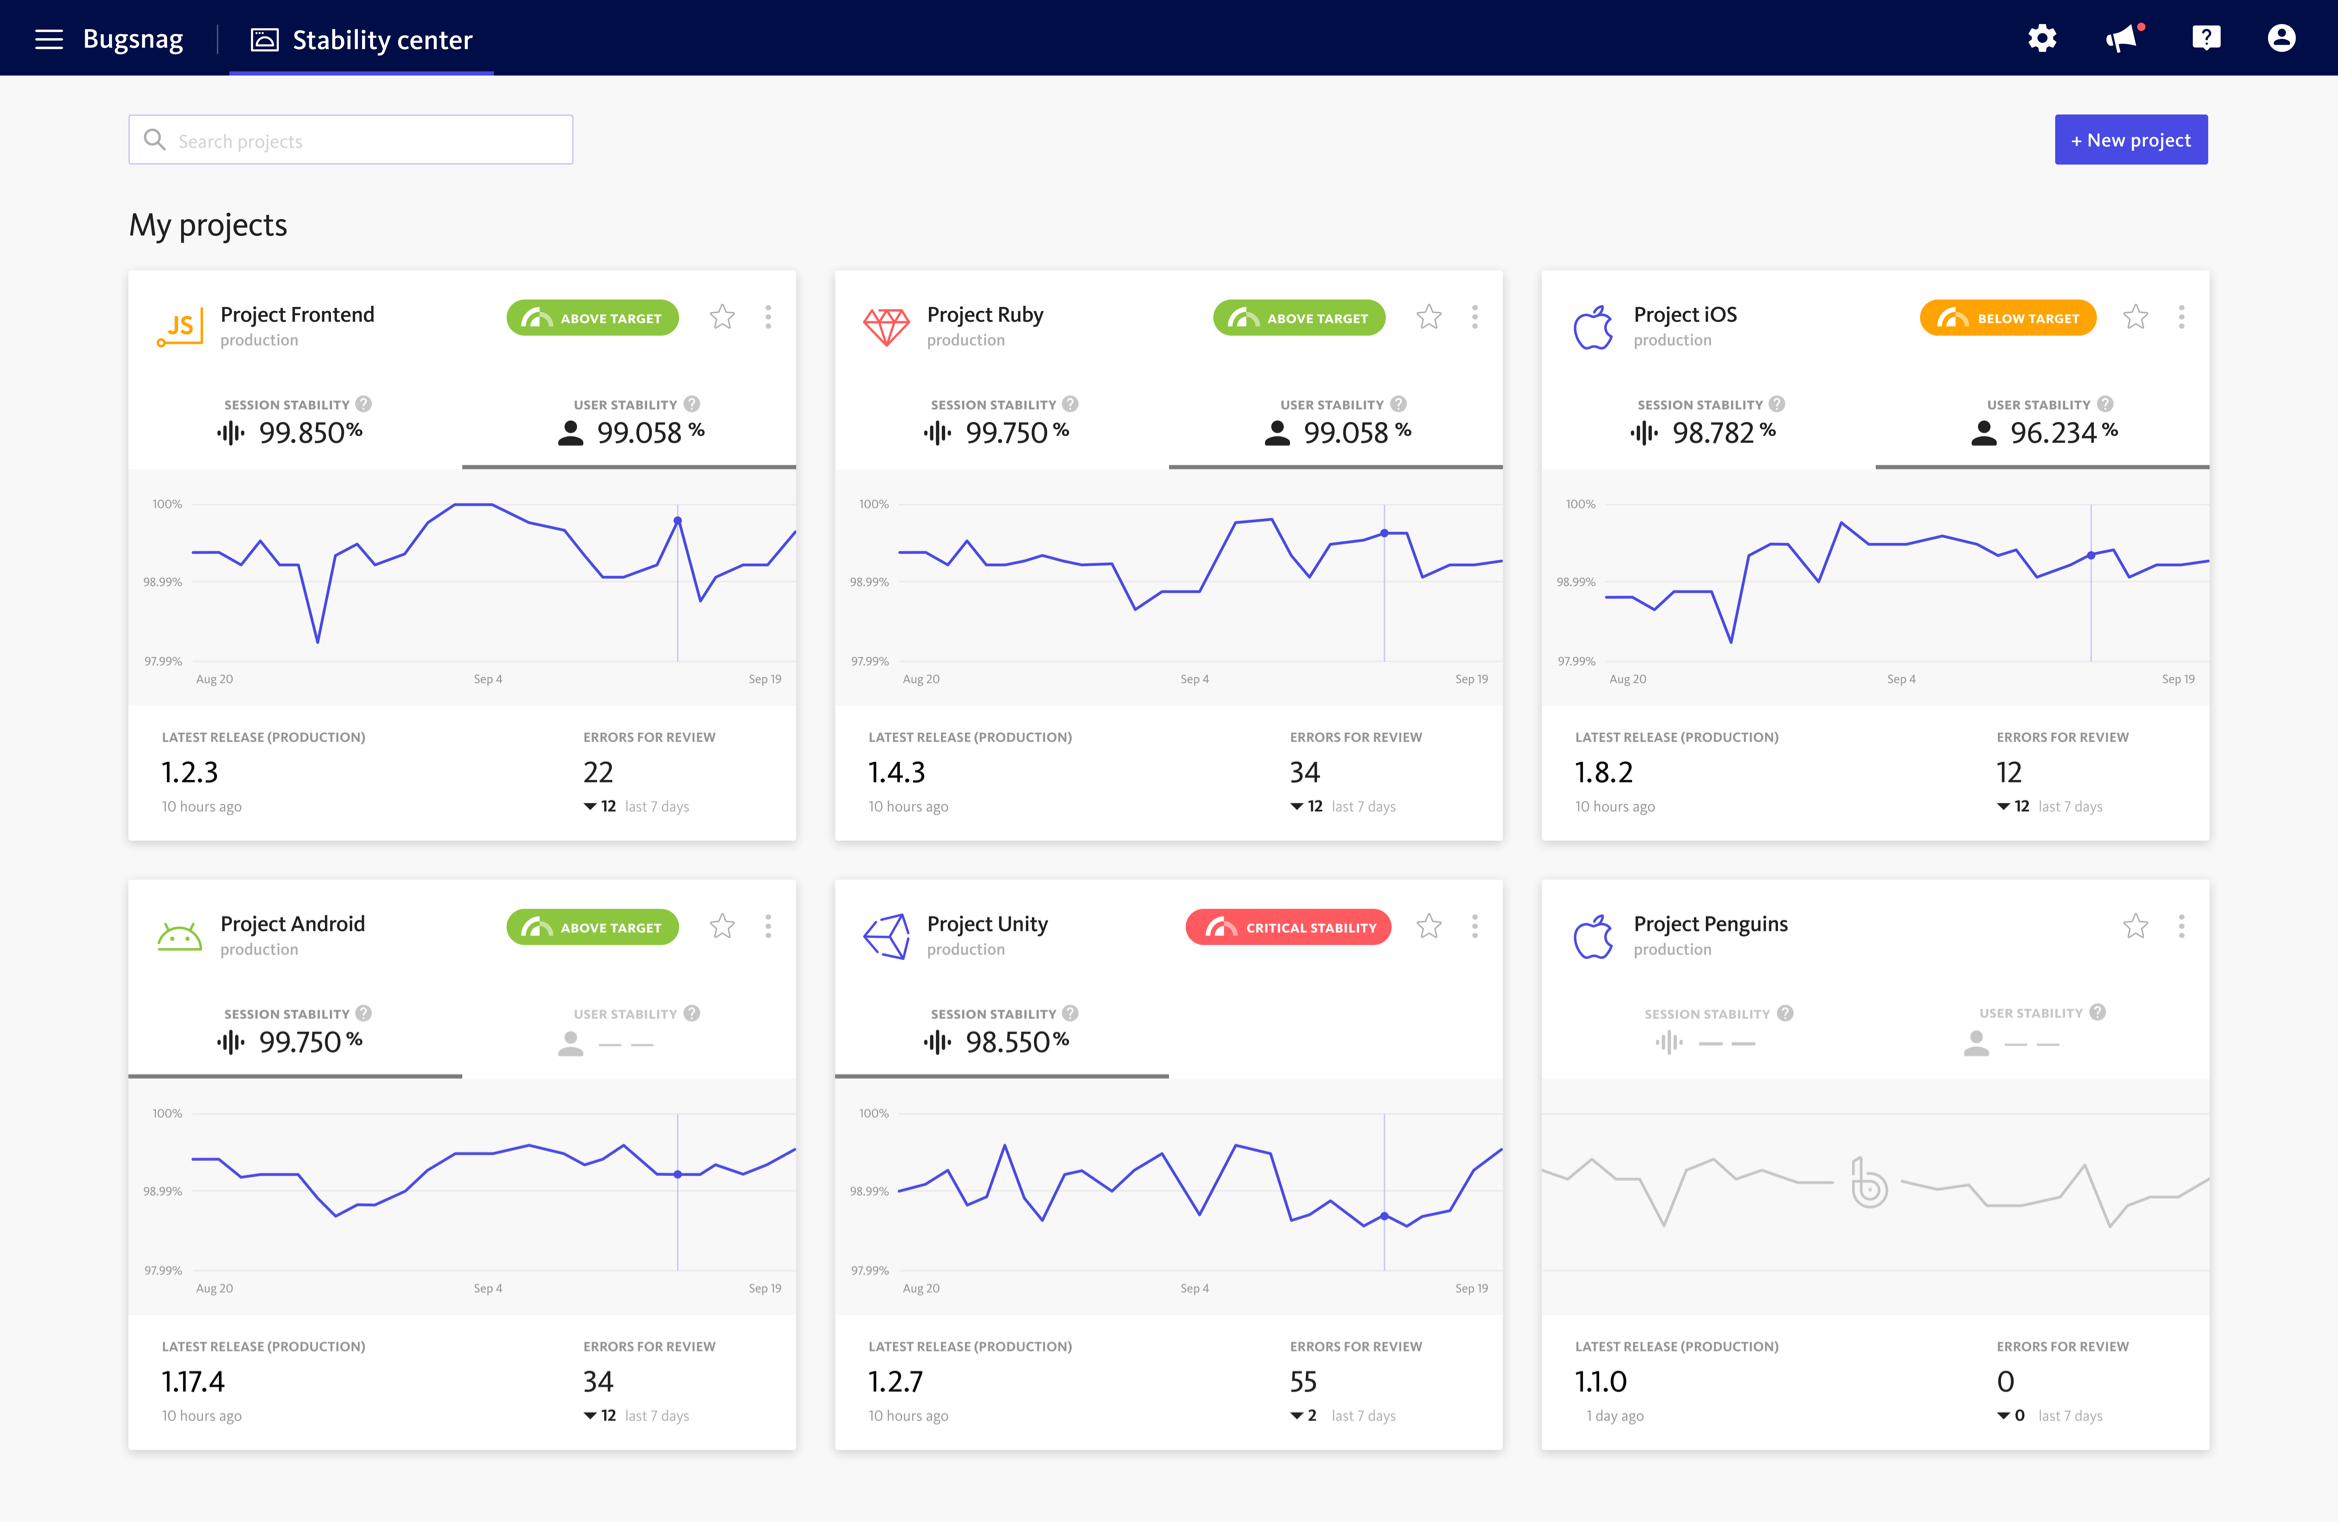
12. BugSnag
Full-stack Observability Platform
BugSnag is a full-stack visibility platform for engineering teams needing deep application stability visibility. The platform is enterprise-ready and recommended for medium to large websites.
You can use Insight Hub for the following:
- Automated error tracking – Captures frontend crashes, JavaScript runtime errors, and unhandled exceptions with full diagnostic data.
- Stability score analysis – Provides quantitative stability ratings to help teams prioritize critical errors affecting user experience.
- Smart error grouping and filtering – Uses machine learning to cluster similar errors, reducing alert fatigue and making debugging more efficient.
- Deep integrations with CI/CD tools – Works with GitHub, Jira, Slack, and Datadog, allowing teams to track issues across development pipelines.
Insight Hub supports JavaScript, React, Angular, Vue.js, and multiple backend languages, making it an excellent choice for full-stack error tracking.
Bugsnag Pricing
Free plan: Includes basic error tracking
Select plan: Starts at $20/month
Other Frontend Monitoring Tools
Highlight.io
Datadog
Which Tool Should You Choose?
Developing a functional application is hard work, but maintaining it shouldn’t be. A small glitch can disrupt the user experience and impact your bottom line.
Whether you need error tracking, session replay, or performance monitoring, the tools on this list are the best in the industry.
- Need deep code insights? Look at Sentry or Raygun.
- Need to see what the user saw? Go with LogRocket or FullStory.
- Need stability scores? Check out BugSnag.
Choose the one that fits your budget and stack, and ensure your application runs as smoothly as it looks.
Frequently Asked Questions
Sentry, PostHog and LogRocket are the top contenders.
Frontend monitoring is essential because it directly impacts customer retention and revenue. Unlike backend errors, which might just slow down a server, frontend errors break the user interface, preventing customers to buy your products. Research shows that most users won’t report a bug; they will simply leave your site. A monitoring tool alerts you to these “silent killers” immediately, allowing you to fix issues before they cause significant churn.
Yes, Sentry and PostHog are the most popular open-source options that allow for full self-hosting.