A lot of software development teams I’ve talked to manage monitoring the same way they did 10 years ago: click through a dashboard, configure some alerts, and add a few rules. It’s manual, it’s error-prone, and it gets exponentially worse as the infrastructure grows.
We’ve somehow managed to automate deployment, testing, infrastructure, and everything except the system that tells us when something’s broken: monitoring.
Modern software development demands agility. This environment requires methodologies like Continuous Integration, and Continuous Delivery (CI/CD), alongside technologies like containers. To keep pace, software teams must integrate monitoring throughout the entire Software Development Life Cycle (SDLC). This is where Monitoring as Code (MaC), and its broader counterpart, Observability as Code (OaC) become essential.
In this article, we’ll explore what MaC is in detail, how it intersects with Observability as Code, and the tools that can help you implement it.
What Is Monitoring as Code?
Monitoring as Code (MaC) is an Everything as Code (EaC) mindset that involves continuous monitoring at each stage of the ITOps and DevOps lifecycles. It allows developers to code, test, and deploy their entire testing and synthetic monitoring setup within a standardized, developer-focused workflow.
MaC is essentially a subset of EaC, extending code-based DevOps practices where monitoring and observability are defined and managed using code.
It treats infrastructure, operations, configuration management, security, and compliance as code or software in order to automate processes and improve scalability, reusability, and security.
Furthermore, MaC ensures your applications and infrastructure are in good health, performing well, and staying secure and reliable. It does so by deploying monitors and services in the IT environment. MaC also provides you with a way to figure out a problem’s root cause, so you can find the remedy faster.

A comprehensive MaC must involve:
- Detecting anomalies and evaluating observability data.
- Collecting additional information related to operations during failures and performing diagnoses.
- Orchestrating monitoring jobs such as synthetic API checks.
- Managing alerts and incident responses.
- Storing and analyzing historical data for long-term trend analysis.
Monitoring vs. Observability
While often used interchangeably, monitoring and observability serve different purposes.
Monitoring tells you if a system is working. It focuses on known parameters, predefined thresholds, and health checks. (e.g., Is the CPU usage over 95%?)
Observability tells you why something isn’t working. It uses telemetry (logs, metrics, and traces) to help you explore the unknown factors and understand the internal state of a system from its external outputs. (e.g: CPU hit 95% after a slow downstream API caused request queues and thread exhaustion)
Observability as Code extends Monitoring as Code by defining dashboards, alerts, and log or trace configurations as code, so new services automatically become observable when deployed.
MaC vs. Traditional Monitoring
Traditional monitoring is different from monitoring as code. MaC provides a more structured and repeatable approach to monitoring, not just configuring plugins and agents or performing automated installations as with basic monitoring automation.
MaC covers the definition of alerts, dashboards, and monitoring logic and supports consistent alerting and operational visibility across environments. Incident management and diagnosis can consume these signals, but are not inherently part of MaC.
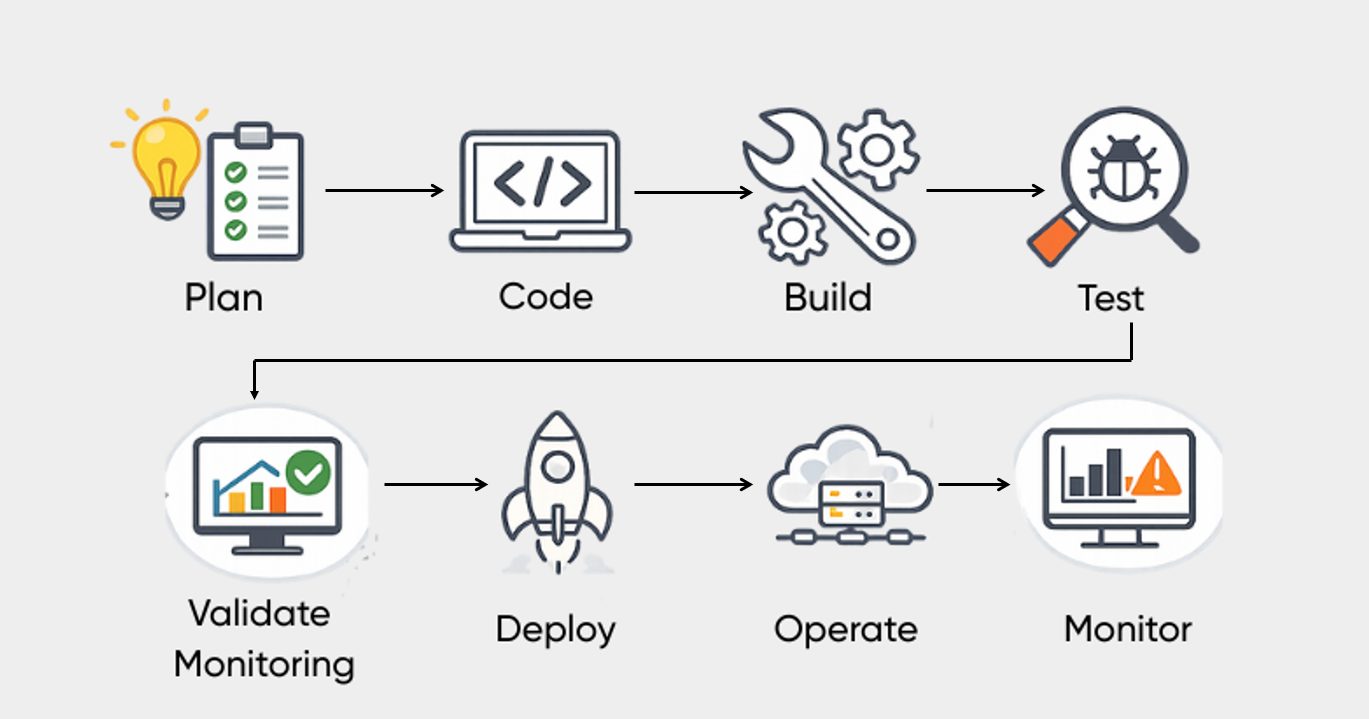
The SDLC involves stages—planning, coding, building, testing, releasing, deploying, operations, and monitoring. MaC takes a left-shift approach by moving the definition of monitoring closer to the initiation of the software development process.
In MaC, teams aim to gain deeper metrics and insights throughout the software development lifecycle. For this, the process becomes:
Plan → Code → Build → Test → Validate Monitoring → Deploy → Operate → Monitor
How Does MaC Work?
The way Infrastructure as Code (IaC) manages servers, applications, and cloud-based infrastructure components is similar to how MaC works and handles monitoring.
MaC defines monitoring signals for business-critical key performance indicators (KPIs). This enables product managers, software developers, and other stakeholders to track these KPIs and make informed decisions using consistent telemetry.
With MaC, the monitoring process gets codified, enabling developers to set up a structured framework with strict version control that is easy to repeat, inherit, and maintain as the software evolves.
MaC ensures that even small code changes can be observed through predefined metrics and alerts, improving visibility across the software lifecycle.
MaC covers the definition of alerts, dashboards, and monitoring logic. Troubleshooting and diagnosis use these signals, but are handled by separate tools and processes.
In practice, a software team builds a web app and releases it to the public. They require immediate visibility into its behavior. MaC enables application developers and ITOps teams to observe application behavior from deployment, as monitoring is already defined as part of the codebase.
How to Implement MaC
Typically, monitoring as code involves the following steps:
1. Integration: In MaC, existing systems are integrated with “as code” services and tools, such as CI/CD pipelines and certificate management systems. After integration, teams can iterate quickly on versioned monitoring code. This helps align development, security, and IT teams around shared workflows. It also automates monitoring deployments and improves scalability and visibility of monitoring setups.
2. Standardization: This process involves identifying existing interfaces used across observability and monitoring tools and consolidating them into shared workflows. This can include monitoring scripts, API endpoints, exporters, and metric-fetching tools.
3. Acceleration: In this step, common observability and monitoring needs are packaged as declarative templates. This enables faster adoption of MaC across different teams and business units.
4. Innovation: This stage focuses on closing the Everything as Code (EaC) loop in the software lifecycle. As a result, development, security, and IT teams can collaborate more effectively using a unified, code-driven workflow to improve core business outcomes.
Practical Examples of MaC in Action
Instead of clicking through a dashboard to create a check, MaC allows you to define your monitoring in simple configuration files written using familiar programming languages.
Example: A Simple API Check (Checkly)
Using a tool like Checkly, you can define a synthetic check that runs every 10 minutes to ensure your login API is functional.
# checkly.config.ts (Example)
import { ApiCheck } from 'checkly/constructs'

new ApiCheck('login-api-check', {
  name: 'Login API',
  activated: true,
  frequency: 10,
  request: {
    url: 'https://api.myapp.com/v1/login',
    method: 'GET',
    assertions: [
      { source: 'STATUS_CODE', property: '', comparison: 'EQUALS', target: '200' }
    ]
  }
})
Example: Infrastructure Monitoring (Datadog with Terraform)
If you are managing infrastructure, you can use Terraform to define a Datadog monitor for CPU usage:
resource "datadog_monitor" "cpu_monitor" {
  name    = "High CPU Usage on Web Server"
  type    = "metric alert"
  query   = "avg(last_5m):avg:system.cpu.idle{host:webserver} < 10"
  message = "CPU usage is high on {{host.name}}. Notify: @devops-team"

  monitor_thresholds {
    critical = 10
    warning  = 20
  }
}
Top Tools for Implementing MaC and OaC
Several industry-leading platforms allow you to implement monitoring and observability as code:
| Tool | Focus | Capability |
|---|---|---|
| Checkly | Synthetic Monitoring | Specializes in “Monitoring as Code” for APIs and Web apps using Playwright and TypeScript. |
| Datadog | Full-Stack Observability | Extensive support for managing monitors, dashboards, and logs via Terraform or Pulumi. |
| New Relic | Observability Platform | Offers Observability as Code capabilities through its Terraform provider and Quickstarts for automated instrumentation. |
| Pulumi | Infrastructure as Code | Allows you to define monitoring resources (in Datadog, New Relic, etc.) using general-purpose languages like Python or Go. |
How MaC Solves Traditional Monitoring Challenges
MaC solves monitoring challenges by offering the below solutions.
1. Communication and Coordination: MaC enables teams to collaborate through a shared, version-controlled workflow. When a security threat is detected, alerting logic defined in code helps ensure notifications are routed consistently to the appropriate owners.
2. Automatic scaling: Traditional monitoring often requires manual configuration for new resources. MaC uses automation and reusable definitions to scale monitoring consistently as infrastructure grows.
3. Speed and Agility: Because monitoring checks live alongside application code, developers can update monitors in the same pull request as application changes.
4. Transparency: All monitoring logic is visible in the repository. This reduces hidden alerts and shadow dashboards, making monitoring configurations auditable and peer-reviewed.

Benefits of Adopting MaC/OaC
1. Version Control: In traditional monitoring, it is difficult to track changes because monitors are often configured individually through dashboards. This makes version control challenging.
MaC improves version control by defining monitoring as code and aligning it with the software’s build, test, and deployment lifecycle. This improves visibility, repeatability, and reliability.
It also allows teams to track what changed, who made the change, and when. If needed, monitoring configurations can be reverted to a previous version.
2. Unification: MaC helps unify fragmented monitoring configurations with CI/CD workflows and keeps them synchronized.
For example, during a rollout, teams may need to mute alerts temporarily to avoid false alarms. With MaC, monitor changes such as muting, updating thresholds, or unmuting can be handled alongside application changes.
Because monitors are configured closer to the application code, updates to services and monitoring remain aligned and consistent.
3. Efficiency: Traditional monitoring is often configured manually through user interfaces, usually by operations teams. This process can be slow and repetitive.
With MaC, monitors can be created automatically through code. When a new endpoint or service is introduced, corresponding monitoring can be provisioned using predefined templates, improving efficiency through automation.
4. Increased Transparency: By using source control, MaC improves transparency across teams and enables faster and safer rollbacks.
All monitoring checks live alongside application code in the same repository. This makes it clear what is being monitored, why it is monitored, and how it is configured. As a result, teams can collaborate more easily and manage monitoring changes with confidence.
5. Better Scalability: MaC improves scalability by making monitoring provisioning faster and more consistent. As infrastructure or team size grows, monitoring configurations can scale using the same code-driven approach.
Scaling up or down becomes easier because monitoring follows the same process as infrastructure and deployments.
6. Robust Alerting: With MaC, alerting rules and notification logic are defined as code. This allows you to create consistent, actionable alerts that trigger when failures occur, helping teams respond quickly and maintain application stability.
7. Reporting: MaC enables teams to define dashboards and reports as code. These can be tailored for different roles or teams and are useful for reviews and audits.
Final Words
Traditional monitoring is no longer enough for the speed of modern DevOps. By introducing Monitoring as Code (MaC) and Observability as Code (OaC) into your pipeline, you bridge the gap between development and operations. This approach ensures that your software is not just up and running but truly understandable and resilient.