



With cyber threats evolving and getting more sophisticated, organizations and users face growing risks of data breaches, service outages, and other malicious actions.
As the number of devices connected to the internet continues to grow, the attack surface and security risks are increasing, and your business could be the next target. Every digital system, whether a smartphone, computer, server, smart TV, self-driving vehicle, or other connected device, is a potential target of a cyber-attack, malware, phishing, ransomware, or other threat.
One way of staying safe is to continuously monitor the threat landscape and identify current attacks and vulnerabilities. You can then use that threat information to improve your security defenses and protect your systems and users.
Thousands of websites get hacked due to vulnerable files, plugins, networks, outdated software, server misconfiguration, and other security flaws. It’s genuinely useful to watch who is attacking whom, live and globally, and below is a list of the best cyber threat maps for doing that.
Kaspersky Cybermap
Kaspersky Cybermap shows real-time detections per second, graphing all data sources with each one represented by a unique color. You can also add the map to your own website by grabbing the provided HTML embed code.

Kaspersky Cybermap Highlights
- Switch between the map view and detailed data statistics
- Filter results by data source, such as on-access scanner, web antivirus, IDS, KAS, vulnerability scan, on-demand scan, and more
- Statistics show both real-time and historical data for the last week or month
- Sort historical data by country and data source
- See the most infected countries
- Change the page language from English to German, Chinese, French, and several others
SonicWall Live Cyber Attack Map
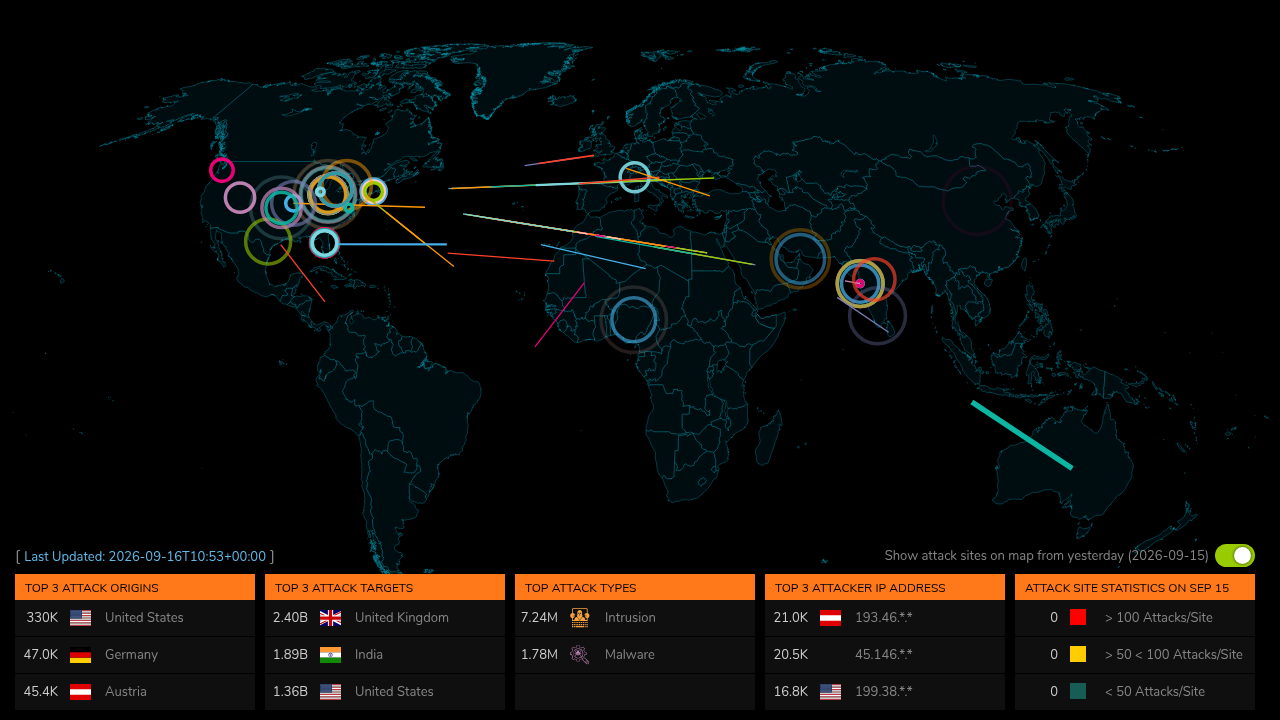
SonicWall’s Live Cyber Attack Map visualizes malware, ransomware, intrusion attempts, encrypted threats, and spam/phishing activity detected across its global sensor network over the past 24 hours, plotting both source and target countries in real time.
SonicWall Live Cyber Attack Map Highlights
- Shows attacks in near real-time, sourced from SonicWall’s own firewall telemetry
- Displays source and target countries for each recorded attack
- Breaks activity down by type: malware, ransomware, intrusions, encrypted threats, and spam/phishing
- Color-codes attack volume on the map for quick scanning
- Backed by an active enterprise security vendor, so the data reflects current attack telemetry rather than a fixed demo
FortiGuard Threatmap
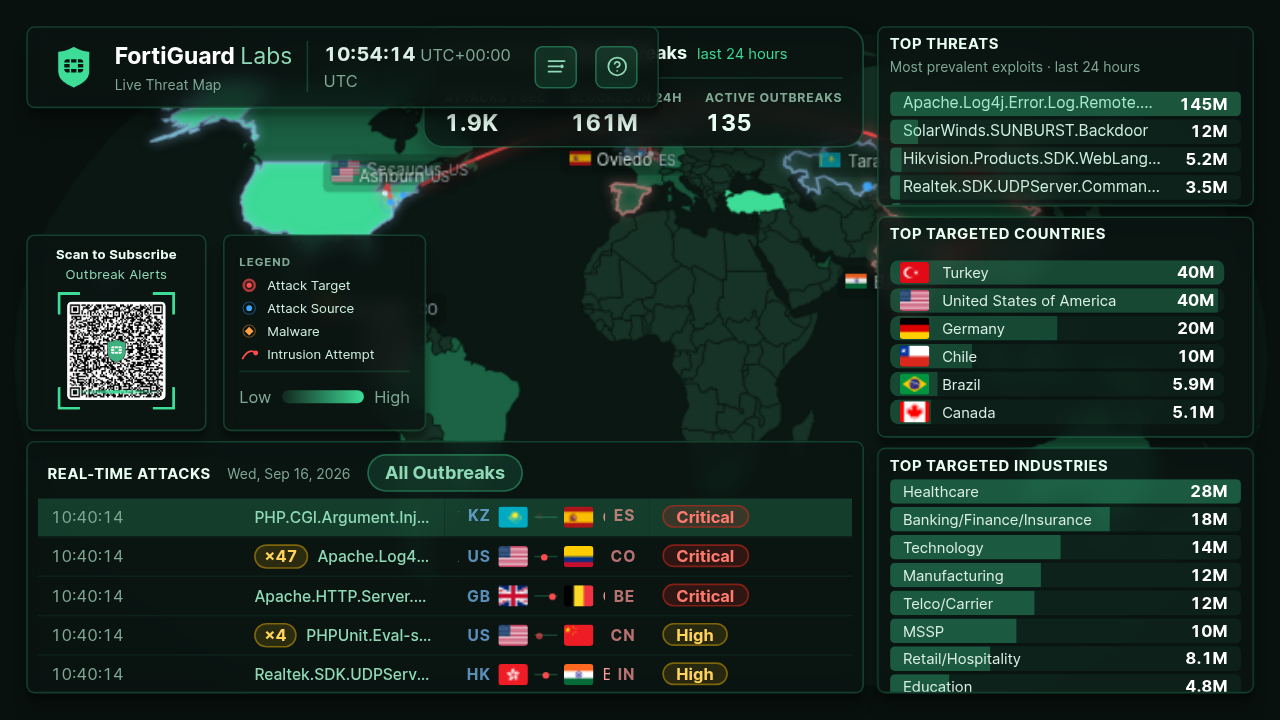
The real-time threat intelligence landscape by FortiGuard provides visualization and logs of threat type, target country, and severity. The map gives teams visibility they can use to evaluate and improve their security posture and resource allocation.
FortiGuard Threatmap Highlights
- Lets teams monitor attacks targeting specific industries and countries
- Includes a chart with country-specific details, such as IP addresses
- Shows incoming, outgoing, and average attack volume
- Easy-to-read cyber-attack statistics, viewable by day and night
- Determine attack type, severity, and location
- Click any country to see incoming and outgoing attacks along with overall real-time activity
- Classifies threats as low, medium, high, or critical
Digital Attack Map
Digital Attack Map displays daily DDoS attacks worldwide. It provides simple attack graphs for the most active source and destination countries and lets you filter the map with multiple options. Security teams can also use the threat intelligence from the map to deploy or enhance their DDoS protection services.
Digital Attack Map Highlights
- Visualizes real-time and historical DDoS attack data worldwide
- Provides anonymized data that shows threat trends through historical and current data
- Explore historical data going back to 2013
- Top daily DDoS data, including the most active source and destination countries
- Shows source and destination country, maximum source and destination ports, and connection types
- Filter results by attack type, and color attacks by type, duration, source, and destination ports
Check Point Threat Map
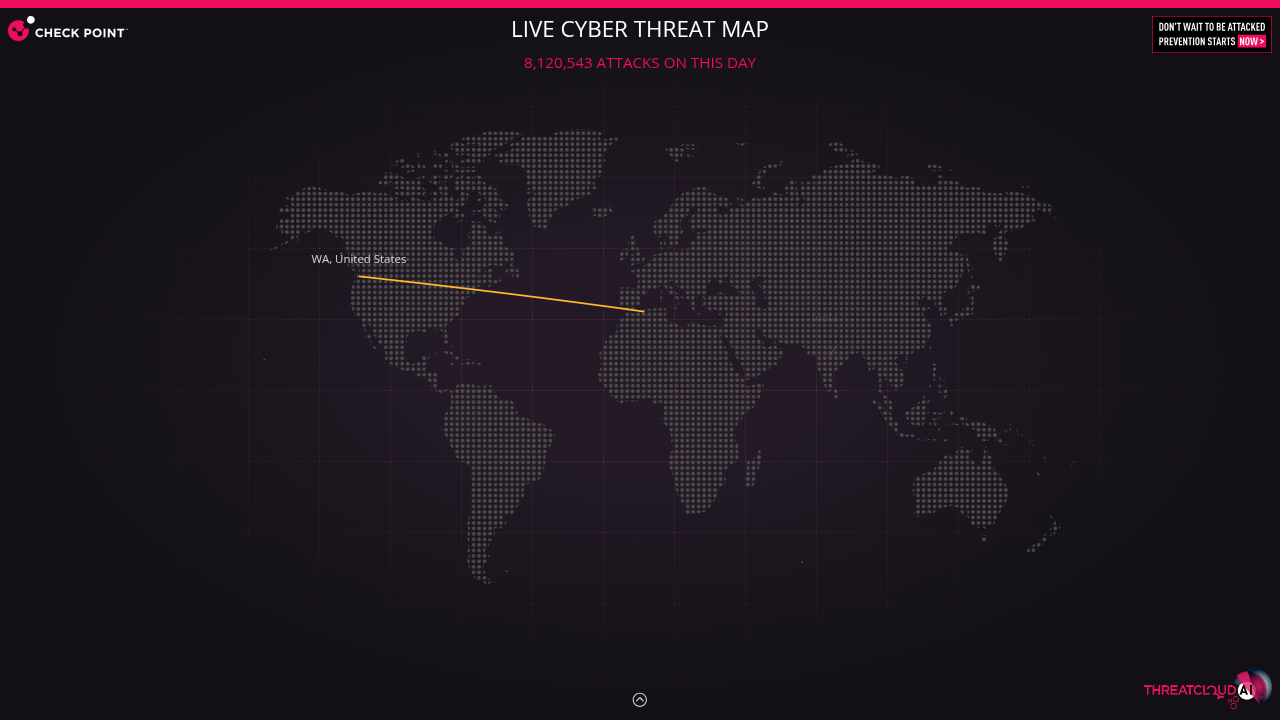
Check Point’s Threat Map displays DDoS attacks in real-time and color-codes them by severity, helping security teams quickly focus on the most critical threats.
Check Point Threat Map Highlights
- Total number of attacks over the last 24 hours
- Current attack rate with threat, source, and target countries
- Top targeted countries and industries
- Click a country to see its attack trend over the last 30 days
- Malware trends by type, based on the number of affected organizations
- Color-coded map covering malware attacks, phishing attacks, and exploits
Bitdefender Real-Time Threat Map
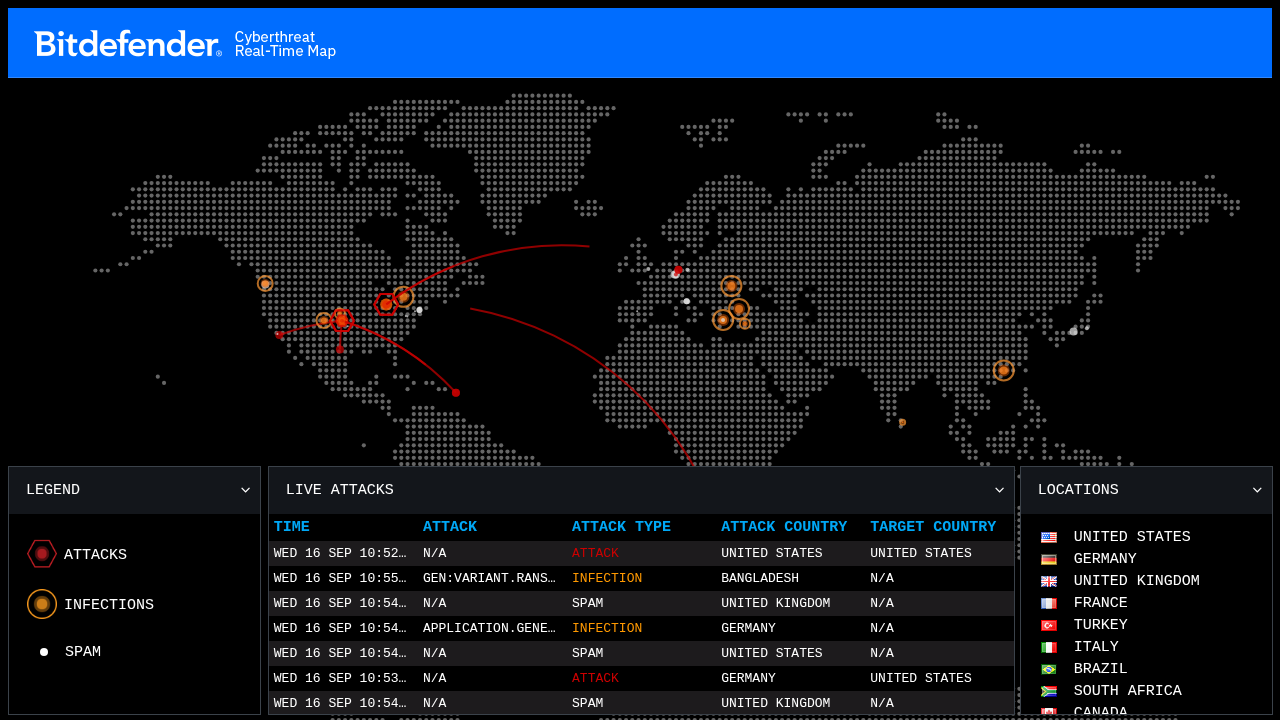
Bitdefender’s threat map tracks infections, attacks, and spam, and displays them as they’re detected.
Bitdefender Threat Map Highlights
- Shows attack types as cyber-attack, spam, or infection
- Visualizes attacker and victim countries
- Highlights the most affected locations and tracks malware outbreaks as they spread
- Shows regional threat variations via source and target country data
- Time, category, and type of attack data to help prepare a rapid response
- Different color codes for attacks, infections, and spam
Talos Cyber Attack Map
Talos, a Cisco company, runs a live cyberattack map showing the top spam and malware senders, with data collected from Cisco and third-party feeds worldwide. You can see the top 10 malware and spam senders along with their volume and country details.
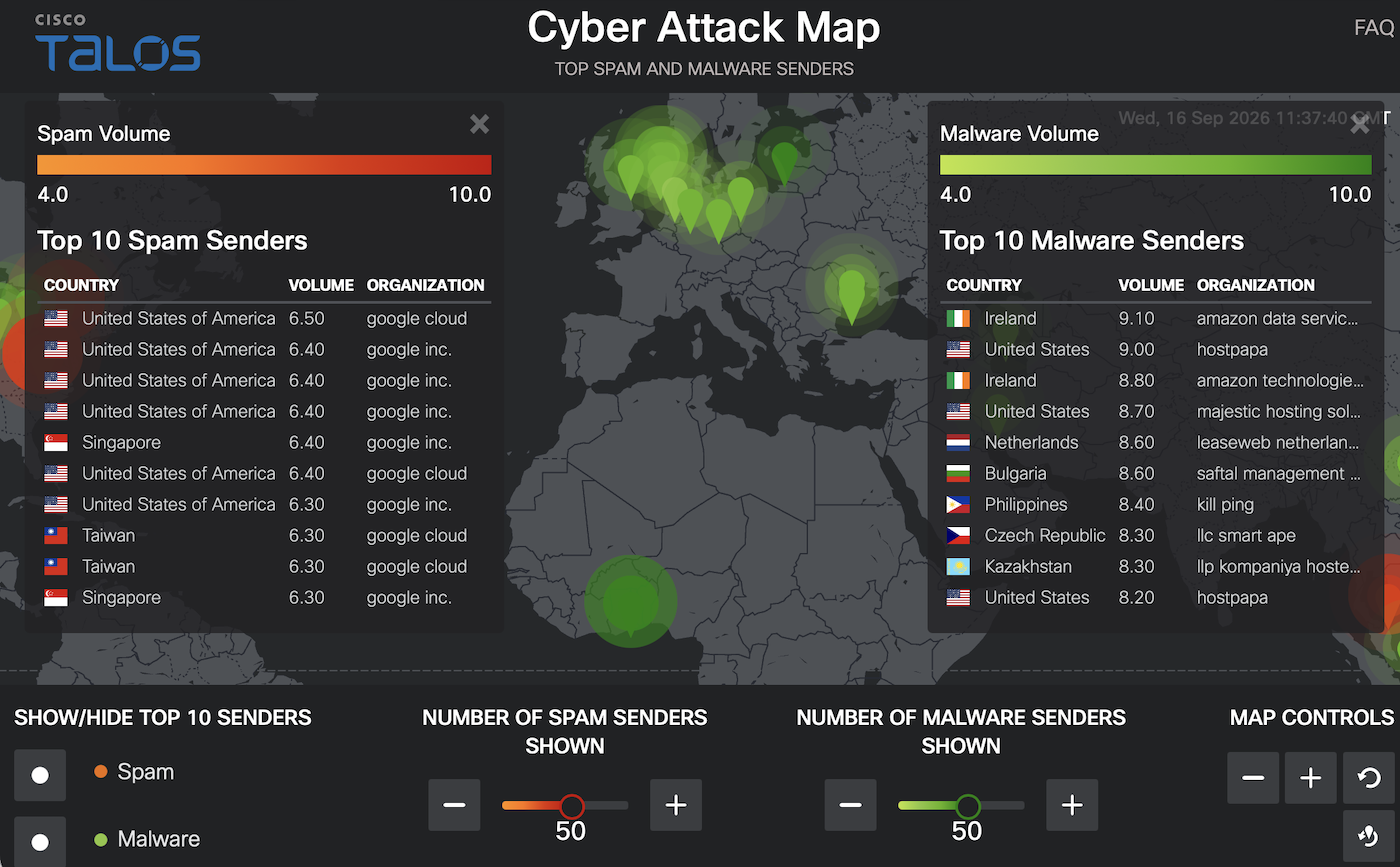
Talos Cyber Attack Map Highlights
- Click an attacker’s location to see details like IP address, hostname, last-day volume, and threat type (malware, spam, etc.)
- Adjust the number of spam and malware senders shown using slider controls
- Statistics displayed alongside the map
- Show or hide stats for the top 10 spam or malware senders
- Zoom controls for the map display
Cyber Threat Horizon
NETSCOUT Cyber Threat Horizon is a situational awareness platform showing real-time threat activity worldwide. You can highlight an attack destination on the map and see details like source and destination countries, max bandwidth, max packets, duration, source and destination ports, and attack type.
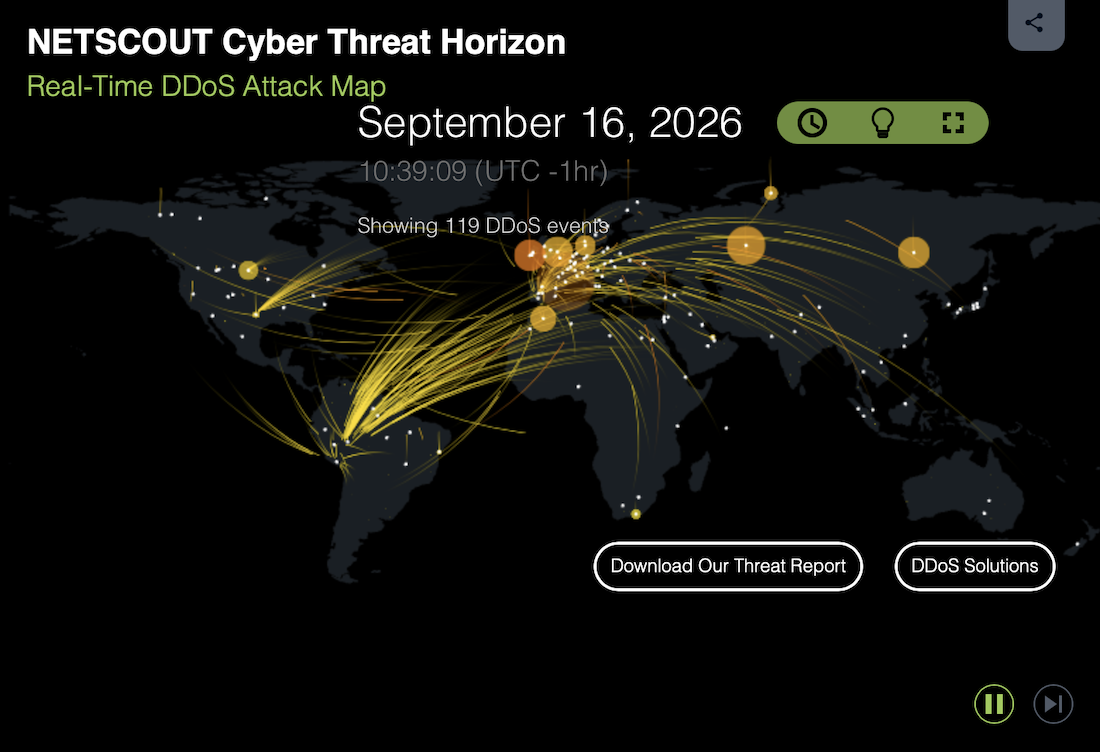
NETSCOUT Cyber Threat Horizon Highlights
- Displays near real-time DDoS attacks worldwide
- Shows malicious traffic across the world, with industry, region, and severity details
- Statistical results for top attack source and target countries and industries
- Filter results by bandwidth, source, destination, event type (UDP, IPv4, DNS amplification), and event category (amplification, volumetric, TCP connection)
- See top trigger types
Radware Live Threat Map
Radware’s Live Threat Map displays intruders, anonymizers, scammers, and web/DDoS attackers, along with statistics for the top 5 attackers and victims, including their countries and percentage share.
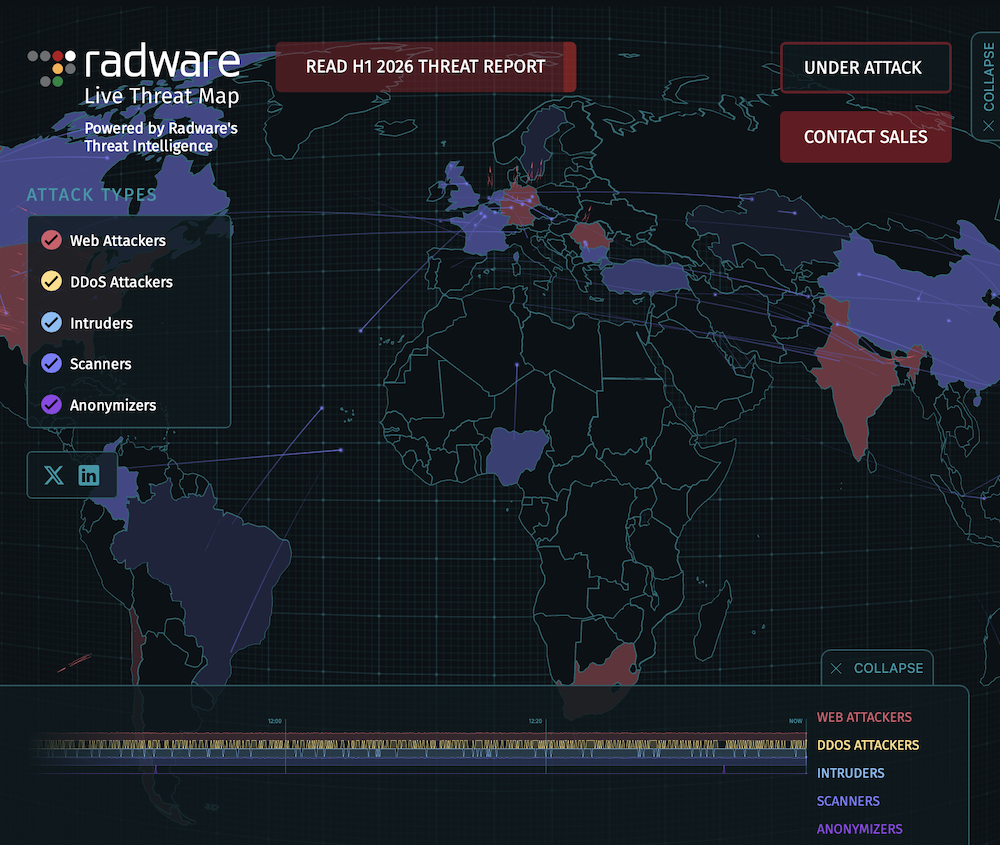
Radware Live Threat Map Highlights
- Customize which attack types display on the map
- Statistics for top network attack vectors and application violations
- Top UDP and TCP ports scanned
- Toggle the statistics interval between 1 hour, 24 hours, or one month
- Collapse or expand the attack-type timeline alongside the statistical data
Imperva Cyber Threat Attack Map
Imperva’s cyber threat attack map is customizable, letting you choose which attack type to display. Available options include automated threats, DDoS, and OWASP-category attacks.
Imperva Cyber Threat Attack Map Highlights
- Top three attack source countries with their percentage share
- Total number of attack requests per day
- Top attacks for the day with source and target countries, industry, attack type, and client
- Top three target industries and top five attack vectors, source, and target countries
- Download the current global threat analysis report
HTTPCS Cyber Map
HTTPCS’s real-time cyberattack threat map displays the latest attacks and lets you filter them by daily attacks, database breaches, and hacked websites.
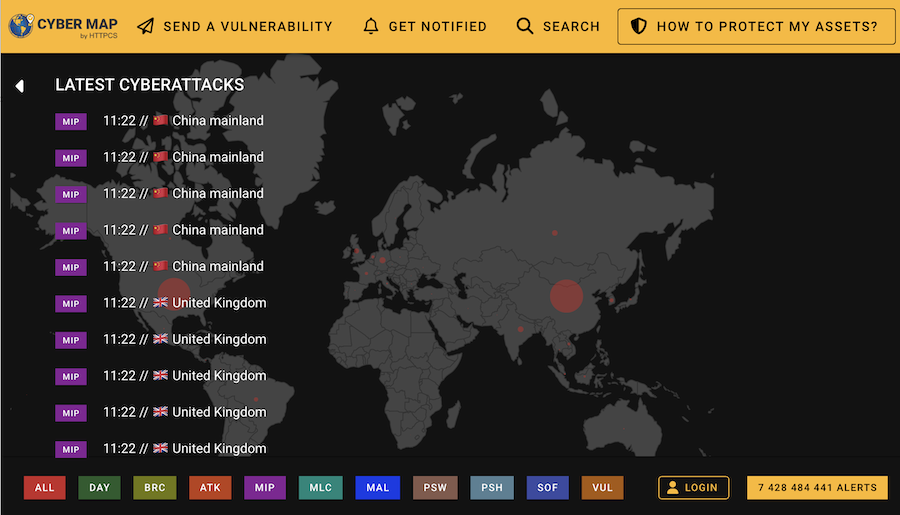
HTTPCS Cyber Map Highlights
- Filter threats by country
- Displays hacked websites and vulnerable websites/software
- Register for more detailed results and features
- Displays malicious IP addresses, providers, and websites
- Click any country to see statistics on all attacks and vulnerabilities there
What Is a Cyber Threat?
A cyber threat is an online action by criminals attempting to gain unauthorized access to IT systems, steal or destroy sensitive information, compromise systems, or carry out other malicious acts. The number of attacks keeps increasing as bad actors find new ways to identify and exploit security vulnerabilities.
Cybercrime is projected to cost the world over $10.5 trillion annually, according to widely cited industry estimates, a figure that keeps climbing as ransomware, supply-chain compromises, and AI-assisted phishing campaigns scale up. Millions of servers and websites get compromised every year, resulting in data theft and other malicious activity globally.
Importance of Cyber Threat Maps
Monitoring real-time cyber threats lets security teams spot trends and potential threats targeting their country and industry. Cyber threat maps are one of the more direct ways to see current and historical threats: they visualize global attacks in real time, showing source and destination countries, severity, threat types, and the most targeted industries.
The cyber-attack map visualizes global threats in real time, showing volume, source, and target countries. Some maps also add IP addresses and color-code attacks by severity. This threat intelligence gives organizations and other stakeholders, such as internet service providers and security companies, useful insight for strengthening their defenses against attacks targeting their region.
How Do Cyber Threat Maps Work?
Using data from millions of sources, providers collect, analyze, and visualize information that helps organizations understand current threat trends. The maps help identify attack patterns and potential threats, giving teams an opportunity to address vulnerabilities before cybercriminals exploit them.
A cyber threat map is a visual representation of near real-time and/or historical threats across the world. The details shown vary from one provider to another, but most include threat type, severity, volume, and source/target countries.
Regardless of the specifics, these maps give organizations and stakeholders like internet service providers useful threat intelligence: a way to evaluate their systems, see what’s targeting their region, and make better decisions about strengthening their defenses. The visualizations are built from data collected by sensors, threat intelligence networks, and other security systems across the globe.