What happens if a website visitor is unable to sign up on your web app or even check out during a purchase? They’re likely to look for another solution, which is a competitor. Users are usually the first to notice when your website breaks or slows down. I’ve seen how even a few minutes of downtime or a failed checkout flow can lead to lost revenue and frustrated users. This is exactly where synthetic monitoring tools come in.
Synthetic monitoring lets you simulate user interactions such as loading pages, logging in, or completing transactions. Unlike basic website or uptime monitoring tools, which only check whether your site is online, synthetic monitoring goes deeper by testing how your application actually performs. Moreover, unlike Real User Monitoring (RUM), which tracks real visitors, synthetic tests run continuously even when no users are active.
Our Geekflare team has reviewed various tools to present you with the best synthetic monitoring options. I’ve grouped them based on different needs:
- For Startups & SMBs
- Enterprise teams
- Technical teams wanting free/open-source options
Synthetic Monitoring Tools for SMBs & Startups
Most small businesses and startups don’t have large budgets or big DevOps teams to always monitor their websites. As such, they rely on synthetic tools that are affordable, easy to set up, and effective enough to detect issues before real users encounter them. The following are some affordable, easy-to-deploy synthetic monitoring tools suitable for growing businesses and startups.
Checkly
Best for Code-First Testing
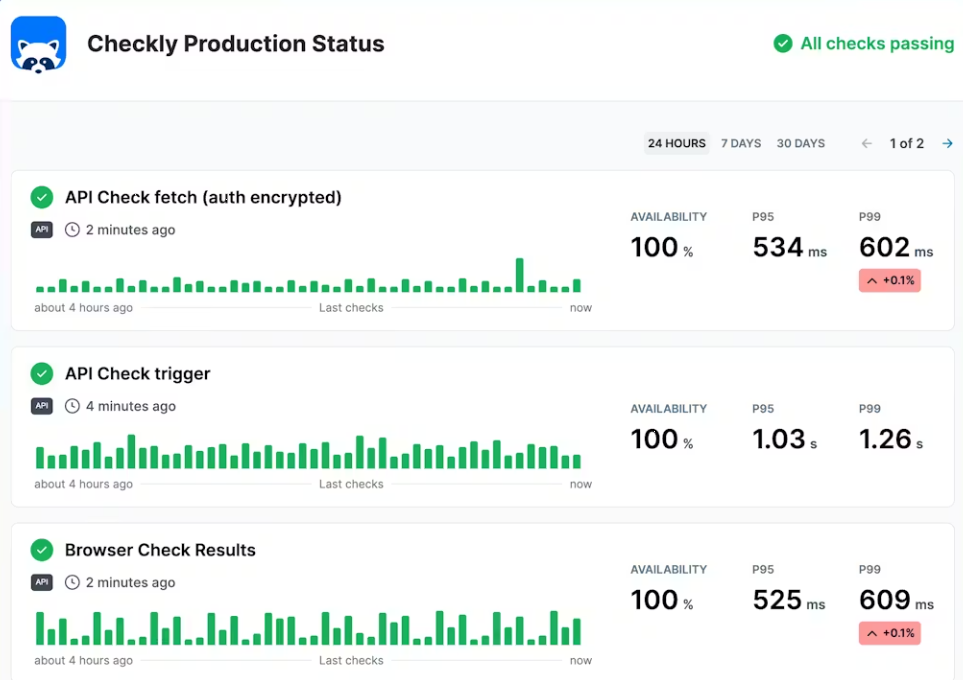
Checkly is a code-based monitoring tool that you can configure with Playwright, Terraform, or its CLI. This tool allows developers to configure the entire workflow to run end-to-end tests or monitor uptime without manual intervention. With Checkly, you can monitor user flows, transactions, and content from real browsers spread across its global infrastructure.
You don’t have to create everything from scratch each time you run synthetic monitoring. Write these scripts once and reuse them as many times as you want to continuously monitor and validate Cron Jobs, UI, and APIs. You can write your tests in JavaScript or TypeScript.
Checkly gives timely reports when a synthetic monitoring check fails. You can configure it to send instant alerts via Slack, SMS, email, or PagerDuty. The tool also offers TCP and heartbeat monitoring to ensure that backend services and scheduled jobs run on time and to send timely notifications if they don’t.
Pros & Cons
PROS
CONS
Pricing
Checkly has a free plan that offers 10 uptime monitors, 1000 browser checks, and 10k API checks. Paid plans with higher limits start from $24/month.
Site24X7
Monitor Pages Behind Login
Site24X7 by ManageEngine is a tool you can use to assess front-end performance and record all your transactions on a web application. This tool simulates user interactions on real Chrome, Firefox, and Edge browsers to verify the availability and performance of web transactions. It also lets you understand how users are interacting with your application.
You don’t need to be a developer to use Site24X7, as it includes an easy-to-use no-code recorder. You can always play back all recorded transactions in a real browser and even obtain a step-by-step analysis of how users interact with your application. Edit and tweak the transaction scripts easily in case you’re not satisfied with the monitoring progress.
Site24X7 produces exhaustive reports you can share with stakeholders. The tool offers scripts that simulate various user scenarios, such as searching for products, logging in, or making a purchase. It executes these scripts across various global locations and records key performance indicators, such as throughput, response time, and error rates.
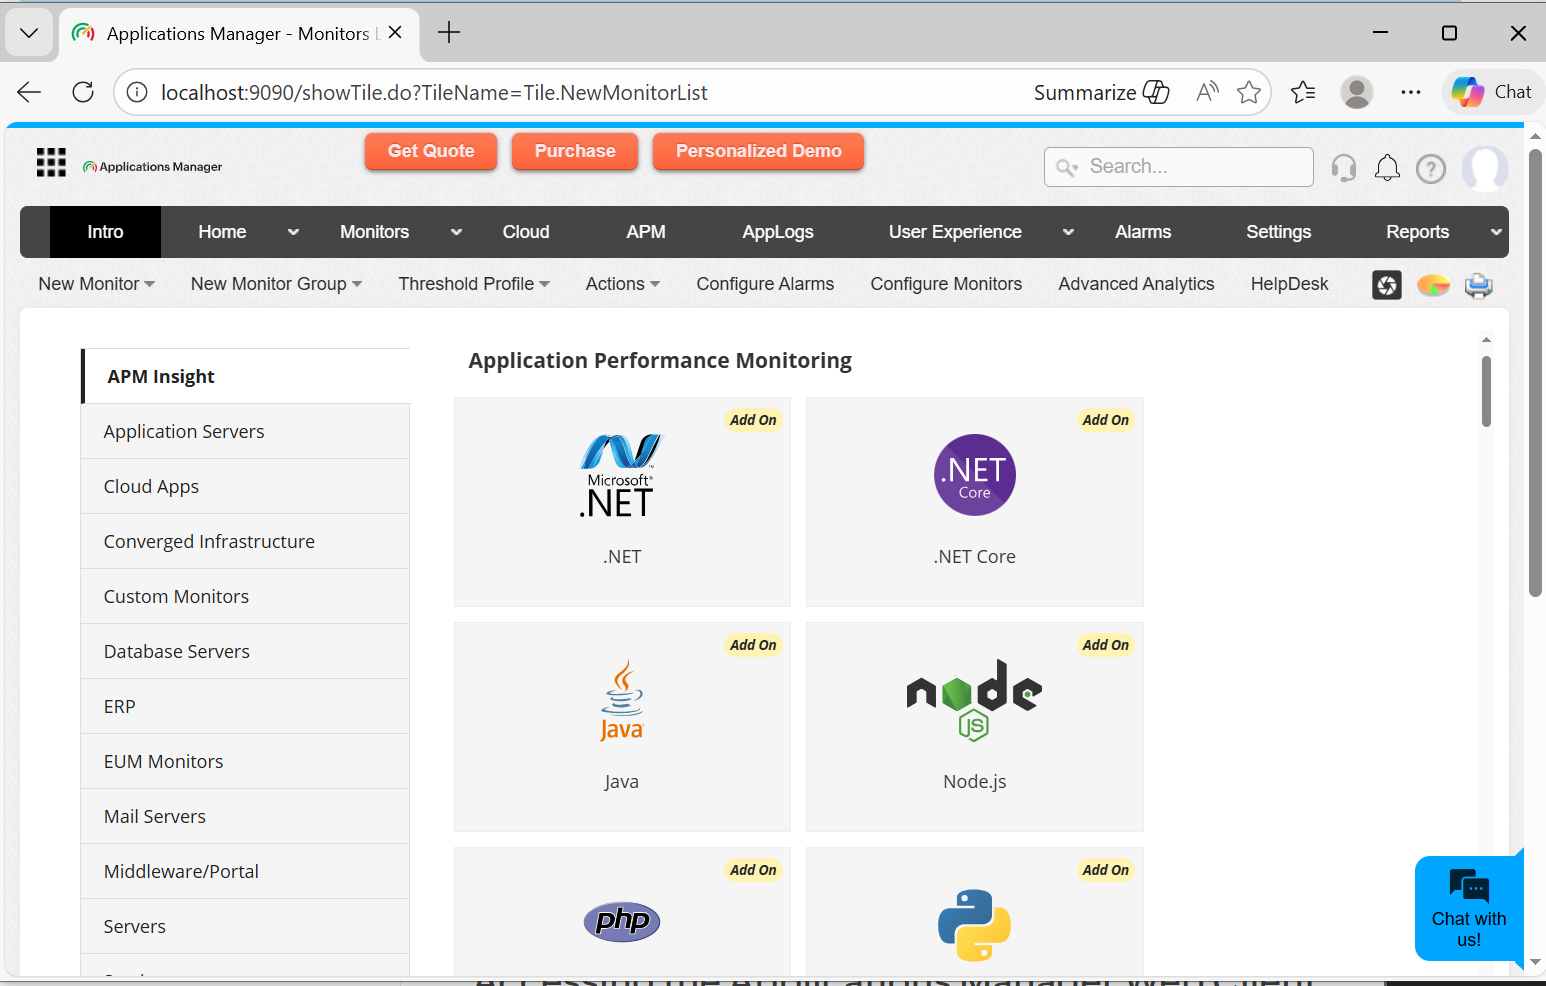
ManageEngine has another self-hosted product, Application Manager, suitable for growing businesses and those seeking a tool that they can host internally. With it, you can monitor multiple URLs and URL sequences, as well as the availability of web apps from different locations. You can run the tool in your data center while deploying several EUM agents across different geographic locations. However, all these will report the application’s performance data to a central tool.
Pros & Cons
PROS
CONS
Pricing
Site24x7 doesn’t offer a free plan but allows new users to try its premium features for 30 days. Moreover, the platform doesn’t display its pricing publicly, but you can request a quote.
Sematext
Best for Budget-Friendly Monitoring
Sematext is a synthetic monitoring tool for web applications and APIs. The tool simulates user interactions and requests from both private and public locations, allowing website owners to detect issues early, before they affect end users. You can also use Sematext to test internal systems, such as web applications and APIs that are inaccessible from the public internet.
Sematext simulates real user interactions, such as form submissions, e-commerce transactions, and clicks. You can then integrate browser-based synthetic tests with your preferred CI/CD tools and catch performance issues early enough before they affect end users. This ensures that you validate checkout processes and login flows before deployment.
Sematext offers proactive alerting and issue detection, identifying critical incidents and sending instant notifications. You configure alert rules to monitor availability, error rates, or performance thresholds and receive notifications via webhooks, email, Slack, or PagerDuty. Sematext also provides a unified interface that displays synthetic test results, logs, events, and metrics for easier troubleshooting.
Pros & Cons
PROS
CONS
Pricing
Sematext doesn’t have a free plan but offers a 14-day trial. That said, Sematext has different pricing plans for different use cases. For instance, you can choose pay-as-you-go for synthetic monitoring, paying $2 per HTTP monitor and $7 per browser monitor. Or go for monthly plans, starting at $29 per month for 40 HTTP and 5 browser monitors.
Uptrends
Best for Global Transaction Testing (230+ Locations)
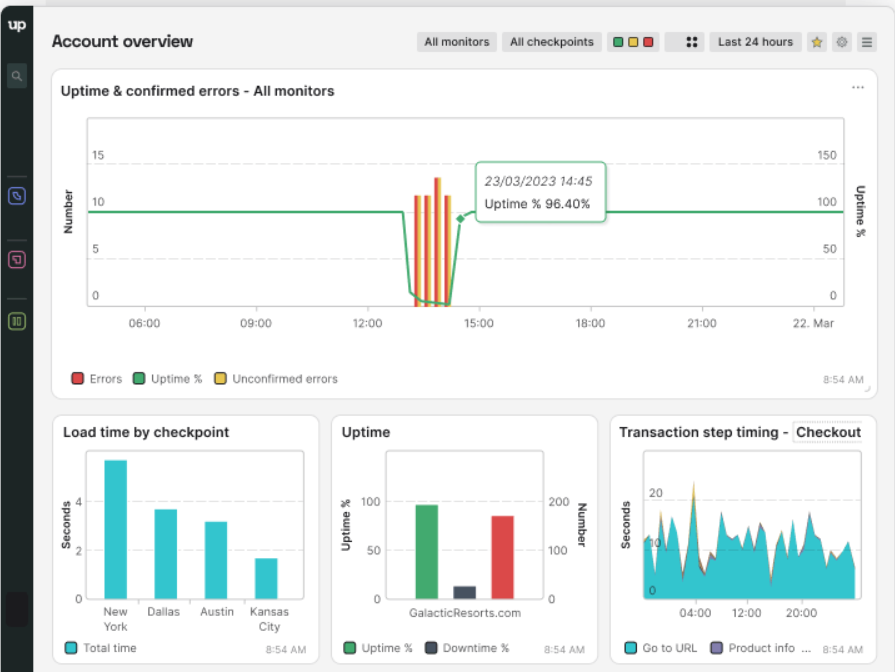
Uptrends Synthetics is a performance, functionality, and user interaction monitoring tool for web applications and APIs. This tool has over 230+ global checkpoints to record transactions such as shopping baskets, form submissions, and logins. Uptrends alerts website owners instantly when any problems arise and sometimes sends screenshots to let them know the exact issue.
Uptrends’ Transaction Recorder records all the critical transactions, such as sign-ups and logins, directly in a browser. You can use the visual editor to build and edit scripts that fit your workflows. Uptrends records transactions every 5 minutes on the free plan, ensuring that users can access and transact on your website at any time.
Uptrends offers private checkpoints for your APIs. Its custom scripting and advanced response parsing features provide the flexibility needed to simulate real-world API scenarios. You can define custom limits that identify performance issues before they affect end users of these APIs. Uptrends performs multi-step API checks, ensuring you get a complete picture of what is impacting user experience.
Pros & Cons
PROS
CONS
Pricing
Uptrends has a free package that supports 1 user, 3 public status pages, pre-selected checkpoints, and email alerts. Paid plans that support more users, more frequent synthetic checks (as short as 2 minutes), and multiple checkpoint regions start at $4 for 6 uptime credits and $29 for 50 browser monitoring credits.
Pingdom
Best for Transaction Testing and Performance Analysis
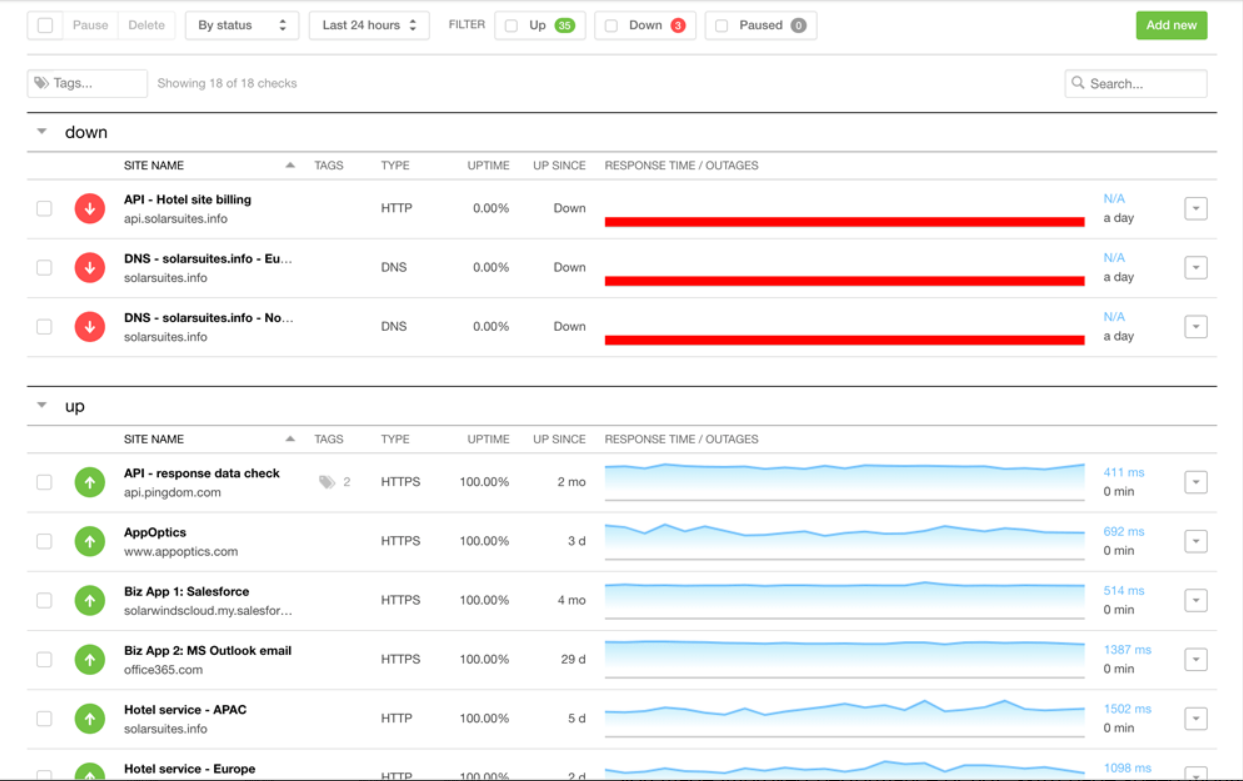
SolarWinds Pingdom Synthetic Monitoring simulates visitor interactions on web applications and immediately alerts owners when a critical site flow is broken, the website is slow, or the website is unavailable. The transaction monitoring feature checks for transactions such as checkouts, searches, and logins to ensure that end users can always transact on your website.
Pingdom Synthetic Monitoring monitors both simple and complex transactions, such as shopping-cart checkouts, new-user registrations, and URL hijacking. You don’t need any coding knowledge, as the tool records site interaction flows with a few clicks. You can also write your own script using the built-in editor that will suggest all the validations and steps you should take.
Pingdom implements its synthetic monitoring on a real Chrome browser. The tests run frequently, as you can set them to run every 5 minutes or once per day on probe servers across the globe.
Pros & Cons
PROS
CONS
Pricing
Pingdom doesn’t have a free plan but offers a 30-day free trial that includes synthetics and RUM. Pricing starts at $10/month for up to 10 uptime checks and 50 alerts
DebugBear
Best for Lighthouse Audit
DebugBear’s synthetic monitoring tool conducts front-end performance tests by running entire pages in the browser. It focuses on user-centric metrics, tracking indicators such as Google’s Core Web Vitals to determine how quickly your page responds to visitors. DebugBear ensures you get accurate results by measuring your website’s performance across over 30 global locations.
DebugBear is big on reporting, as users can see exactly what happens when a page loads and identify what might hold back rendering. It also has a built-in Lighthouse feature where every report includes a detailed analysis from Google’s Lighthouse tool showing performance, accessibility, and SEO stats. You also get tailored recommendations for improving user experience and speed.
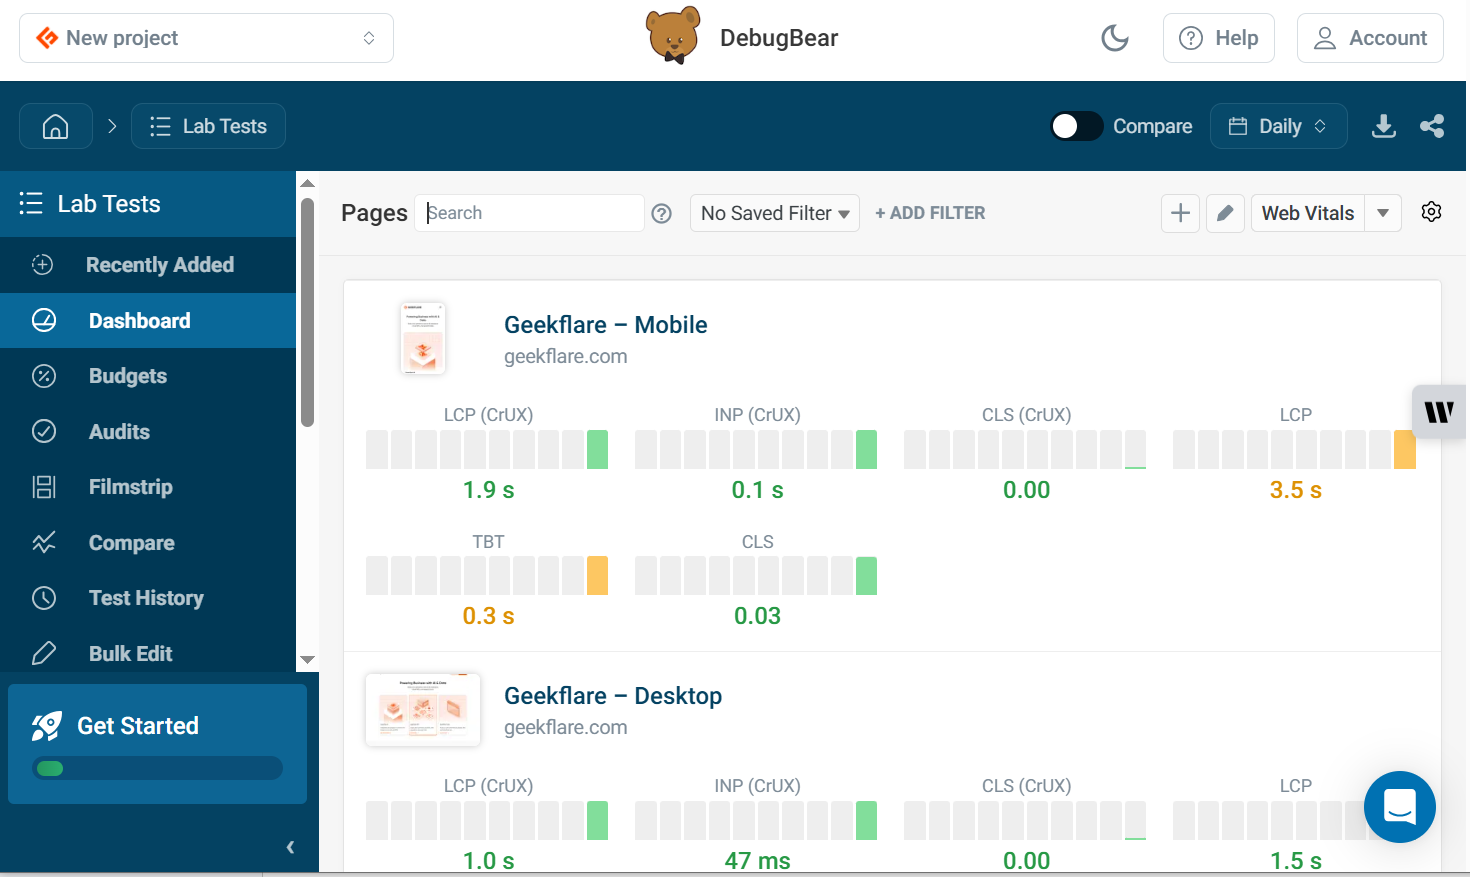
DebugBear allows users to do page speed experiments and optimize their websites without deploying code. This means you can tweak your code until you’re satisfied and only deploy when you hit satisfactory levels. Get alerted via Slack, Teams, or email when DebugBear detects significant changes in your web application so you can act accordingly.
Pros & Cons
PROS
CONS
Pricing
DebugBear doesn’t have a free plan, but allows users to test its features for 14 days without adding a credit card. The cheapest plan that includes 350 synthetic tests, supports 1 user and 1 project, and includes page speed experiments and Google CrUX Data costs $49/month.
New Relic
Best for Full-Stack Observability
New Relic’s synthetic monitoring tool simulates user journeys on web applications throughout the application lifecycle to protect your customers from outages that affect transactions. The tool proactively checks for and detects low-performing entities, such as APIs, URLs, and web services, and sends alerts so their owners can act before end users are impacted.
New Relic provides end-to-end monitoring to help troubleshoot across your stack. It provides detailed reports showing endpoint failures, so you can determine whether the issues stem from backend services, cloud service outages (e.g., AWS), or third-party resources. New Relic also shows all the dependencies that affect synthetic tests.
New Relic simulates users across different OSes, devices, and browsers to identify underperforming areas. It also tests traffic across thousands of private and public locations, making it easy to catch errors early before shipping applications.
Pros & Cons
PROS
CONS
Pricing
New Relic has a free plan that supports 1 user and offers 100 GB/month of data ingestion. However, while the platform doesn’t publicly display its pricing, it offers a pay-as-you-use model and provides quotes on request.
Betterstack
Best for Simple Uptime Monitoring and Phone Alerts
Betterstack’s uptime monitoring tool has a full-fledged JavaScript runtime that monitors all transactions to ensure effective user interactions. The tool records all error messages from your API or website and takes a screenshot, so you know exactly what happened and when. Its edge-based traceroute and MTR outputs help you understand request and connection outputs and how they affect performance.
Betterstack uses Playwright Codegen, which lets users create scripts without writing code by walking through the user flow in their browser. Such users can save these Playwright scripts and reuse them for other checks within the same user dashboard. Betterstack’s all-you-can-alert package gives you access to voice calls, push, SMS, Teams, email, and Slack notifications in case of any incident.
Pros & Cons
PROS
CONS
Pricing
Betterstack has a free plan that includes 1 status page, 10 monitors and heartbeats, email, and Slack alerts. Paid plans start from $29/month.
Other Synthetic Monitoring Tools for SMBs & Startups
Here are other synthetic monitoring tools for SMBs & startups that didn’t make in to our main list but deserve honorable mentions:
Dash0’s Synthetic Monitor
SpeedCurve
Apica Vanguard
Dotcom-Monitor synthetic monitoring
Uptime Synthetic Transaction Monitoring
Enterprise Synthetic Monitoring Tools
Enterprise synthetic monitoring tools are well-suited to large-scale, complex systems where performance, reliability, and uptime are critical. They support global testing locations, high-frequency checks, and multi-step user simulations. These are some of the best:
Datadog
Best for AI-Powered Synthetic and RUM Integration
Datadog Synthetic Monitoring is an enterprise tool for detecting user-facing issues and sending alerts before they impact end users. It has a fully hosted, codeless web recorder that allows users to create tests with performance minimums to ensure smooth transactions at all times. Datadog automatically detects UI changes and updates tests to reduce false alarms.
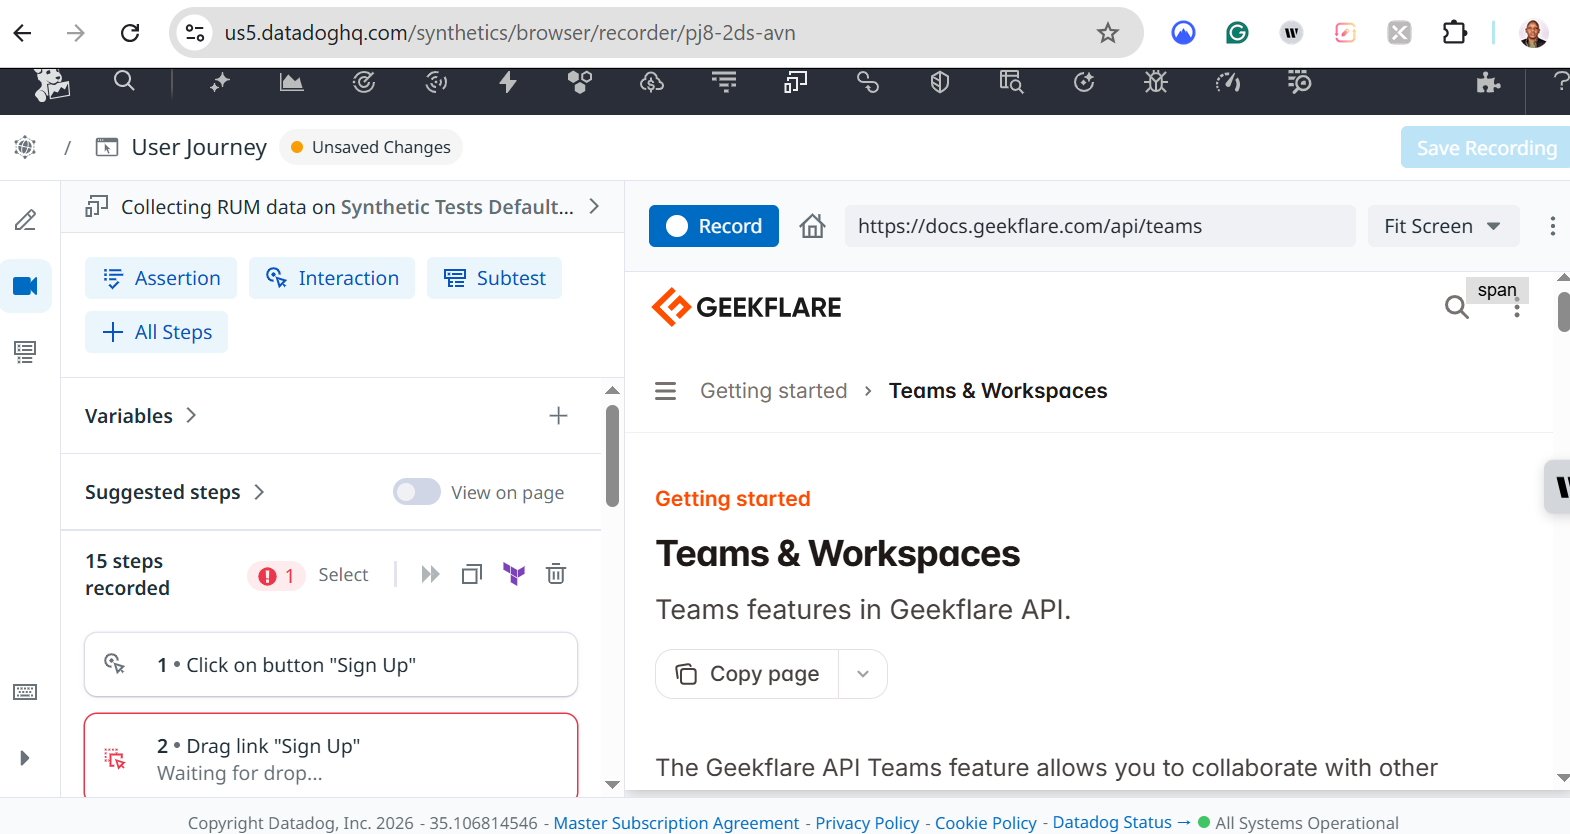
Datadog offers full application-to-network visibility, enabling users to uncover the root causes of transaction failures. The Datadog agent tests real-world conditions and transactions from globally managed locations to ensure you get realistic results. You can thus determine if the failures stem from the application itself or from the network.
Datadog provides one suite for all your testing needs. You can detect issues early, prevent them, and create remedies by incorporating end-to-end tests into your CI pipelines and integrating seamlessly with CircleCI, Azure DevOps, GitHub, GitLab, and Jenkins. You can also integrate Datadog with collaboration tools such as Jira and Slack to avoid context switching and streamline workflows.
Pros & Cons
PROS
CONS
Pricing
Datadog has a free plan supporting up to 5 hosts and 1-day metric retention. Paid plans start at $15/host/month and include a 14-day trial.
Catchpoint
Best for Global Coverage with 350+ Locations Coverage
Catchpoint offers a suite of synthetic and internet synthetic monitoring tools that let users emulate actual end-user behavior and perform API and web tests from cloud locations. It has a large observability network that monitors various connection types such as edge, backbone, last-mile, and multi-access edge. This ensures you measure the reliability and performance of your end user’s experience.
Catchpoint allows users to simulate failover exercises and see the impact of these changes on user experience. You can also use Playwright and Puppeteer to automate simulations and catch errors before they affect end users. You can write scripts from scratch or customize the available ones to fit your synthetic monitoring goals.
Catchpoint sends you real-time alerts via PagerDuty, Slack, or any other available integration when key performance metrics fall below average or exceed the agreed-upon threshold. It also delivers comprehensive reports, enabling you to determine the root cause of the outage and take appropriate action.
Pros & Cons
PROS
CONS
Pricing
Catchpoint’s paid plans start at $10,000 per year. For exact pricing, you need to contact their sales team.
Grafana Cloud
Best for Testing Different Network Levels
Grafana Cloud Synthetic Monitoring tests critical web journeys and the performance of APIs and web applications. This tool compares results with metrics, logs, and traces in Grafana Cloud to help users determine the root cause of failures in user journeys. It also tests different network levels, such as HTTP, HTTPS, TCP, DNS, and Ping, to verify system performance.
Grafana Cloud Synthetic Monitoring features monitoring agents (probes) distributed across global locations to simulate user traffic from those locations. These agents periodically send requests to predefined URLs to measure performance and verify expected outcomes. Users can visualize these tests and alerts on the Grafana Cloud.
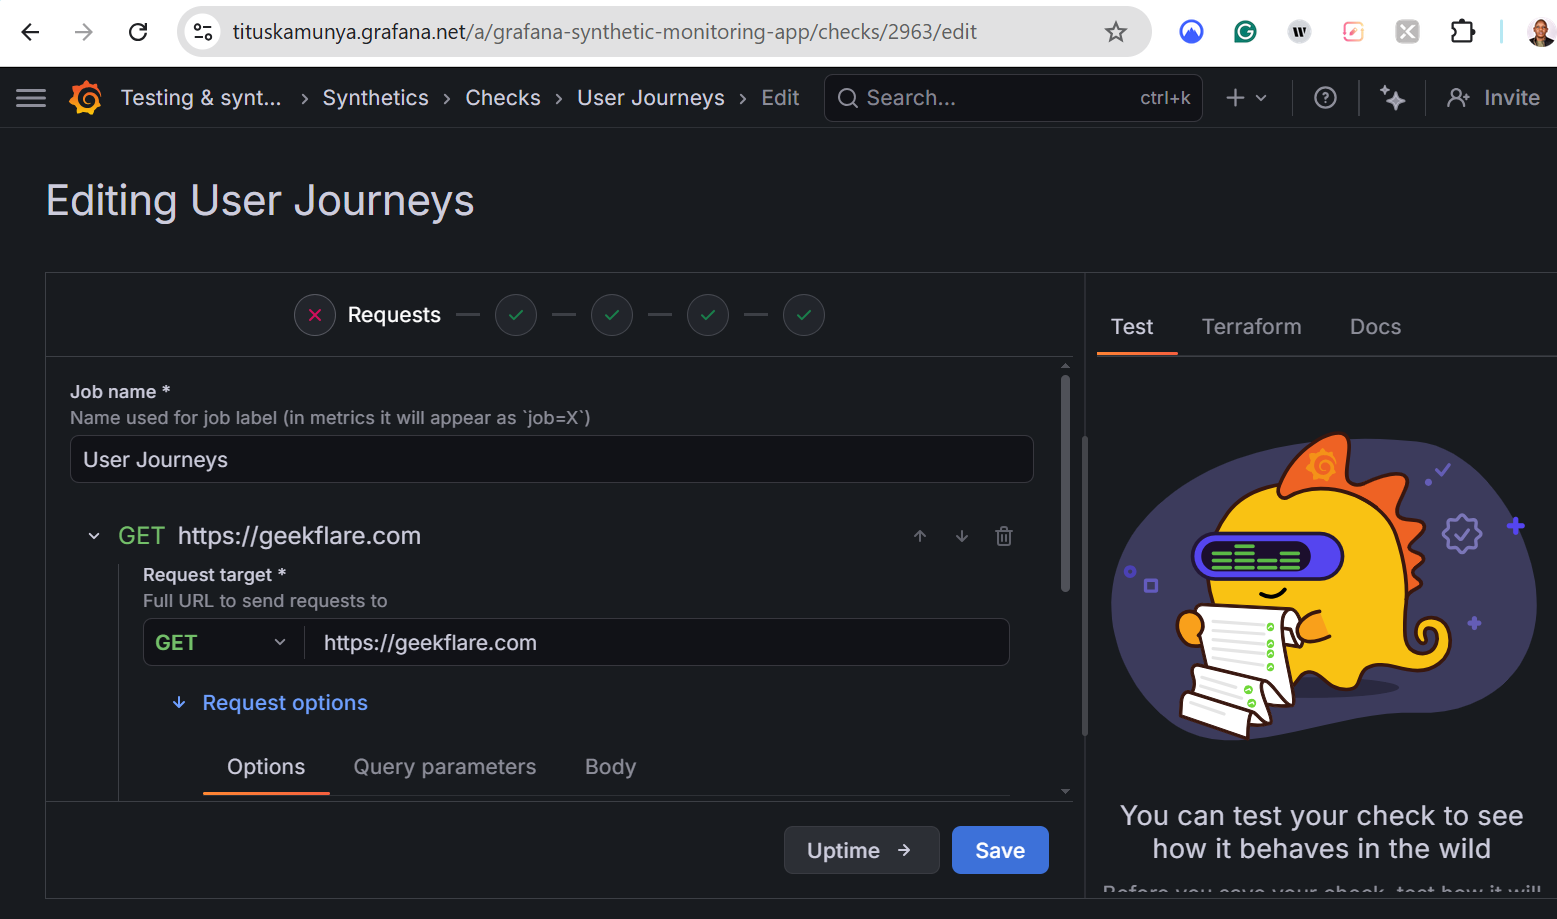
Users define tests and synthetic tests using JavaScript and the k6 API. Write your scripts just once and reuse them in your entire software development lifecycle. Use Terraform or Grafana’s API to automatically maintain and deploy checks. You can also store all the monitoring resources in your GitHub repo alongside your code.
Pros & Cons
PROS
CONS
Pricing
Grafana has a free plan that offers 14-day retention for k6 performance tests, logs, metrics, traces, and profiles. Paid plans, with a 14-day free trial, are charged on a pay-as-you-use basis, start at $19/month + usage, and offer longer retention periods.
Other Enterprise Synthetic Monitoring Solutions
Here are some more enterprise synthetic tools that don’t appear on our main list.
Splunk's Synthetic Monitoring
Dynatrace
Open-Source & Free Synthetic Monitoring Solutions
Open-source and free synthetic monitoring tools are ideal if you want full control, customization, and zero licensing costs. They give users flexibility, self-hosting, and the ability to tailor monitoring to their exact workflows and infrastructure.
Uptime Kuma
Uptime Kuma is a free and open-source synthetic monitoring tool for websites and complex environments such as game servers, SQL databases, and Docker containers. This tool presents the collected data in beautiful visual charts you can use to make decisions. It also has one of the largest collections of alert channels, with 95+ modes to choose from.
Uptime Kuma ensures you never miss issues on your website, with 20-second monitoring intervals. You can also host multiple status pages on your website to ensure that you alert your end users of any outages affecting transactions. Uptime Kuma is available in over 20 languages, ensuring that you can configure monitoring checks in a language you’re conversant with.
OpenStatus
OpenStatus is an open-source uptime monitoring and status page creating tool that helps users monitor APIs and websites from 28 regions. This tool uses multiple cloud providers, such as Fly.io, Koyeb, and Railway, ensuring you always get accurate results even if one provider is temporarily unavailable. OpenStatus allows users to monitor various HTTP/HTTPS endpoints such as webhooks, GraphQL APIs, and REST APIs.
OpenStatus is quite flexible, as you can set a “degraded at” or “timeout” threshold, and it automatically sends you an alert whenever responses exceed the set thresholds. You can always monitor changes through the OpenStatus CLI and its YAML config. You can even monitor services that aren’t available to the public by deploying OpenStatus’ probes to your favorite cloud provider.
OneUptime
OneUptime offers real-time monitoring of containers, servers, APIs, and websites from 7 global locations. This open-source tool allows you to set check intervals, custom success criteria, and test locations. You can then set notification alerts from the available channels and get detailed performance insights to help you act accordingly.
OneUptime provides both public (websites and front-facing APIs) and private monitoring. For the latter, you can monitor air-gapped environments, VPNs, and private networks. This makes it easy to monitor internal databases, infrastructure, and services that are inaccessible from the public internet. Lastly, OneUptime monitors your endpoints every second, ensuring it catches errors early before they hit production.
Other Open-Source and Free Synthetic Monitoring Solutions
Here are other open-source and free synthetic monitoring solutions that don’t appear on our main list:
Zabbix
Icinga
Best Synthetic Monitoring Tools Comparison
| Tool | Free Tier | Checking Frequency | Global Locations | AI-Powered |
|---|---|---|---|---|
| Checkly | Yes | 10 seconds | 20+ | Yes |
| Site24X7 | No (30-day trial) | Not specified | 130+ | Yes |
| ManageEngine | Yes | From 10 minutes | Not specified | Yes |
| Sematext | No (14-days trial) | From 1 minute | 9+ | Yes |
| Uptrends | Yes | Every 5 minutes | 230+ | Yes |
| Pingdom | No (30-day trial) | Not specified | 100+ | Yes |
| DebugBear | No (14-day trial) | Not specified | 30+ | Yes |
| New Relic | Yes | Not specified | 18+ | Yes |
| Betterstack | Yes | 30 seconds | Not specified | Yes |
| Datadog | Yes | Not specified | Not specified | Yes |
| Catchpoint | Yes | Not specified | 353+ | Yes |
| Grafana Cloud | Yes | Customizable | 20+ | Yes |
| Uptime Kuma | Completely free | 20 seconds | Not specified | Not specified |
| OpenStatus | Yes | Not specified | 28+ | Not specified |
| OneUptime | Yes | 1 second | Not specified | Not specified |
Synthetic Monitoring vs. Real User Monitoring (RUM)
Synthetic Monitoring and Real User Monitoring (RUM) both help you understand application performance, but they work very differently. The key difference is that synthetic monitoring simulates user behavior, while RUM tracks actual user interactions in real time.
What Synthetic Monitoring Tracks
Synthetic monitoring uses scripted tests to simulate user journeys like logging in, searching, or completing a checkout. These tests run continuously from different locations, even when no users are on your site. This means you can detect downtime before users notice, test critical flows such as sign-ups and payments, and monitor performance across global regions.
Use case: If you run an e-commerce store, synthetic monitoring can simulate a full checkout process every few minutes. If the payment step fails, you’ll know immediately, before you lose real customers.
What Real User Monitoring (RUM) Tracks
RUM collects data from actual users as they interact with your application. It tracks real metrics like page load times, device types, browser performance, and geographic user experience.
This helps you understand real user experience across devices, identify slow pages affecting actual visitors, and analyze performance trends based on real traffic
Use case: If users in a specific region, for instance, Asia, experience slow load times, RUM will highlight that issue based on real traffic data, helping you optimize CDN or server distribution.
Application Performance Monitoring (APM) focuses on tracking the internal performance of your application, such as server response times, database queries, and service dependencies. Synthetic monitoring, on the other hand, simulates user interactions to test external availability and functionality.
Synthetic API monitoring involves sending automated requests to APIs at regular intervals to check their availability, response time, and correctness.
The frequency depends on how critical the system or feature is. For instance:
Run monitoring checks for critical systems, such as payments and logins, every 1–5 minutes.
Core business functions every 5–10 minutes.
Important features every 10–15 minutes.
Non-critical pages or services every 30–60 minutes.